To improve the flexibility of injection rate control, this study developed a set of drive current timing strategies for a dual-solenoid-valve injector (DSVCI) featuring (NCV-1) and (NCV-2). These strategies enabled operation in single-valve rectangular, dual-valve rectangular, and ramp injection modes. The corresponding injection characteristics, including injection rate profiles, injection delay, duration, and fuel quantity, were systematically examined across a wide range of conditions. Results show that the ramp mode initiates with a gradual increase in injection rate driven by NCV-1, followed by a sharp acceleration upon NCV-2 activation. The opening delay in ramp mode closely matches that of the single-valve rectangular mode, while its injection onset occurs 0.23 ms later than in dual-valve operation. In contrast, the closing delay in ramp mode aligns with the dual-valve rectangular mode and exceeds that of the single-valve mode. Both ramp and dual-valve modes exhibit reduced injection durations with increasing pressure, whereas the single-valve mode maintains a nearly constant duration at low pressures. Under long-duration injections, the fuel quantity increases linearly in rectangular modes but displays an accelerating growth trend in the ramp mode as NCV-2 activation time increases. These findings provide new insights into the dynamic behavior of the dual-solenoid-valve control injector and highlight the potential of ramp shaping for advanced injection rate control.
- Open Access
- Article
Parametric Investigation on the Responsibility of Dual Solenoid Fuel Injectors with Multiple Injection Strategies
- Chengjun Zhu 1,
- Daijun Wei 1,
- Xiaoyan Wang 1,2,
- Wenshuo Du 1,
- Yanyu Qiao 1,
- Qiang Cheng 1,
- Quan Dong 1,*
Author Information
Received: 01 Aug 2025 | Revised: 03 Sep 2025 | Accepted: 10 Sep 2025 | Published: 17 Sep 2025
Abstract
Keywords
controllable fuel injection rate | dual-solenoid-valve | timing control | multiple injection modes
1.Introduction
In recent years, stringent emission regulations have been introduced to avoid environmental pollution and climate change, which present significant challenges to the internal combustion engine sector. To enhance diesel engine efficiency and reduce emissions, the injection characteristics of the fuel injection system must be optimized for clean and efficient combustion [1]. Among all the injection strategies, variable injection rate technology has emerged as a key development direction for achieving the future goals of energy conservation and emission reduction in diesel engines [2–6].
The variable injection strategies primarily rely on piezoelectric actuator control, hydraulic amplification mechanisms, and optimization of the injector needle valve structure [7,8]. For instance, Ferrari synchronized piezoelectric and solenoid injectors, enabling dynamic adjustment of the injection rate profile by coordinating their operating sequences and injection volume distribution [9]. Liu et al. [10] introduced a booster device between the common rail pipe and the injector in high-pressure common rail systems. By adjusting the timing of the relative control signals of the booster device and the injector solenoid valve, flexible and controllable injection laws were achieved. Xu et al. [11] designed a dual-lift injector based on needle valve limitation principles, allowing for two distinct lift states through the adjustment of the needle valve lift switching valve, thereby enabling flexible transitions between different injection modes. However, these methods still face challenges related to system complexity, control accuracy, and response time, limiting their ability to fully meet the demands for efficient, flexible, and stable injection control.
Extensive research has been conducted on the impact of variable injection rate strategies on combustion and emissions. Willems et al. [12] compared slope and rectangular injection laws in a heavy-duty diesel engine, finding that the slope injection law effectively suppressed NOx formation during early injection phases. Yazdani [13] further explored the effects of different slopes of injection rates on natural gas/diesel combustion, revealing that an optimized slope of the injection rates improved engine efficiency by 54.78%. In another study, Shi et al. [14] examined the effects of various diesel injection rate shapes in ammonia/diesel dual-fuel engines, finding that triangular injection profiles promoted better mixing of diesel and ammonia, fostering more homogeneous combustion. Yousefi et al. [15] investigated staged diesel injection strategies in ammonia/diesel dual-fuel engines, showing that such strategies not only improved fuel economy by 39.72% but also significantly reduced unburned ammonia emissions. These studies underscore the direct influence of fuel injection rate profiles on engine combustion and emissions.
In summary, variable injection rate technologies hold substantial potential for improving combustion and reducing emissions. However, studies on the injection characteristics of different injection modes remain limited. Meanwhile, the current technologies still face several challenges in practical implementation. This study introduces a novel dual-solenoid-valve control injector (DSVCI) and employs multiple drive current timing control strategies to realize various injection modes, including single-valve rectangular, dual-valve rectangular, and ramp profiles. The effects of these injection modes on injection characteristics are systematically explored to advance flexible injection control technologies.
2.Experimental Methodology
2.1.Dual Solenoid Valve Injector
Figure 1 demonstrates the injector employed in this study, which consists of two electromagnetic valves to control the returned fuel channels independently. Diesel fuel serves a dual role, acting not only as the injection fuel but also as the hydraulic medium that controls the movement of the needle valve. The needle valve control chamber is connected to both return fuel chambers, and the movement of the needle valve is regulated by the electromagnetic valves, which control the opening and closing of the control chamber valve. This mechanism enables precise modulation of the injection process.
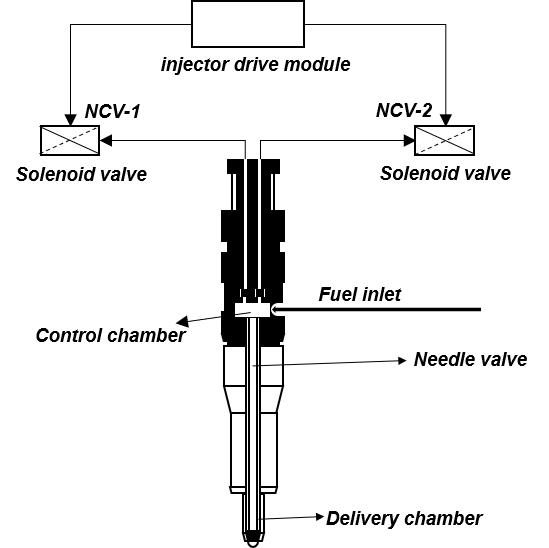
The opening and closing of the needles are controlled by the coupling force of the electromagnetic force, hydraulic pressure in the control and pressure chambers. It should be clarified that the two electromagnetic valves are named as NCV-1 and NCV-2 in this study. The dual-valve and dual-return oil channel design forms the core mechanism for shaping flexible injection patterns. NCV-1 and NCV-2 can operate independently to control the injection rate, or work in coordination to generate more complex injection profiles. The configuration of the two return oil channels enables regulation of the pressure drop rate within the control chamber, allowing precise control of the movement characteristics of the needle valves. By adjusting the drive sequences for NCV-1 and NCV-2, it is possible to generate various fuel injection rate profiles, thereby facilitating fine-tuned control over the injection process.
2.2.Test System
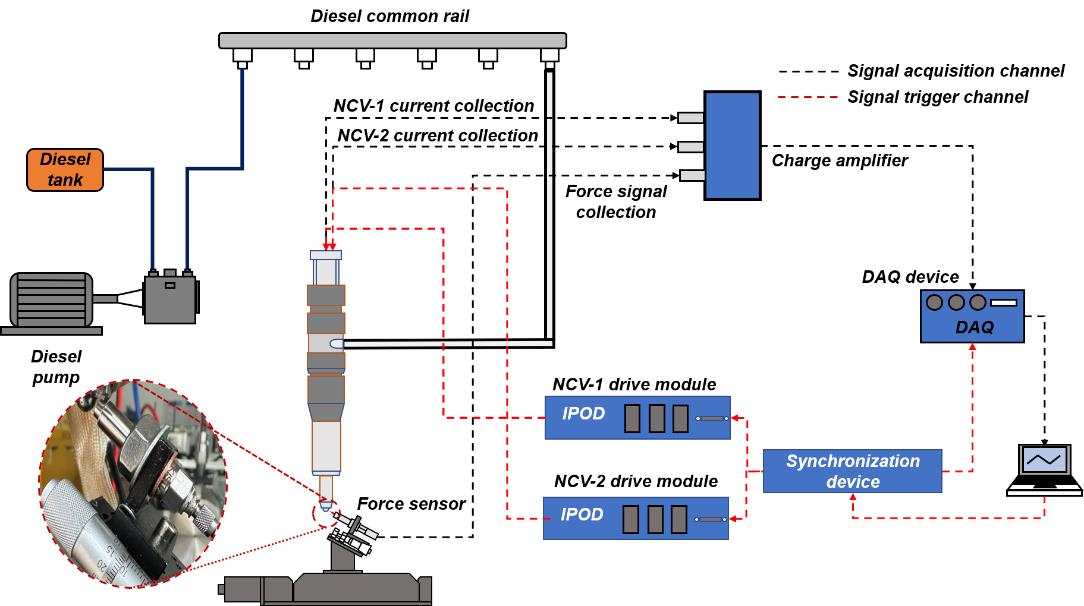
Figure 2 illustrates the injection rate platform based on the spray momentum. This system consists of a fuel supply system, injector, signal trigger module, and data acquisition module. The timing-synchronized microprocessor and data acquisition card are applied for injection triggering and data acquisition. All measurement signals, including injector drive current and force, are captured by the NI-6361 board at a sampling rate of 250 kHz, operating in trigger acquisition mode. The injector drive module employs a parallel dual-channel design, generating drive current for the injector upon receipt of the trigger signal. The device parameters selected by the system are shown in Table 1.
Test equipment model.
| Type | Model Number |
|---|---|
| Force sensor | Kistler9207 |
| DAQ device | NI USB-6361 |
| Charge amplifier | Kistler 5018A |
2.3.Test Method
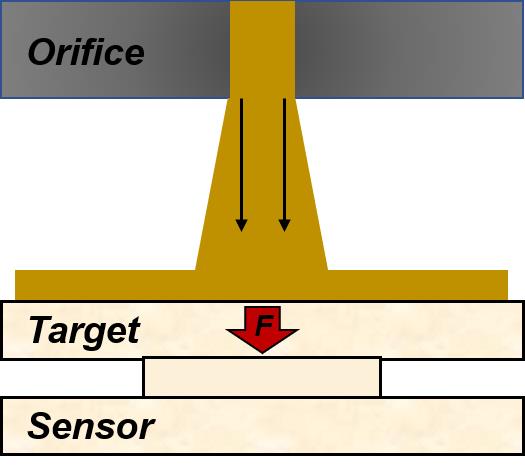
In this study, the spray momentum is measured by a force sensor to derive the fuel injection rate, as shown in Figure 3. This approach establishes a relationship between the impact force and the fuel jet injection rate based on the mass conservation equation and the law of conservation of momentum. Measuring the impact force signal during the fuel injection process provides an effective means of determining the injection rate.
According to the law of conservation of momentum:
The fuel jet between the nozzle and the baffle plate can be derived from the law of conservation of mass:
By combining the above equations, we obtain:
Given the extremely short injection time, the following assumption is made:
By integrating the above relationships, we derive the correlation between the injector’s injection rate and the force signal:
where Ft represents the oil jet impact force signal measured by the force sensor, is the fuel injection rate striking the baffle plate, t is the duration of the impact force, v0 is the fuel velocity at the nozzle outlet, vt is the fuel velocity when it reaches the baffle plate, ρ is the fuel density, A0 is the nozzle area, and n is the number of nozzles.
2.4.Drive Current Profiles under Different Injection Modes
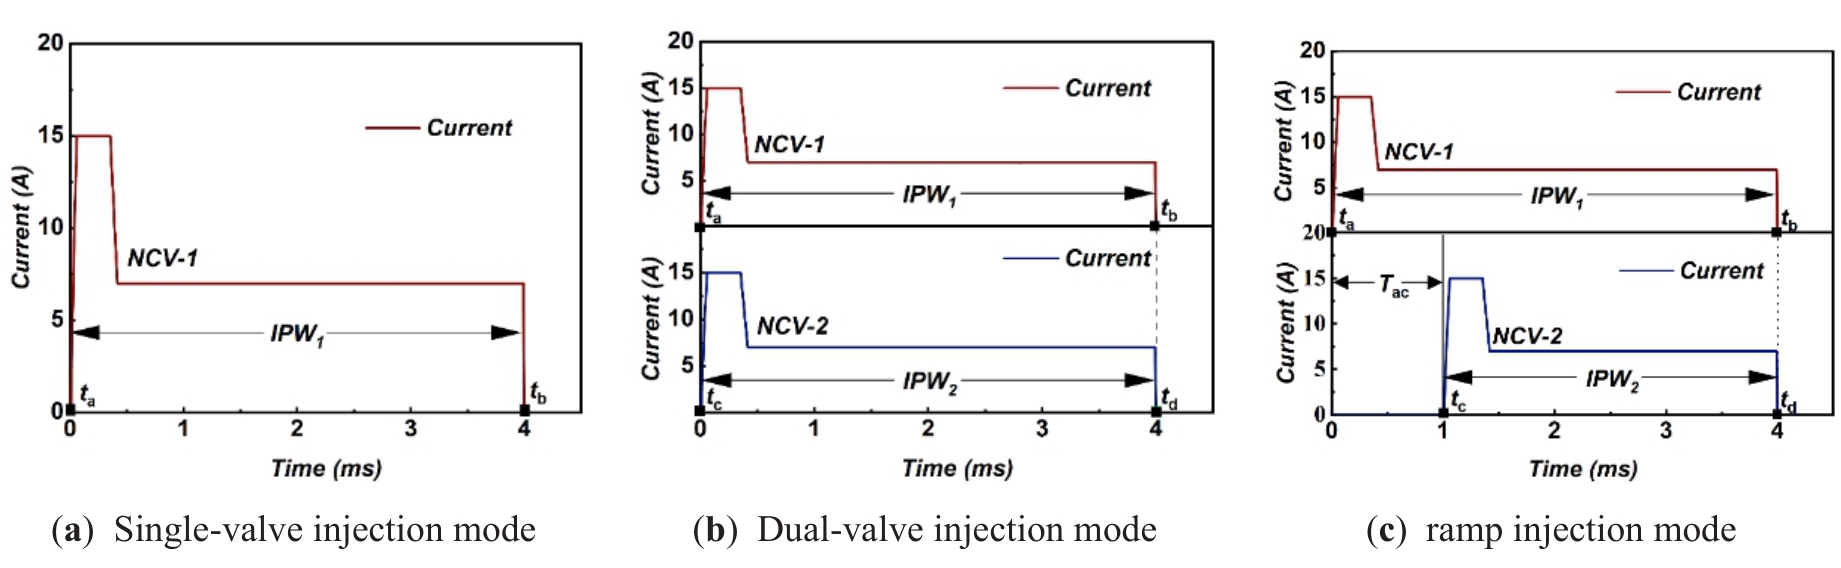
To investigate the injection rate under various injection modes, a series of current profiles is developed to drive the dual-solenoid injector. The injection pulse width 1 (IPW1) is defined as the duration time from the rising edge ta to the falling edge tb of the NCV-1 drive current signal. Similarly, the injection pulse width 2 (IPW2) corresponds to the interval from the rising edge tc to the falling edge endpoint td of the NCV-2 drive current signal. Figure 4a,b presents a schematic of the injection control timing for the rectangular injection mode. When the DSVCI is in single-valve rectangular injection mode, the IPW2 is 0. Figure 4c shows the drive current diagram for the ramp injection mode when IPW1 is 4 ms, IPW2 is 3 ms, and the drive interval is 1 ms. The time interval from ta to tc is defined as the pulse width interval (Tac), NCV-1, and NCV-2, which eventually closed simultaneously. More details of the injection parameters are listed in Table 2.
Rectangular injection mode test conditions.
| Injection pressure/(MPa) | 80, 100, 120, 140, 160 |
|---|---|
| IPW1(IPW2)/(ms) | 0.4, 0.6, 0.8, 1, 1.2, 1.5, 2, 2.5, 3, 3.5, 4 |
| Injection mode | Single-valve (IPW2 = 0), Dual-valve (IPW1 = IPW2) |
To explore the influence of varying IPW2 and Tac on the instantaneous fuel injection characteristics during the formation of a ramp injection mode, the operating conditions detailed in Table 3 were selected for injection rate measurements.
Ramp injection mode test conditions.
| Injection pressure/(MPa) | 80, 100, 120, 140, 160 |
|---|---|
| IPW1/(ms) | 2, 2.5, 3, 3.5, 4 |
| Tac/(ms) | 0.5, 1, 1.5, 2, 2.5 |
| IPW2/(ms) | 1.5, 2, 2.5, 3 |
3.Results and Discussion
In this section, the dynamic behavior of the injection rate, the delay of the valve opening and closing, the variation in injection duration, and the injection rate are comprehensively investigated for a better understanding of the fuel injection rate of the DSVCI injector.
3.1.Definition of Key Moments in the Fuel Injection Process
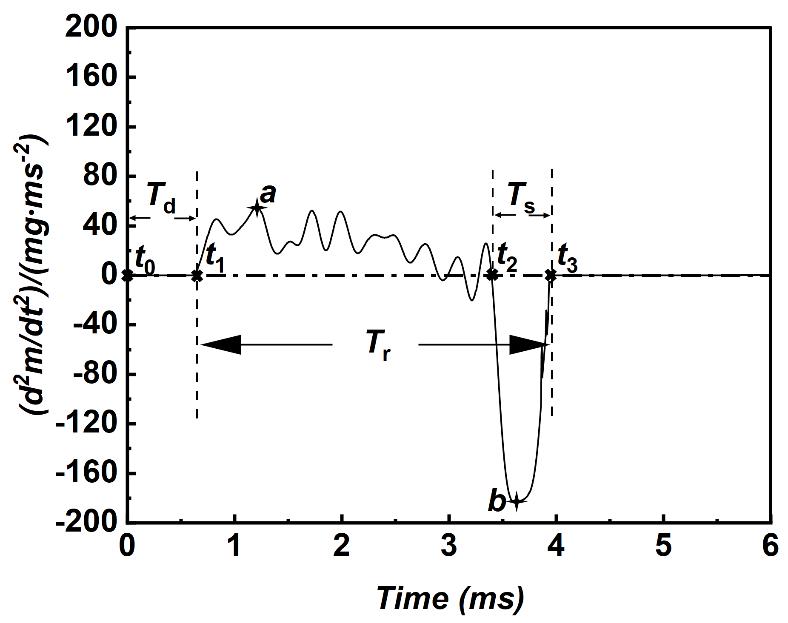
To mitigate the interference introduced by minor fluctuations in the fuel injection rate curve at the onset and termination of injection, this study proposes a feature parameter identification method based on the derivative of the injection rate. Specifically, the point of maximum derivative, denoted as point a, is first identified and used as a reference to perform a forward search for the first zero crossing of the derivative, which is designated as the injection start time t1. Next, the minimum point b of the derivative is located, from which bidirectional searches are conducted: a forward search identifies the inflection point t2 corresponding to the rapid decline in the injection rate, while a backward search determines the first zero crossing t3, marking the end of the injection process.
For convenience, the following relevant parameters are defined in combination with Figure 5. The valve opening delay (Td) is defined as the interval between the onset of the electromagnetic valve actuation (t0) and the injection start point (t1). The injection duration (Tr) is defined as the period from the start of injection (t1) to the complete termination of the injection process (t3). The valve closing delay (Tc) is defined as the interval between the onset of needle valve seating (t2) and the end of injection (t3).
3.2.Injection Rate Profiles under Distinct Injection Modes
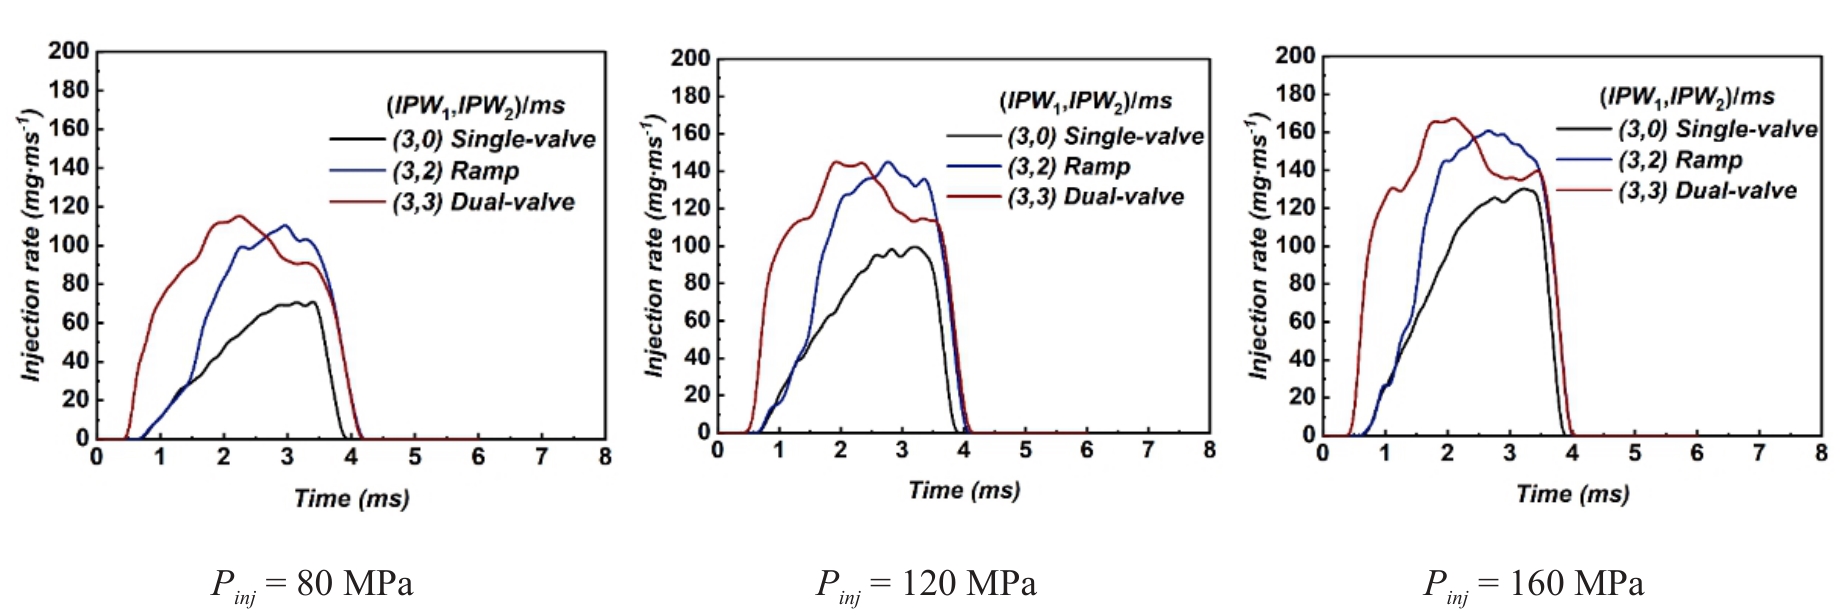
To comprehensively investigate the characteristics of fuel injection rate variation under different injection modes, the distinct drive current waveforms with the NCV-1 drive pulse width of 3 ms are designed to enable three injection modes, including single-valve rectangular, dual-valve rectangular, and ramp. Figure 6 presents a comparison of fuel injection rates for the three injection modes under identical injection pressure (Pinj = 80 MPa, 120 MPa, and 160 MPa) conditions. The injection rates exhibit consistent characteristic differences across injection pressures. Compared to the dual-valve rectangular injection mode, the single-valve rectangular mode displays a slower rise in injection rate but demonstrates reduced fluctuation during the steady-state injection phase. For the ramp injection mode, the initial injection rate closely resembles that of the single-valve rectangular mode. However, beyond a certain point, the rate of increase accelerates abruptly, resulting in a distinct inflection point that imparts a ramp-like profile to the curve. This behavior occurs as NCV-2 is activated, leading to a rapid pressure drop within the injector control chamber, which accelerates the needle valve lift and sharply increases the injection rate. Moreover, the sudden pressure reduction induced by NCV-2 activation amplifies pressure oscillations during the injection process, producing markedly greater fluctuations in injection rate during the steady phase compared to the single-valve rectangular mode. Finally, a comparison of the injection rate curves during the needle valve seating stage reveals that, under identical injection pressure, the curves for all three modes are nearly parallel. The rate of decline in injection rate during this phase is primarily governed by the common rail pressure.
3.3.Effect of Injection Pressure on Injector Opening and Closing Delays
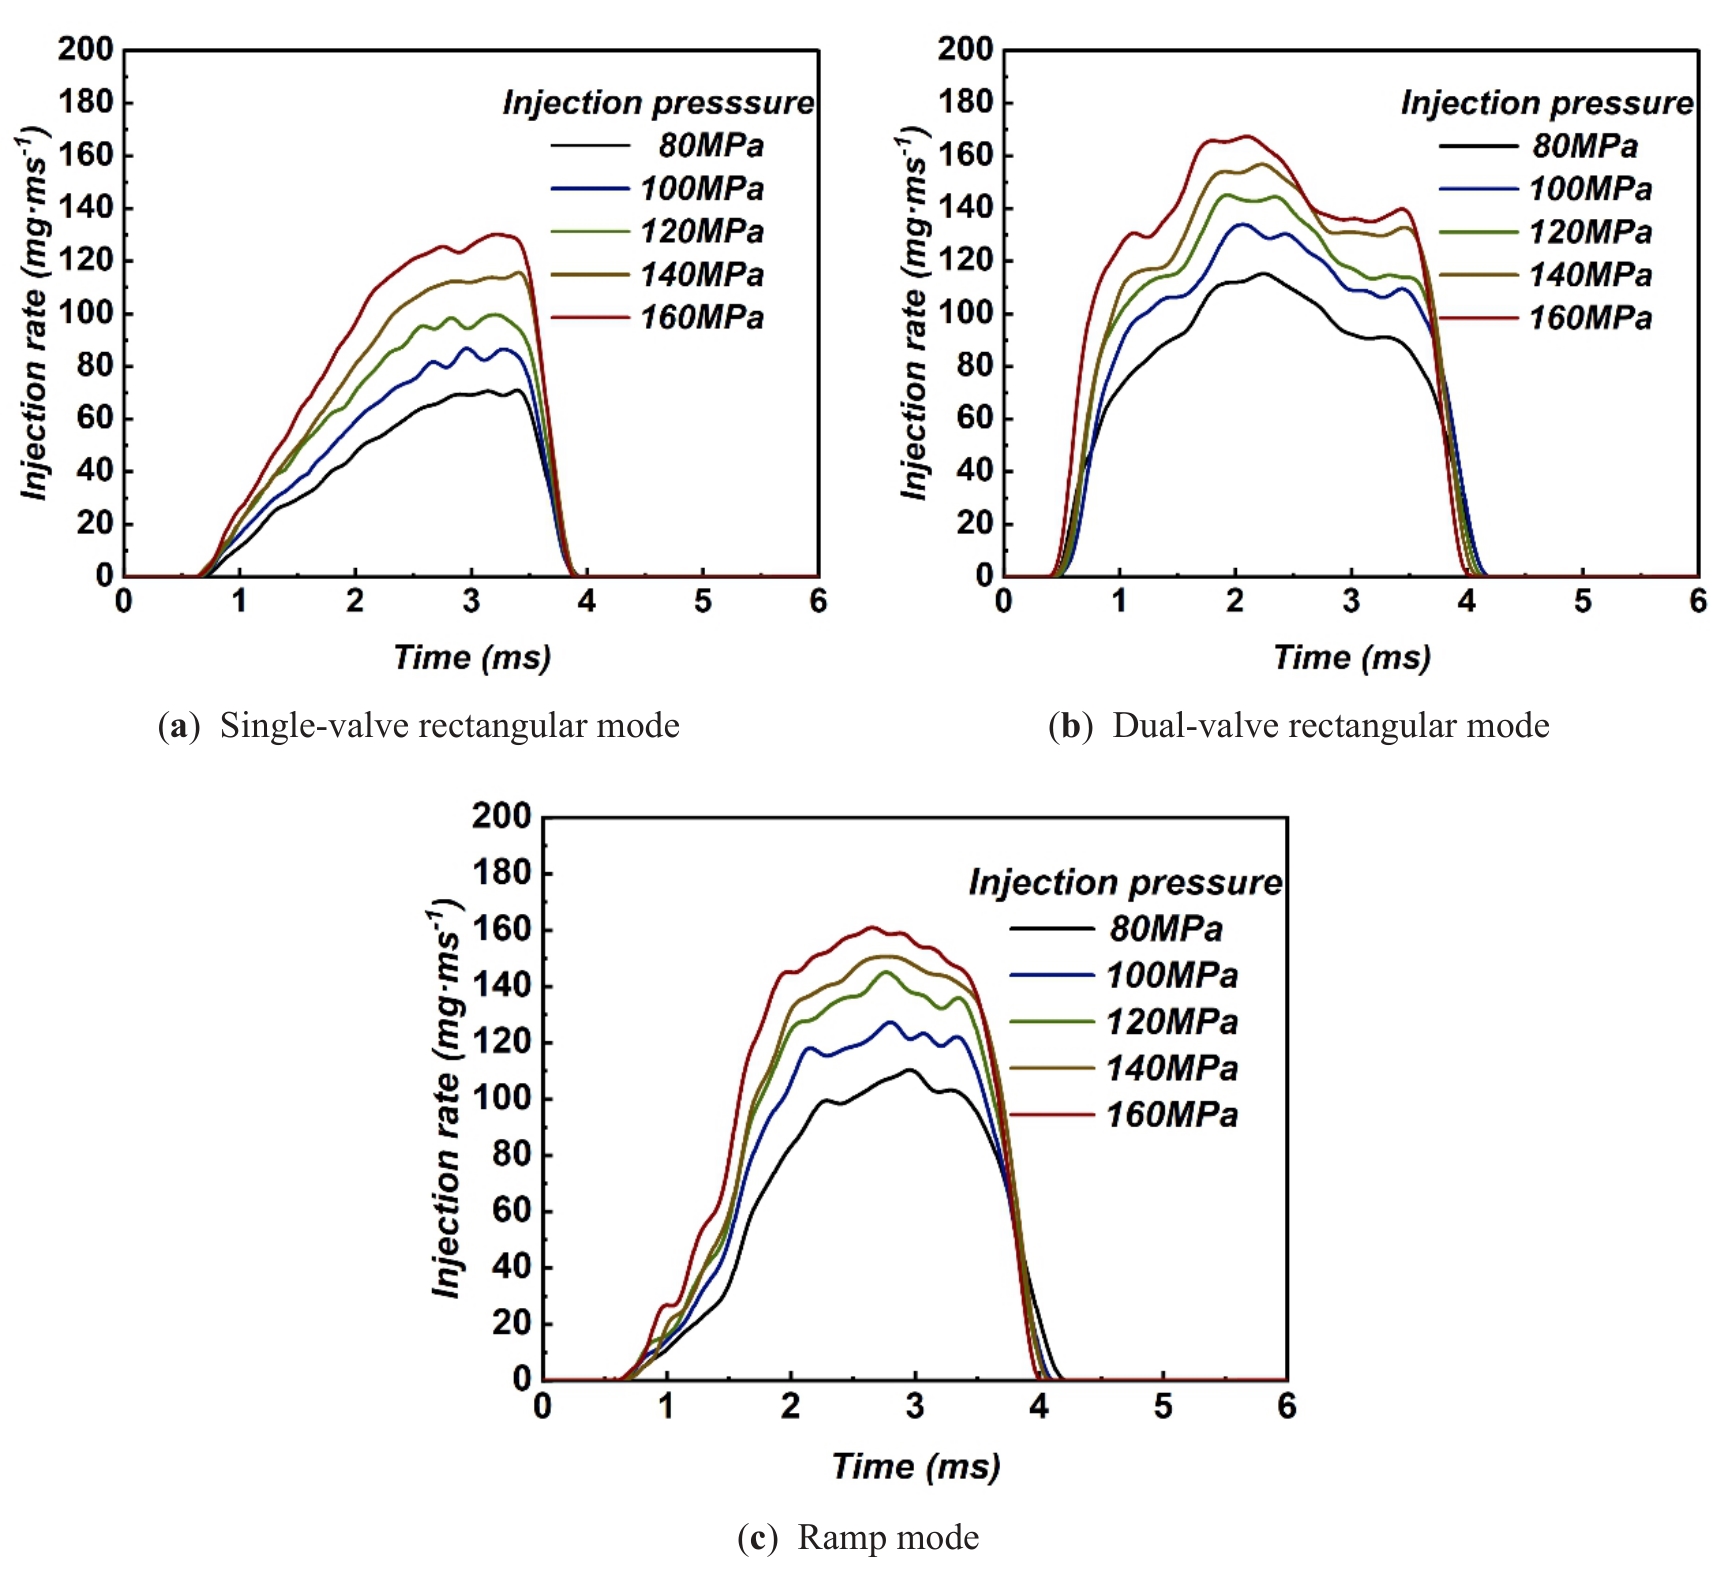
To highlight the effect of injection pressure on the injection characteristics of dual-solenoid-valve injectors and to further evaluate differences across injection modes, injection rate curves were compared under identical IPW1 with varying injection pressures. The results are presented in Figure 7. As injection pressure increases, the injection rate under identical pulse width conditions exhibits a clear upward trend. Furthermore, compared with the dual-valve rectangular injection mode, both the single-valve rectangular and ramp injection modes show a weaker dependence of the initial injection rate on injection pressure, as evidenced by substantially smaller variations in the injection rate curves across different pressure conditions. This behavior arises because, during the initial injection stage, only NCV-1 is activated in these modes, resulting in a slower needle valve lift velocity and rendering the injection rate more strongly governed by the extent of needle valve opening.
Based on the predefined fuel injection characteristics, the injector valve opening delay time (Td) and closing delay time (Ts) were extracted across different injection pressures, as shown in Figure 8. It is evident that with increasing injection pressure, both Td and Ts decrease consistently across all three injection modes. Elevated injection pressure accelerates both the initial lift and reseating of the needle valve, thereby reducing the valve’s opening and closing delays.
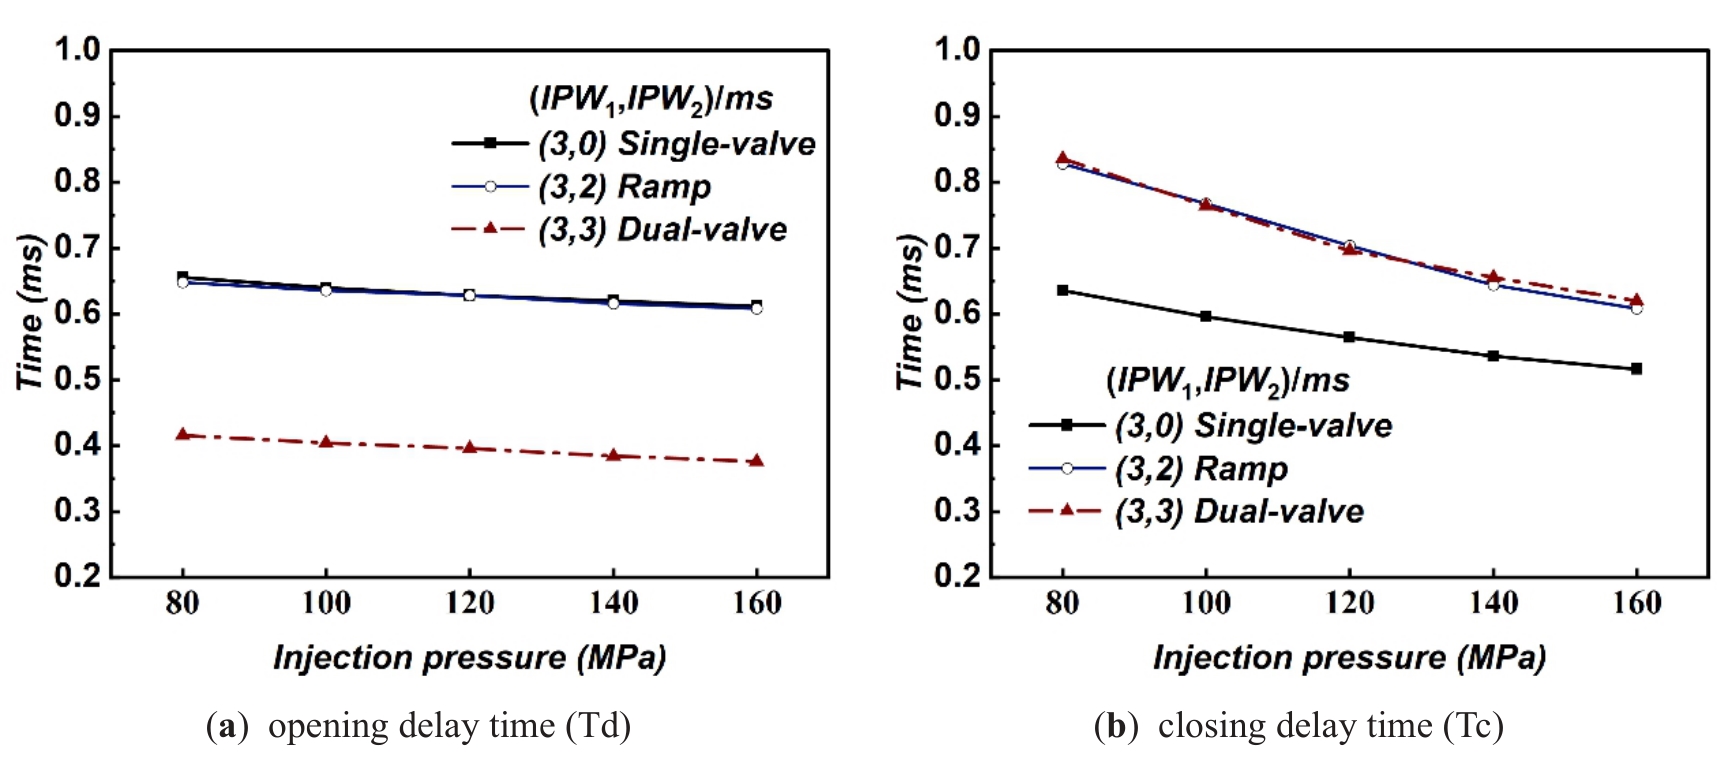
Comparison of the injection delay curves across injection modes shows that the single-valve rectangular mode and ramp mode have similar opening delay, which is approximately 0.23 ms longer than the dual-valve rectangular mode. In contrast, the injector closing delay in the dual-valve rectangular mode is similar to that of the ramp mode, which is significantly longer than in the single-valve rectangular mode. The delay of the needle valve is primarily subjected to three forces: the downward force from the control chamber pressure, the upward thrust from the pressure chamber, and the weight of the needle. As the pressure chamber pressure is equal to the injection pressure, simultaneous activation of NCV-1 and NCV-2 in the dual-valve rectangular mode causes a more rapid pressure drop in the control chamber and an earlier needle lift. Furthermore, because both the dual-valve rectangular and ramp modes engage NCV-1 and NCV-2 in the later stages of injection, the needle valve ultimately lifts higher, extending the seating time during closure.
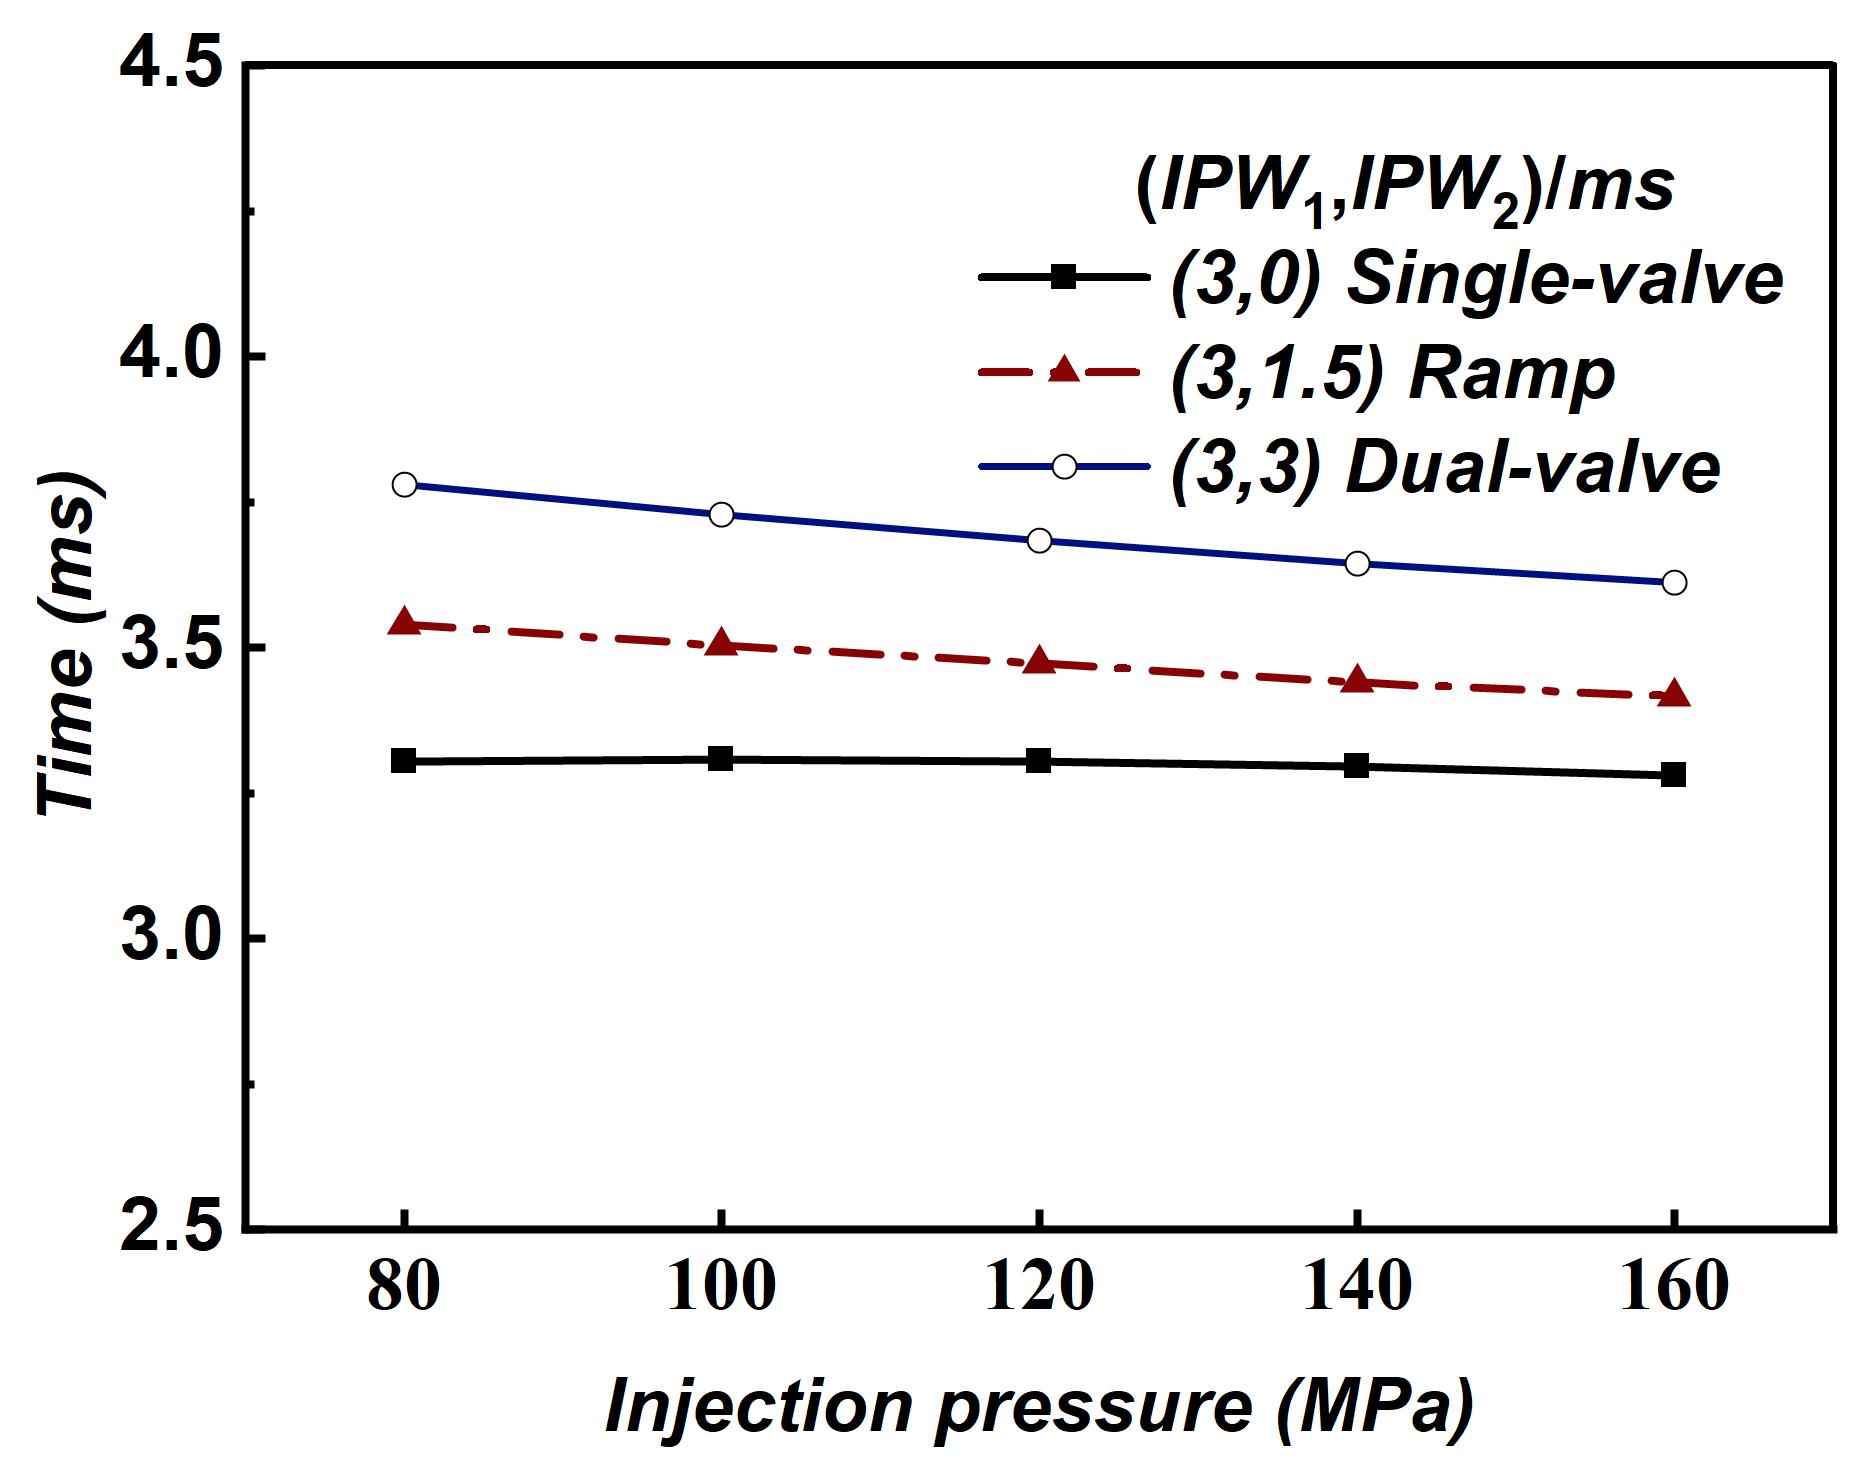
3.4.Effects of the Interval of the Dual-Solenoid Valve on Injection Duration
To investigate the effect of drive durations of NCV-2 on injection timing under identical NCV-1 drive pulse widths, injection durations under different injection modes and injection pressures were compared, as shown in Figure 9. The results demonstrate pronounced differences between injection mode and injection pressure. Both the dual-valve rectangular and ramp injection modes exhibit similar trends, with injection duration decreasing steadily as injection pressure rises. In contrast, the single-valve rectangular mode shows minimal variation at lower injection pressures and only begins to decline once the pressure exceeds a specific threshold. This behavior arises from distinct dynamic characteristics of control chamber pressure under different modes. In the single-valve rectangular mode, which relies solely on one solenoid valve, the decay rate of control chamber pressure is slower, diminishing the sensitivity of needle valve movement to injection pressure. Conversely, in the dual-valve and ramp injection modes, simultaneous actuation of both solenoid valves enables rapid modulation of control chamber pressure, producing a more pronounced response of needle valve dynamics to pressure variations. During the needle valve seating phase, the coordinated action of the dual valves substantially shortens the closing delay time. As a result, the reduction in injection duration attributable to valve closure is considerably longer than that associated with valve opening, manifesting as a continuous decline in injection duration with increasing injection pressure.
3.5.Fuel Injection Mass under Different Injection Modes
Figure 10 illustrates the influence of varying injection pressures and pulse widths on fuel injection volume in the rectangular injection mode. As shown, the injection quantity displays a distinct two-stage behavior with respect to pulse width. Specifically, in the dual-valve rectangular mode, the growth rate of injection volume under short pulse widths is markedly higher than under long pulse widths, whereas in the single-valve rectangular mode, the trend is reversed.
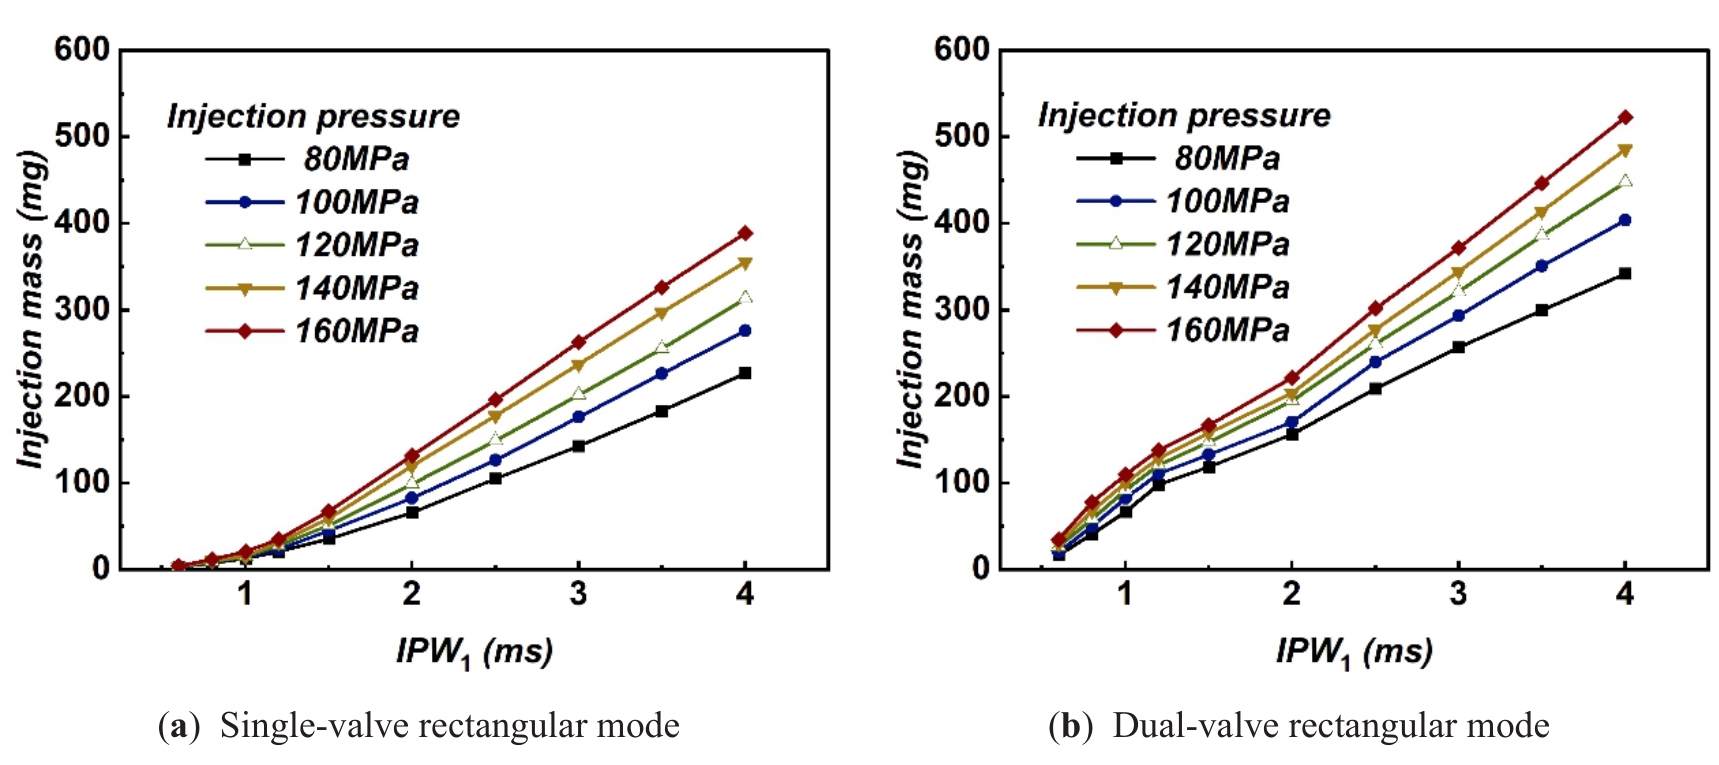
As presented in Figure 10a, under short pulse width conditions in the single-valve rectangular mode, the impact of injection pressure on fuel volume is relatively minor. This is attributed to the slower needle valve lift when only NCV-1 is activated, which dampens the enhancing effect of high injection pressure. Once the needle valve achieves full lift, the fuel injection volume increases more linearly with pulse width. This is primarily because the single-valve configuration produces a lower rate and amplitude of pressure decay, mitigating the influence of pressure fluctuations during the stable injection phase and resulting in an injection volume that closely follows linear growth. At short pulse widths, the smaller needle valve lift height increases sensitivity to pulse width variation, yielding faster growth rates under longer pulse width conditions.
As depicted in Figure 10b, in the dual-valve rectangular mode under short pulse widths, the needle valve does not reach its maximum lift. Here, the injection volume exhibits high sensitivity to pulse width, with a steeper growth rate and relatively limited dependence on injection pressure, resulting in a nonlinear trend. Once the needle valve attains its full lift position, the injector transitions into the stable injection phase, at which point the injection volume increases approximately linearly with pulse width.
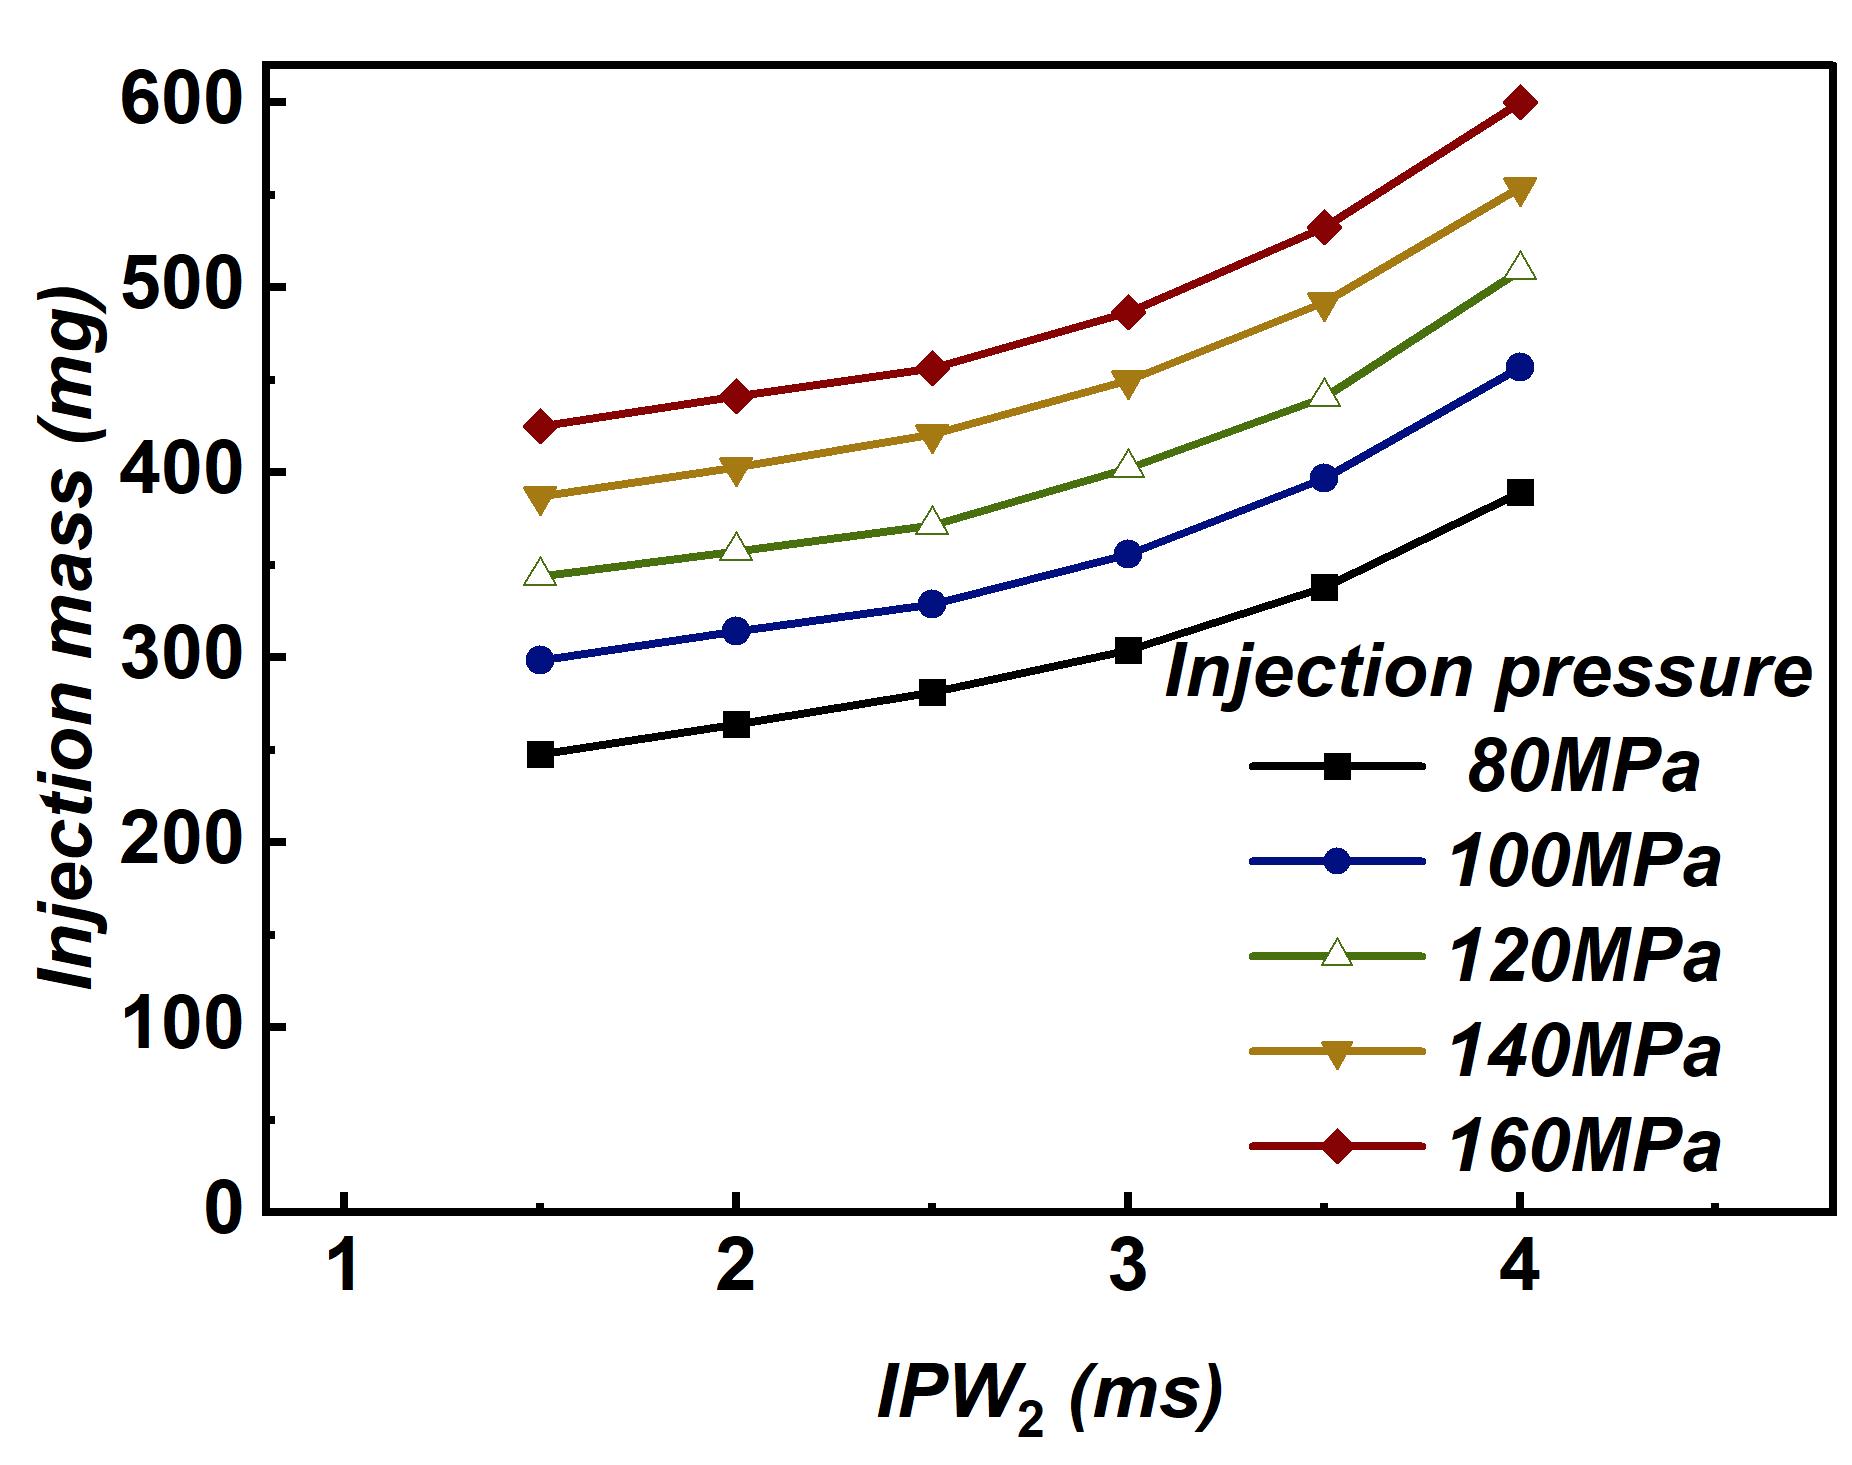
Figure 11 presents the fluctuation characteristics of fuel injection volume in ramp injection mode under varying injection pressures and IPW2 durations, with IPW1 held constant at 4 ms. The analysis indicates that, under a fixed NCV-1 drive time, differences in injection pressure exert relatively minor effects on the overall trend of injection volume, and the patterns remain broadly consistent. Specifically, as Tac decreases, the growth rate of fuel injection volume in response to the same incremental increase in IPW2 progressively rises. This behavior can be attributed to the fact that extending IPW2 activates NCV-2 during the phase when the injector operates at a low injection rate and the needle valve lift is limited, thereby markedly enhancing the injection rate. Consequently, the fuel injection volume increases rapidly with longer drive durations, and the rate of this growth further accelerates as the NCV-2 drive time is prolonged.
4.Conclusions
This study comprehensively investigates the various injection strategies for a dual-solenoid-valve injector (DSVCI) featuring NCV-1 and NCV-2. The injection rate, opening and closing delay of the needle, injection duration, and response to pressure, and fuel quantity trends are extensively studied for flexible control on the injection rate. The main findings are listed below.
(1) The ramp injection mode initially mirrors the single-valve rectangular mode with a gradual rise in injection rate. Once NCV-2 is activated, the rate rapidly increases, forming a distinctive ramp profile. This staged behavior offers enhanced flexibility in shaping the injection process.
(2) The ramp mode’s injector opening delay is comparable to that of the single-valve rectangular mode but occurs later than in the dual-valve mode. The closing delay, on the other hand, resembles that of the dual-valve configuration and is significantly longer than in the single-valve case.
(3) Both ramp and dual-valve rectangular modes exhibit a clear decline in injection duration with increasing injection pressure, driven by faster needle dynamics. In contrast, the single-valve mode shows limited pressure sensitivity, especially at lower pressures, due to slower pressure decay in the control chamber.
(4) Under long injection durations, the fuel quantity in rectangular modes increases linearly with pulse width. In ramp mode, however, the fuel quantity exhibits an accelerating growth trend with increasing NCV-2 activation time, emphasizing its potential for dynamic rate shaping.
Author Contributions: C.Z.: Methodology, investigation, data curation, formal analysis, writing and editing; D.W.: Methodology, investigation, data curation; X.W. and W.D.: data curation, Software; Y.Q. and Q.C.: reviewing and editing. Q.D.: reviewing and editing, supervision, project administration, funding acquisition. All authors have read and agreed to the published version of the manuscript.
Funding: This work was supported by the National Natural Science Foundation of China (grant number: 52371307) and Basic Operating Expenses for Central Universities of China (Grant Numbers: 3072024CFJ0307 and 3072024XX0304).
Institutional Review Board Statement: Not applicable.
Informed Consent Statement: Not applicable.
Data Availability Statement: Not applicable.
Conflicts of Interest: The authors declare no conflict of interest.
References
- 1.
Xiong, B; Yang, K; Zhao, J.H; Influence of saddle-shaped injection coupled fuel injection parameters on diesel engine combustion and emission performance. J. Nav. Univ. Eng. 2022, 34, 48–54.
- 2.
Chen, J; Shi, G; Wu, J; Combustion and Emission Characteristics of a Diesel Engine with a Variable Injection Rate. Appl. Sci. 2024, 14, 4941.
- 3.
LeBlanc, S; Cong, B; Yu, X; Characterization of Rate of Injection for Low Carbon Fuels in the Common-Rail Direct Injection System. Int. J. Automot. Manuf. Mater. 2025, 4, 5.
- 4.
Shuai, S; Abani, N; Yoshikawa, T; Evaluation of the effects of injection timing and rate-shape on diesel low temperature combustion using advanced CFD modeling. Fuel 2009, 88, 1235–1244.
- 5.
Aboujafari, M. Numerical Investigation of the Effects of the Ammonia Injection Rate Shape and Timing on the Performance of an Ammonia-Hydrogen Dual-Fuel Engine. Emiss. Control Sci Technol 2025, 11, 4.
- 6.
Sun, H; Zheng, Z; Li, J; Investigation of the effect of injection rate shaping on combustion and emissions in heavy-duty diesel engine under steady and transient conditions. Int. J. Engine Res. 2024, 25, 1623–1637.
- 7.
Yang, K; Zhou, L; Zhao, J.H; Effect research of fuel injection and pressurization pulse width on injection characteristics of ultra high pressure common rail system. J. Northwestern Polytech. Univ. 2023, 41, 1221–1228.
- 8.
Liu, L; Mei, Q; Jia, W; A flexible diesel spray model for advanced injection strategy. Fuel 2022, 314, 122784.
- 9.
Ferrari, A; Zhang, T; Influence of the injector setup on digital and continuous injection rate-shaping performance in diesel engine passenger cars. Energy Convers. Manag. 2020, 205, 112259.
- 10.
Liu, Q; Ouyang, G.Y; Yang, K; Simulation of combustion and emission characteristics of adjustable boot-shaped fuel injection law. J. Cent. South Univ. 2016, 42, 667–675.
- 11.
Xu, J; Lan, Q; Fan, L; Research on injection performance of the double-lift electronically controlled injector for marine diesel engine. Fuel 2023, 337, 126878.
- 12.
Willems, R; Willems, F; Simpson, T; Ramped Versus Square Injection Rate Experiments in a Heavy-Duty Diesel Engine SAE Int. J. Adv. Curr. Pract. Mobil. 2020, 2, 1322–1336.
- 13.
Yazdani, M.T; Azadani, L.N; Effect of the ramp injection rate shape on the performance and emissions of a natural gas/diesel dual fuel engine Int. J. Engine Res. 2021, 24, 610–621.
- 14.
Cheng, S; Cheng, T.F; Yang, X.Y; Implementation of various injection rate shapes in an ammonia/diesel dual-fuel engine with special emphasis on combustion and emissions characteristics. Energy 2024, 304, 132035.
- 15.
Yousefi, A; Guo, H; Dev, S; A study on split diesel injection on thermal efficiency and emissions of an ammonia/diesel dual-fuel engine. Fuel 2022, 316, 123412.

This work is licensed under a Creative Commons Attribution 4.0 International License.
 Suite 4002 Level 4, 447 Collins Street, Melbourne, Victoria 3000, Australia
 General Inquiries: info@sciltp.com