The marine large-bore low-speed engines face challenges such as complex testing and large computational workload. A feasible solution is to adopt a combined optimization approach using one-dimensional performance simulation and three-dimensional computational fluid dynamics (CFD) simulation. This paper utilizes a one-dimensional full-cycle simulation model of a marine large-bore low-speed engine with a complete scavenging and combustion coupling process. Combined with the Non-dominated Sorting Genetic Algorithm II (NSGA-II), it conducts multi-objective optimization based on the controlled variables such as the closing time of the exhaust valve, the injection timing, and the injection duration. Within a short period of time, it obtains the optimized boundary conditions. In the three-dimensional CFD simulation, the indicated thermal efficiency was increased by 1.139% and 1.264% respectively, and the maximum error compared with the one-dimensional simulation results was 1.33% and in the three-dimensional CFD simulation, the CO2 emissions were reduced by 2.2052% and 2.4886% respectively, with a maximum error of 1.69% compared to the one-dimensional simulation results. Ultimately, the results of the one-dimensional optimization were consistent with those of the three-dimensional CFD simulation. Moreover, the computing time required was significantly less than that of the traditional optimization based on three-dimensional CFD simulation.
- Open Access
- Article
Performance Optimization of Marine Large-Bore Low-Speed Engine Based on One-Dimensional and Three-Dimensional Coupled Simulation
- Dai Liu *,
- Yuexin Cui,
- Long Liu,
- Xiao Han
Author Information
Received: 31 Aug 2025 | Revised: 22 Sep 2025 | Accepted: 15 Oct 2025 | Published: 28 Oct 2025
Abstract
Keywords
marine low-speed engines | 1D-3D coupled simulation | diesel engine performance optimization
1.Introduction
Due to the advantages of marine large-bore low-speed engines such as high power, stable operation and low maintenance costs, they have become the first choice for ocean-going vessels. The stricter emission regulations and evolving market demands pose challenges for marine two-stroke engines [1,2]. From an experimental perspective, the testing of marine large-bore low-speed engines is extremely difficult. Its huge size and complex structure make the construction of the physical experiment platform not only costly but also time-consuming; from a computational perspective, due to the complex multi-physics field coupling phenomena involved in the working process within the cylinders of marine large-bore low-speed engines, the computational workload becomes extremely large. Traditional numerical calculation methods often require a significant amount of computing resources and time when dealing with such complex problems. Therefore, in order to reduce the computational cost of engine prediction and optimization, one-dimensional and three-dimensional (1D-3D) coupled simulation has become an important research direction.
Traditional modeling approaches primarily rely on three categories of methods: (1) 3D simulations for detailed design analysis. For instance, Long Liu et al. [3] utilized 3D simulation to study the mixture characteristics and mechanism of natural gas/air in dual-fuel engines, while Dong Pengbo et al. [4] conducted a 3D simulation study on the diffusion combustion of liquid ammonia in a dual direct-injection ammonia/diesel engine. (2) 1D simulation for system-level performance evaluation and control strategy optimization. Fogla et al. [5] used a 1D model to predict the in-cylinder turbulence level throughout the engine cycle; De Bellis et al. [6] developed a phenomenological model for the RCCI combustion process in dual-fuel marine engines; Karystinos et al. [7] established a phenomenological combustion model for a four-stroke methanol-diesel dual-fuel engine. Zhao, Y. [8] constructed a one-dimensional model of the heat pump air-conditioning system for electric vehicles, which analyzed the impact of compressor speed, EHX opening, and recirculation ratio on energy consumption and heating capacity under WLTC operating conditions at an ambient temperature of -5 °C. Liu, Q et al. [9] built a one-dimensional model to explore the operation law of the power performance demand of the hydrogen fuel cell vehicle. Lu, A et al. [10] used the chemical kinetics model to assess ignition characteristics of coal-based naphtha for use in HCCI engines. (3) Commonly, 1D and 3D models are coupled through the exchange of boundary parameters. Liu Yubin et al. [11] calculated the thermal interaction characteristics between the power system and the air conditioning system based on a 1D-3D coupled model within the engine compartment of an electric vehicle; Lin et al. [12] analyzed combustion characteristics in a diesel engine by coupling a 1D flow model coupled with a 3D combustion model. Fu et al. [13] coupled transient 1D pipeline flow with unsteady 3D turbulence modeling to study pumped-storage power stations. In these studies, 1D-3D co-simulation reduced the computation time while still capturing the details of the most critical processes.
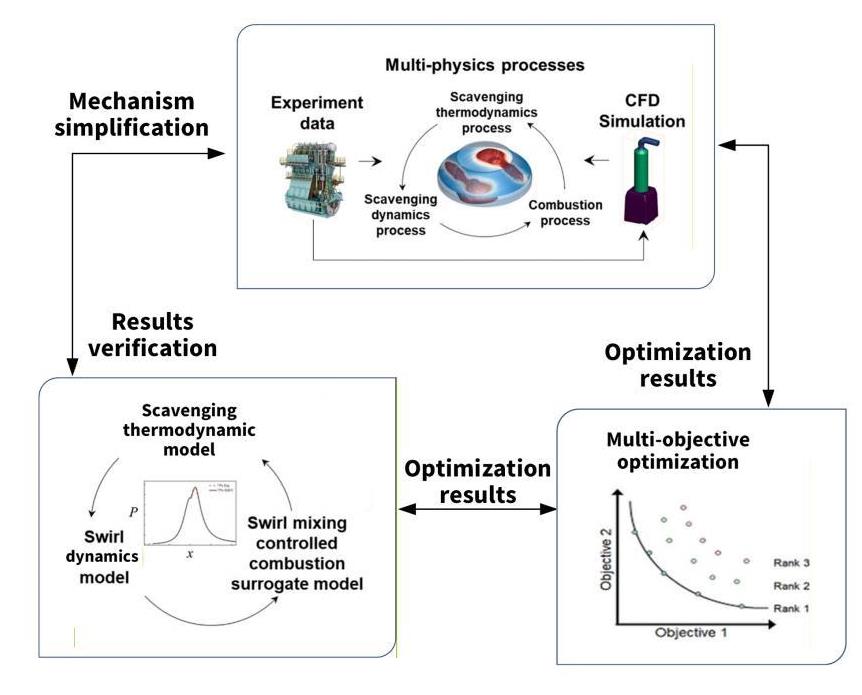
Based on the 1D-3D co-simulation methodology, this paper analyzes the combustion process in a marine large-bore low-speed engine via simulation and optimizes the fuel injection strategy to enhance its power output, fuel economy, and emission performance. First, the 3D simulation model was calibrated against experimental data. Multi-physics simulation was employed to perform detailed modeling of the complex in-cylinder flow field, spray, and combustion processes, thereby providing accurate boundary conditions for the 1D performance simulation model. Second, a 1D performance simulation model was used to quickly compute the engine’s overall performance. The 1D model was then combined with the Non-dominated Sorting Genetic Algorithm II (NSGA-II) to optimize engine parameters—such as exhaust valve timing, injection timing, and injection pressure—under multiple objectives within a relatively short time frame, thus guiding the design of the injection strategy. Furthermore, the optimized parameters from the 1D simulation were validated using the 3D model. Additionally, 3D post-processing techniques were employed to analyze the microscopic fuel-air mixing and combustion processes in detail. Finally, by comparing and verifying the results from the 1D and 3D simulations, this approach achieved two primary goals: (1) it facilitates an in-depth investigation into the mechanism through which the injection strategy influences engine performance, and (2) it provides insights from the detailed 3D results to guide improvements in the 1D model. Thus, the proposed research framework can effectively address the urgent engineering needs for performance enhancement, energy conservation, and emission reduction in marine large-bore low-speed engines, offering a technical approach that is both accurate and efficient for optimization design. The overall research process of this paper is shown in Figure 1.
2.Numerical Simulation Method
2.1.3D CFD Simulation Model
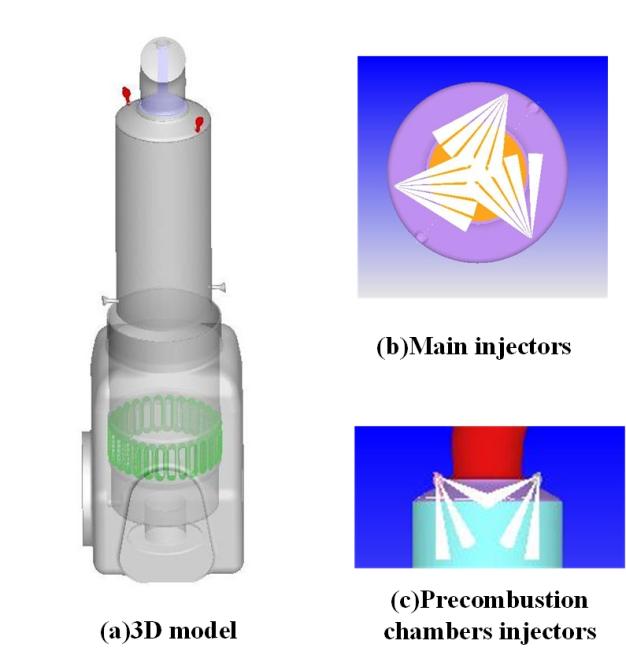
A 3D computational fluid dynamics (CFD) model of the WinGD X92 DF engine was established using the CONVERGE software (CONVERGE 3.0, Convergent Science, Madison, WI, USA). The engine is designed for three operating modes to meet various working conditions and environments, including diesel mode, gas mode, and fuel sharing mode. This study focuses on the diesel mode of operation. The 3D model geometry includes a scavenge port, cylinders, a pre-combustion chamber, and an exhaust port. The basic parameters of the engine are shown in Table 1 and Figure 2.
Win GD X92DF Engine specifications.
| Parameters | Value |
|---|---|
| Number of cylinders | 12 |
| Bore/mm × Stroke/mm | 920 × 3468 |
| Compression ratio | 12.4 |
| Power/kW | 63,840 |
| Number of main fuel injectors | 3 |
| Number of main fuel nozzles | 5 × 3 |
| Number of pre-combustion chamber injectors | 2 |
| Number of pre-combustion chamber nozzles | 3 × 2 |
In this study, the numerical calculation was based on continuity, momentum and energy conservation laws. The 3D CFD model incorporated several sub-models to simulate key physical processes: turbulence, spray, combustion, and emissions. Therefore, RNG k-ε model [14] was selected for calculating turbulence motion in this work. The Kelvin–Helmholtz/Rayleigh–Taylor (KH-RT) model [15] was applied for the spray atomization and breakup simulation, which can accurately describe the breakup phenomenon in the liquid and gas–liquid mixing zone. In the simulation, the simplified mechanism for the oxidation of iso-octane proposed in reference [16] was adopted to simulate the in-cylinder combustion process. The extended Zeldovich model provided by Heywood [17] was applied to simulate the process of NOx formation. The submodels applied in this study are listed in Table 2.
Submodels applied for simulation.
| Parameters | Model |
|---|---|
| Turbulence | RNG k-ε |
| Spray atomization and breakup | KH-RT |
| Combustion | SAGE |
| NOx | Extended Zeldovich Model |
Due to the large volume of the simulation model, this paper adopts a larger size of the basic mesh, as well as adaptive mesh refinement (AMR) and fixed embedding for important areas to meet the simulation accuracy and save calculation time. In the process of simulating calculation, the scavenging port region, the diesel injection region, the combustion region on top of cylinder liner, and the pre-combustion chamber were embedded. To accurately simulate the influence of gas flow in diesel fuel spray, mixing and ignition process, the diesel injection areas in the main and precombustion chambers were further fixed-embedded. The detailed grid strategy of the model is shown in Table 3.
Determination of model grid strategy.
| Grid Strategy | Region | Size/Scale |
|---|---|---|
| Basic grid | Overall model | 50 mm |
| Fixed embedding | Scavenging port | 3 Scale |
| Pre-combustion chamber | 4 Scale | |
| Combustion region | 4 Scale | |
| Diesel injection | 4 Scale | |
| AMR | Overall model | 4 Scale |
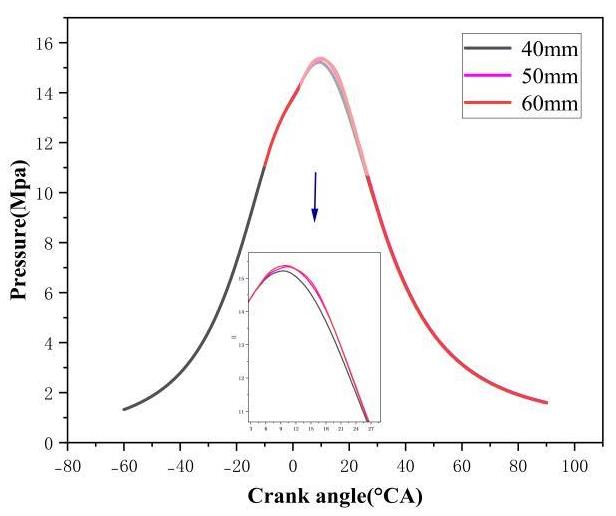
Considering the time and accuracy of calculation, simulated in-cylinder pressures for base grids of 40 mm, 50 mm and 60 mm with grid control strategy were compared. The effect of the base grid size on the pressure is shown in Figure 3. In this study, the crankshaft angle when the piston reaches top dead center is defined as 0°, with negative values indicating angles before top dead center and positive values after top dead center. The results indicate that the base grid size has no discernible influence on the cylinder pressure in scavenging process and the compression process. To balance computational accuracy and efficiency, a base grid size of 50 mm was selected in this study for simulating the flow-field movement and combustion process using adaptive mesh refinement and a fixed-embedding grid control strategy.
According to the test data of WinGD X92 DF engine (Winterthur Gas & Diesel Ltd., Winterthur, Switzerland) at 100% load, three main injectors and two pre-combustion chamber injectors are installed on the cylinder head. Each main injector injects 69.613 g of diesel fuel, and each pre-combustion chamber injector injects 0.387 g. The injection start times for the main diesel fuel and the pilot diesel fuel are set at -8 °CA and -10 °CA, respectively. The initial pressures in the intake and exhaust zones are set to 5.18 bar and 5.03 bar, respectively. The simulation range extends from the opening of the exhaust valve (90 °CA) to the end of the expansion process (450 °CA). Table 4 lists the main boundary conditions used in the 3D CFD simulation.
Boundary conditions.
| Parameters | Value |
|---|---|
| Load (%) | 100 |
| Speed/(r·min-1) | 80 |
| Initial cylinder pressure (bar) | 20 |
| Initial cylinder temperature (K) | 1000 |
| Scavenging port pressure (bar) | 5.18 |
| Scavenging port temperature (K) | 301 |
| Exhaust manifold pressure (bar) | 5.03 |
| Exhaust manifold temperature (K) | 737 |
| Start of main injection | -8 |
| Start of prechamber injection | -10 |
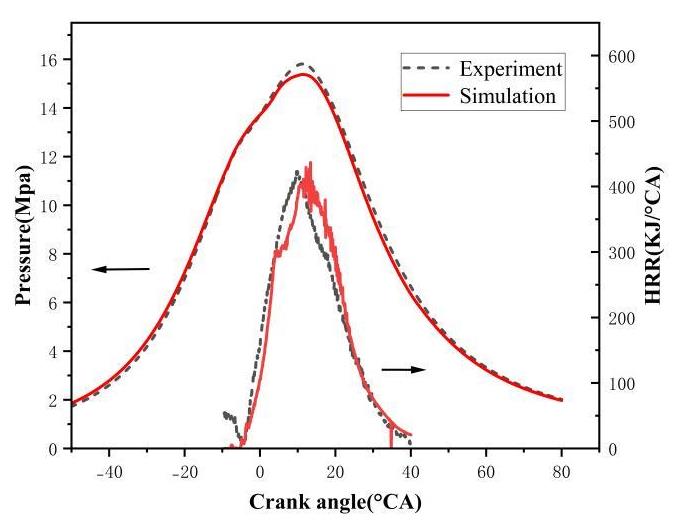
Figure 4 shows a comparison of the in-cylinder pressure and heat release rate (HRR) profiles between experimental and simulation results. The calculated cylinder pressure and heat release rate show good agreement with the experimental data, with a maximum error in peak pressure of 2.73%. These results indicate that the model is capable of accurately simulating the compression and combustion processes within the cylinder.
2.2.Establishment of a 1D Performance Simulation Surrogate Model
2.2.1.A Scavenging Combustion Coupling Model for Marine Large-Bore Low-Speed Engines
Numerical simulations of the marine large-bore low-speed engine were conducted based on experimental data. By analyzing the thermal flow characteristics of the scavenging and combustion processes from a multi-physics perspective, then, the full-cycle simulation of the scavenging combustion coupling model was utilized in conjunction with the Non-dominated Sorting Genetic Algorithm II for multi-objective optimization. The full-cycle simulation of scavenging combustion coupling model includes scavenging thermodynamic model, swirl dynamics model and swirl mixing control combustion model. Here is the detailed introduction.
Scavenging Thermodynamic Model
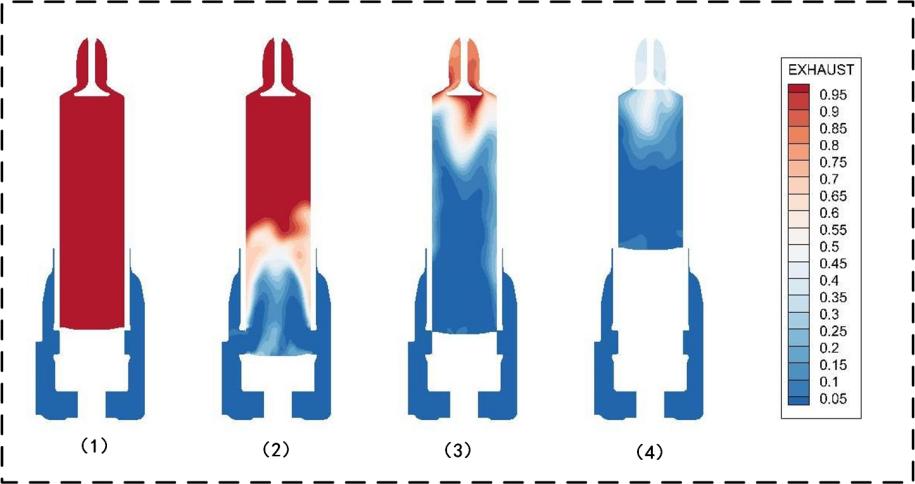
The scavenging process in marine large-bore low-speed engines typically involves prolonged scavenging time and significant gas mixing, which affects combustion quality. Based on the opening and closing times of the scavenging port and exhaust valve and the results of scavenging characteristics, the entire scavenging process is divided into four stages according to the mixing between gases: blowdown, perfect displacement, displacement-mixing, and perfect mixing. As shown in Figure 5, four scavenging stages are presented. (1) blowdown: with the exhaust valve open and the scavenging port closed, the cylinder contains mostly residual gases. (2) perfect displacement: As the scavenging port opens, fresh air enters and some residual exhaust gases exit with the exhaust valve still open. (3) displacement-mixing: During scavenging, some of the air and exhaust gases mix, forming a mixture that is expelled from the cylinder. (4) perfect mixing: After the scavenging port closes, fresh air and a small amount of exhaust gas continue to exit until the exhaust valve closes.
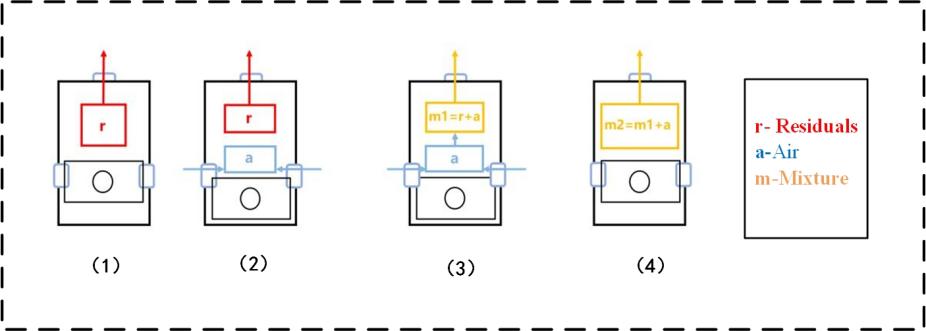
Based on the four stages of the air scavenging process described above, Figure 6 shows a simplified model diagram, (1) blowdown (2) perfect displacement (3) displacement-mixing (4) perfect mixing, where red r, blue a, and orange m represent residual exhaust gas (residuals), fresh air, and the mixture, respectively. Each situation reflects different interactions between air and exhaust gases.
Swirl Dynamics Model
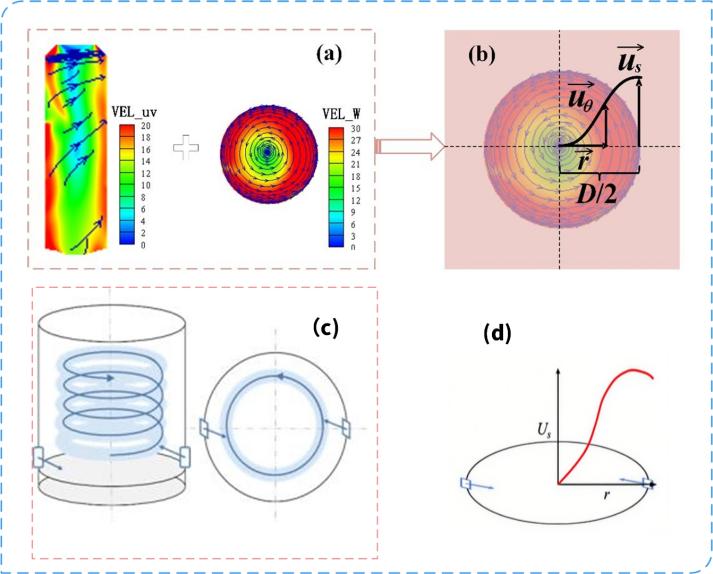
The strong swirl formed during the uniflow scavenging process in marine large-bore low-speed engines plays a crucial role in fuel distribution and air–fuel mixing, thereby impacting combustion. Figure 7a illustrates the flow patterns within the cylinder. Fresh air enters through the scavenging port and, guided by the swirl orientation angle (SOA), forms a swirl rotating around the cylinder’s centerline. As the scavenging process progresses, the swirl strengthens, stabilizes, and moves upward along the cylinder axis with the piston. After the scavenging port closes, the swirl becomes homogeneous and isotropic, resembling a rigid body (except near the cylinder walls), until the exhaust valve closes and the scavenging process ends. Figure 7b shows the circumferential velocity distribution of the airflow, which increases radially from the centerline, peaks near the cylinder wall, and then decreases. Figure 7c presents the swirl dynamics model. It assumes a stable, uniform swirl rotating along the cylinder’s central axis, with a size comparable to the cylinder dimensions. Figure 7d shows that an improved Sigmoid [18] function is used to model the ideal swirl velocity distribution. As shown in Equation (1). Where the uθ is swirl circumferential velocity, uS is the maximum circumferential velocity, a0 and b0 are constants (a0 = 58.8235, b0 = 4.2), represents swirl radius.
Swirl Mixing Controlled Combustion Model
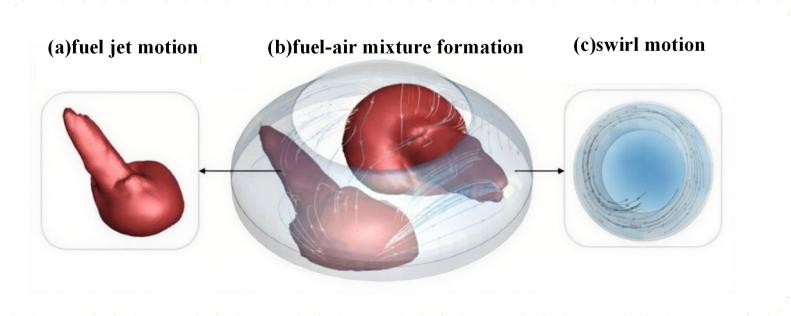
The strong swirl generated during the uniflow scavenging process in marine large-bore low-speed engines persists from the scavenging port opening to the top dead center (TDC). The swirl reaches a highly turbulent state, providing favorable conditions for fuel injection, diffusion, and air-fuel mixing. Fuel is injected at high velocity, atomized, broken up, and evaporated in this high-temperature, high-pressure, and turbulent environment. The kinetic energy of the injected fuel initiates its diffusion, while the strong swirl facilitates rapid mixing with air. The swirl, along with turbulent diffusion and air entrainment, ensures uniform air–fuel mixing and distribution. This process is illustrated in Figure 8.
For marine large-bore low-speed engines, under typical in-cylinder conditions, the chemical reaction rate far exceeds the mixing rate of fuel and air. This implies that turbulent kinetic energy significantly influences the gas state, flow dynamics, fuel–air mixing, combustion efficiency, and emissions.
This model comprehensively considers the effects of fuel injection and turbulent kinetic energy density on the heat release rate. The final expression for the heat release rate is given by Equation (2).
as shown in Equation (2), where Cmod is the calibration coefficient.
The heat release rate is directly proportional to the remaining fuel mass in the cylinder, mf, which is the difference between the injected fuel mass, mfinj, and the burnt fuel mass. This is expressed as a function f1(mf). The amount of injected fuel is iteratively determined by the injection law, while the burnt fuel mass is related to the cumulative heat release, Qtot, and Hu, the fuel’s lower heating value, as indicated in Equation (3).
The heat release rate is also related to turbulent kinetic energy density, which represents the fuel–air mixing speed, as shown in Equation (3). This relationship is expressed by the function f2(k), where Crate is the mixing rate coefficient, and V represents cylinder volume.
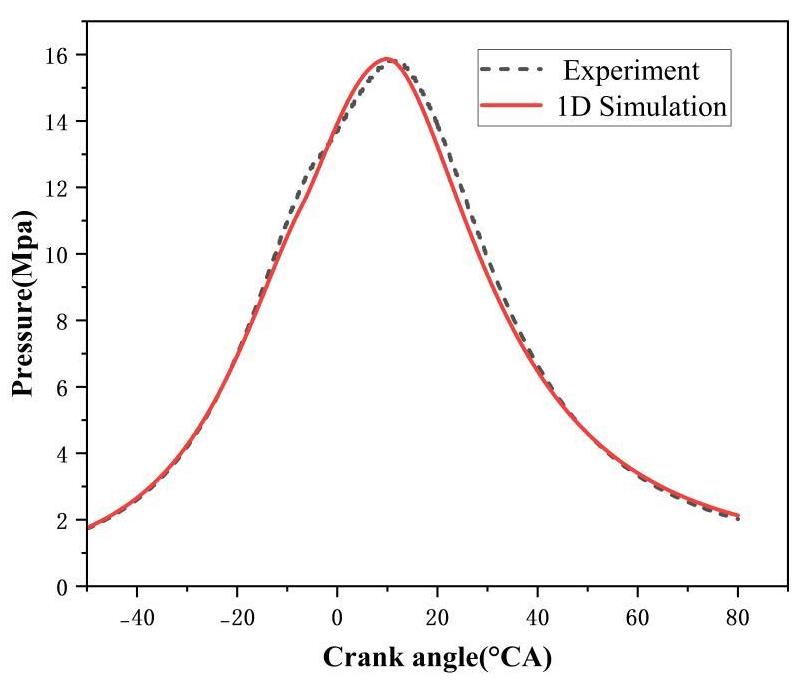
Figure 9 shows the comparison chart of cylinder pressure changes with crank angle obtained from the experiments and 1D simulation calculations. From Figure 9, it can be seen that the average pressure inside the cylinder obtained from the simulation calculation is in good agreement with the experimental results, and the maximum pressure error is 0.39%. This indicates that this model can accurately simulate the compression and combustion processes inside the cylinder.
3.Results and Discussion
Comprehensive modeling of marine large-bore low-speed two-stroke engines reveals that numerous factors influence engine combustion, with air and fuel being the most crucial. The same fuel–air matching parameters can have different effects on various engine performance indicators, and these indicators often exhibit mutual constraints. Traditional optimization algorithms struggle to find optimal solutions in such cases. Therefore, this study uses the NSGA-II algorithm for multi-objective optimization of fuel–air matching strategies, followed by a comparative analysis of the parameters before and after optimization.
Efficient combustion is a key objective for engines. While maximum cylinder pressure (Pmax) is strongly correlated with Indicated Thermal Efficiency (ITE), excessively high Pmax necessitates structurally reinforced components (e.g., cylinder heads, liners), increasing overall mass, fuel consumption, and operational costs; accelerating component wear, reducing durability, raising maintenance costs, and exacerbating noise levels, which may endanger marine engineers’ health. These factors collectively impact engine reliability and maintenance. Therefore, engine design and optimization must balance maximizing ITE with minimizing Pmax to ensure reliability, efficient combustion, and stable power output.
In this study, the exhaust valve closing timing, injection timing and injection duration were regarded as design variables. The objective function was set to maximize the indicated thermal efficiency (ITE) while minimizing the maximum pressure in the cylinder. An iterative optimization process was carried out to improve the ITE according to the objective function, ultimately leading to a set of boundary conditions that satisfy the requirements of multi-objective collaborative optimization. The final configuration of the 3D CFD simulation boundary conditions, as determined through this process, is presented in Figure 10.
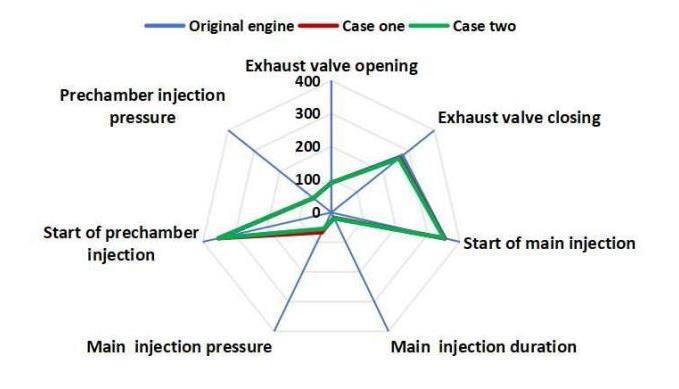
In Figure 10, the exhaust valve opening timing, exhaust valve closing timing, main/pre-injection fuel pressure, injection timing, and injection duration are treated as variables. The blue line represents the original engine boundary conditions, while the green and red lines represent the key parameters—namely exhaust valve closing timing, injection timing, and injection duration—for Optimized Case 1 and Case 2, respectively.
Verification Based on 3D CFD Simulation Results
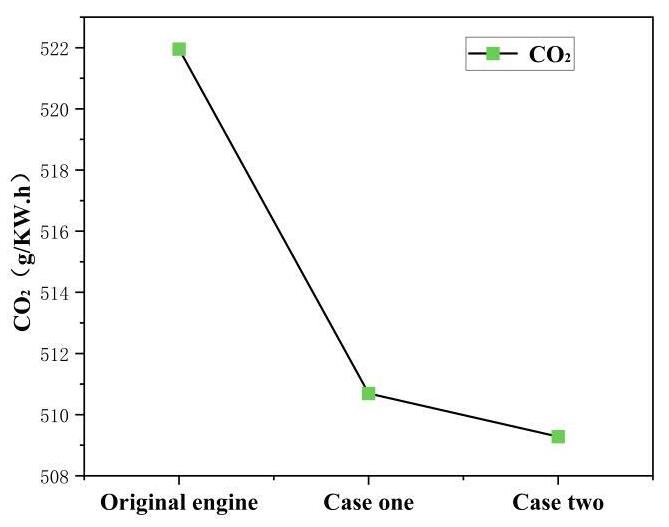
The calculation results of 1D optimization results and 1D optimization boundary conditions in the 3D CFD simulation are shown in Table 5. Compared with the original engine, the indicated thermal efficiency (ITE) increased by 1.139% and 1.264% respectively, while the CO2 emissions decreased by 2.2052% and 2.4886% respectively. At the same time, the maximum error in indicated thermal efficiency (ITE) is 1.33%, and the maximum error in CO2 emissions is 1.69% between the 1D and 3D CFD simulation results. These results indicate that the indicated thermal efficiency and CO2 emissions show good consistency between 1D simulation and 3D CFD simulation. There is a certain degree of error in the Pmax. The possible reason for this is that although the 1D simulation model has incorporated the effects of scavenging and swirl on combustion, it still cannot take into account the local flow inhomogeneity and the asymmetry of combustion as the 3D simulation model does. Therefore, the obtained Pmax has a certain degree of error.
Comparison of 1D Simulation Results with 3D CFD Simulation Results.
| Parameters | Case | 1D Simulation | 3D Simulation |
|---|---|---|---|
| ITE | Case one | 49.988% | 50.66% |
| Case two | 50.465% | 50.78% | |
| Pmax (MPa) | Case one | 18.855 | 16.6946 |
| Case two | 19.969 | 16.8728 | |
| CO2 (g/kWh) | Case one | 519.469 | 510.6945 |
| Case two | 514.559 | 509.2826 |
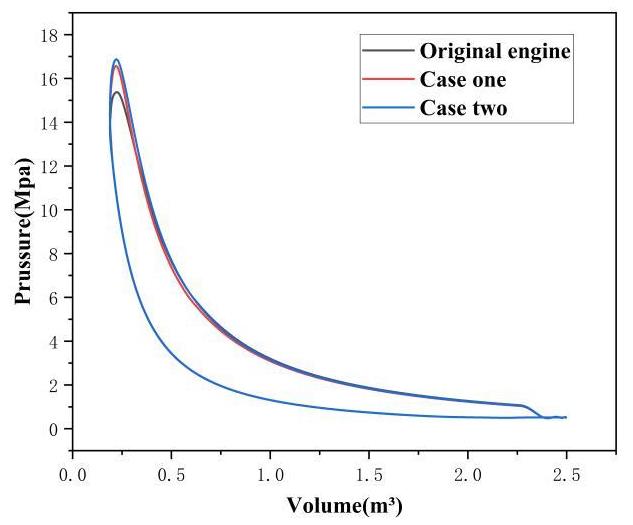
Figures 11–13 compare the cylinder pressure, heat release rate, indicated power and CO2 emissions before and after the optimization of the 3D CFD simulation.
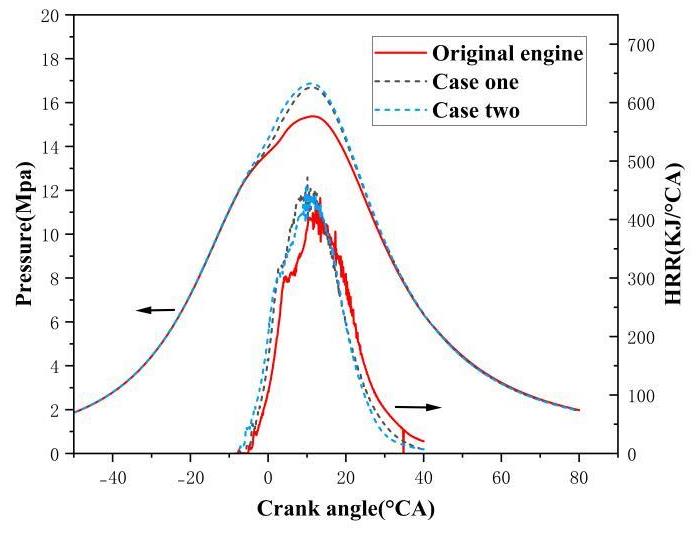
As shown in Figure 11, under the optimized conditions, the early closure of the exhaust valves in Case one and Case two increased the cylinder pressure at the end of compression; the advancement of the injection timing in Case one and Case two enhanced the mixture of diesel and air, resulting in earlier combustion and heat release stages. Although Case two shortened the duration of fuel injection and increased the fuel injection pressure, compared with Case one, the delayed closing of the exhaust valve and the delayed fuel injection timing would reduce the average pressure in the cylinder to a certain extent, resulting in the overall average pressure in the cylinder remaining relatively low. In addition, as shown in Figure 12, under constant diesel injection conditions, the optimized condition achieves a higher indicated power output, thereby improving the indicated thermal efficiency. This also leads to a reduction in CO2 emissions.
To further analyze combustion characteristics before and after optimization, this study examines the fuel–air distribution. Figure 14 shows the equivalence ratio distribution near the TDC, revealing a more uniform distribution in the optimized configuration compared to the original engine. At 10 ATDC, the high equivalence ratio region in case one decreases relative to original engine. Similarly, at 14 ATDC and 18 ATDC, equivalence ratios in case two are lower than in case one, approaching the stoichiometric equivalence ratio. This indicates more complete combustion, improving combustion efficiency and reducing the formation of incomplete combustion products, which is closely linked to the advance in fuel injection timing and the increase of pressure after optimization.
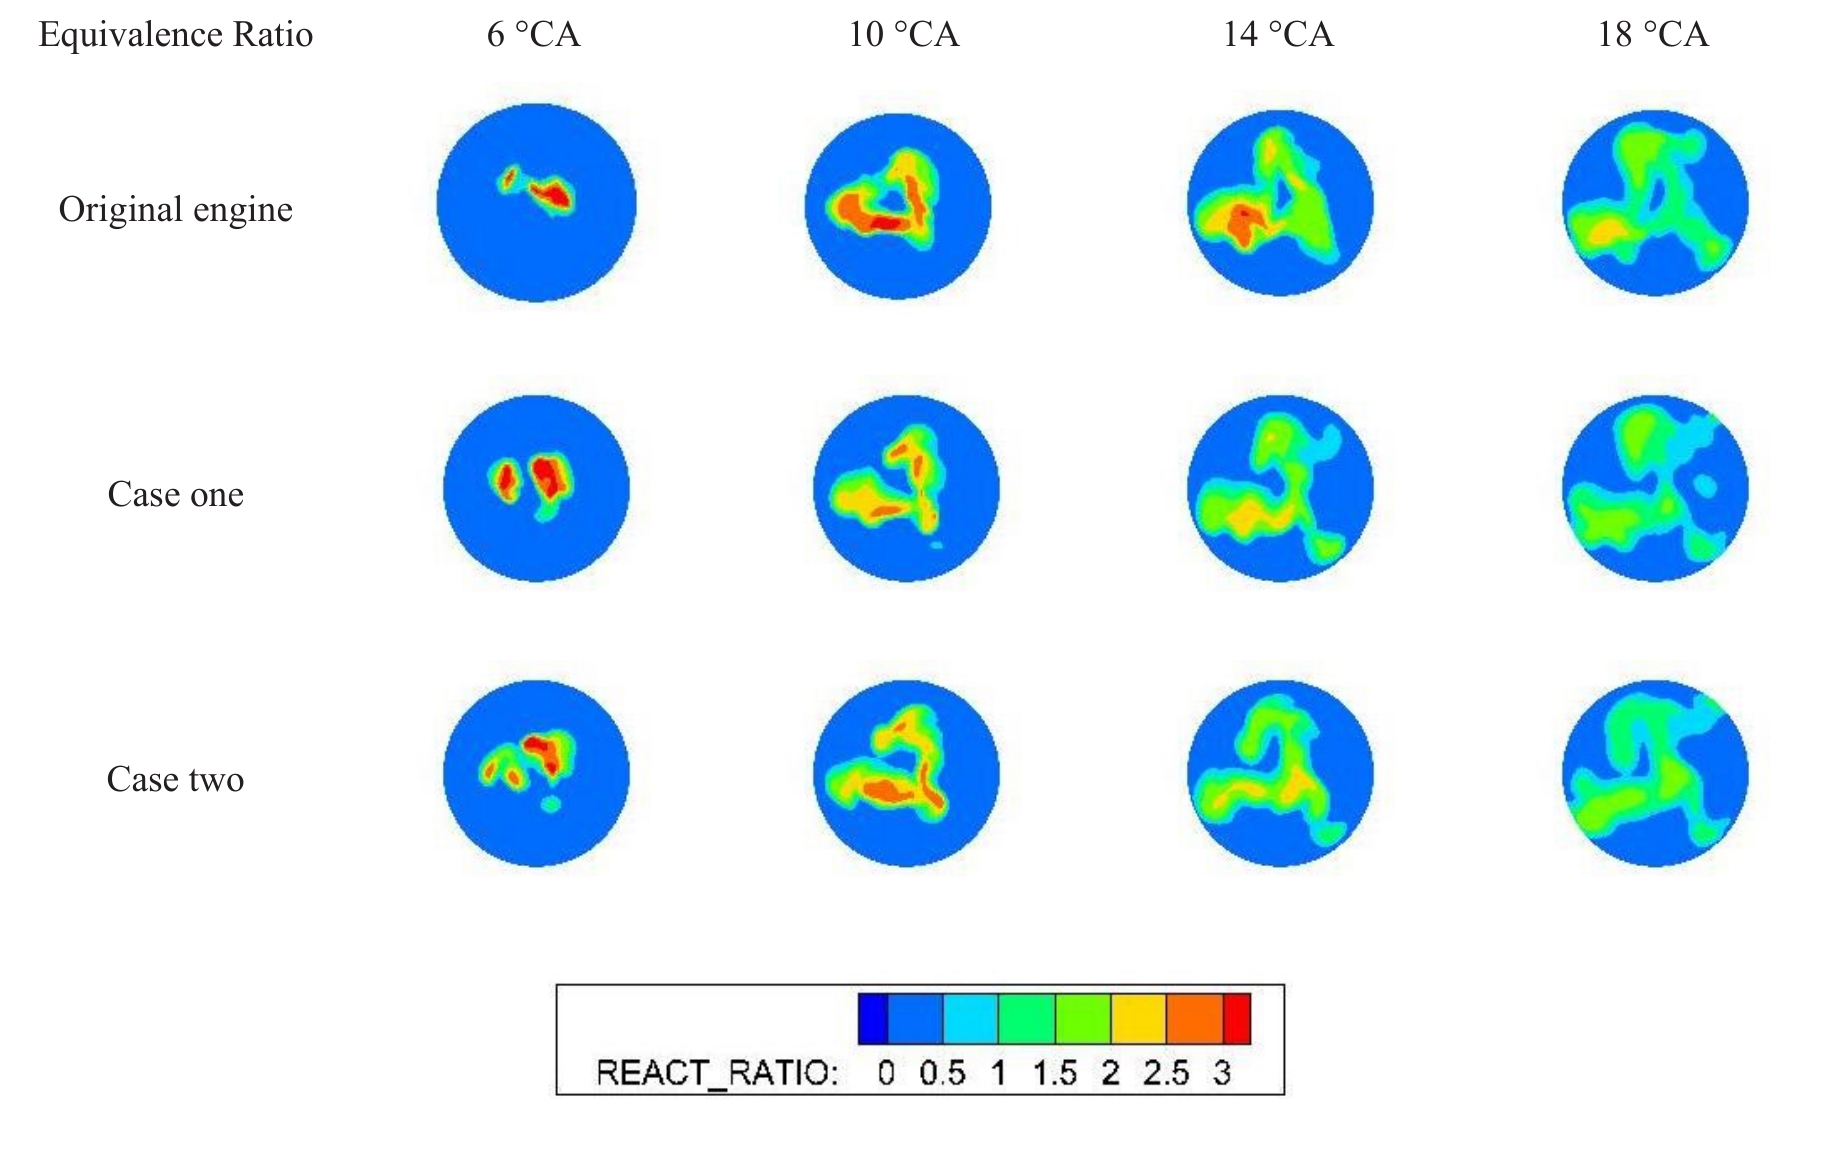
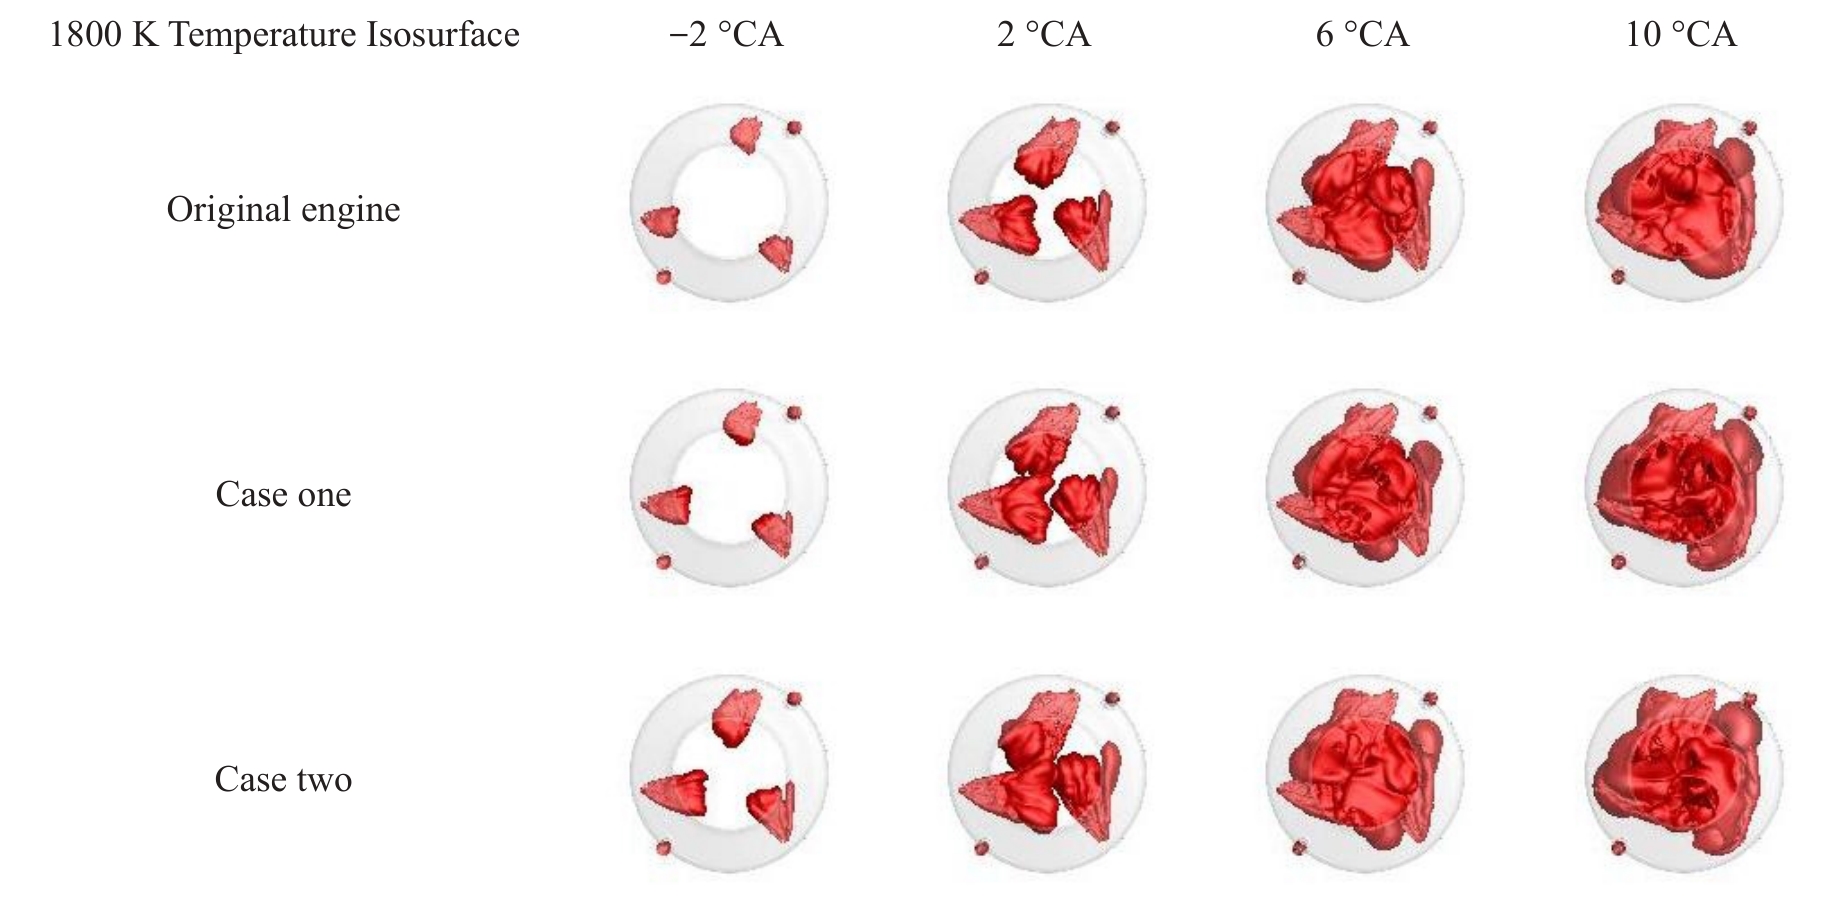
Figure 15 shows the distribution of the 1800 K temperature isosurface before and after the 3D CFD simulation optimization, representing the propagation process of the flame surface. From the figure, at the crank angle of -2 °CA, the isothermal surface distribution at 1800 K for case two is significantly greater than that of case one and the original engine. This indicates that the exhaust valve was closed earlier, which increased the temperature in the cylinder at the beginning of the combustion and promoted the propagation of the flame surface. From the distribution of the 1800 K temperature isosurface at the crank angle of 10 °CA, it can be seen that the flame area in the cylinder of case two is significantly larger than that of the other cases. This indicates that the flame surface of case two has spread throughout the entire cylinder, and the combustion is more complete compared to the other two cases.
4.Conclusions
(1) By combining the 1D simulation surrogate model with the NSGA-II, the boundary conditions for 3D CFD simulation were optimized, including exhaust valve closing timing, injection timing, and injection duration. This achieved multi-objective optimization for improving the performance of large-bore low-speed marine engines.
(2) The optimization results from the 1D simulation were validated using a 3D CFD simulation model. By closing the exhaust valve earlier, adjusting the fuel injection timing earlier, and shortening the fuel injection duration, the average pressure in the cylinder at the end of compression was increased, the combustion duration was shortened, and the indicated thermal efficiency was improved. Compared with the original engine, the indicated thermal efficiency increased by 1.139% and 1.264% respectively, while the CO2 emissions decreased by 2.2052% and 2.4886% respectively.
(3) The optimized 1D simulation results show strong agreement with the 3D CFD simulation results. Comparative analysis indicates a maximum error of 1.33% in indicated thermal efficiency (ITE) and 1.69% in CO₂ emissions between the two simulation approaches. Furthermore, the proposed method significantly reduces computational time compared to traditional optimization processes relying solely on 3D CFD simulations.
In summary, this study presents an effective approach for full-cycle performance simulation and multi-objective optimization of marine large-bore low-speed engines. These findings offer a comprehensive perspective for engine performance optimization.
Author Contributions: D.L. and L.L.: methodology, review; Y.C.: 3D modeling and validation, editing; X.H.:1D modeling and validation. All authors have read and agreed to the published version of the manuscript.
Funding: This work was supported by the National Natural Science Foundation of China (Grant No. 52301367).
Institutional Review Board Statement: Not applicable.
Informed Consent Statement: Not applicable.
Data Availability Statement: Data will be made available on request.
Conflicts of Interest: The authors declare that they have no known competing financial interests or personal relationships that could have appeared to influence the work reported in this paper.
Use of AI and AI-Assisted Technologies: No AI tools were utilized for this paper.
References
- 1.
Wang, J; Dong, J; Liu, H; Research progress analysis of natural gas dual-fuel technology in marine engines. Small Intern. Combust. Engine Veh. Tech. 2017, 46, 73–81.
- 2.
Qian, Y; Liu, B; Wu, C; Review of marine low speed engine technology development. J. Propuls. Technol. 2020, 41, 2418–2426.
- 3.
Liu, L; Liu, S; Xia, Q; Liu, B; Ma, X; Numerical investigation on mixing characteristics and mechanism of natural gas/air in a super-large-bore dual-fuel marine engine. Atmos 2022, 13, 1528.
- 4.
Zarrinkolah, M.T; Hosseini, V; Methane slip reduction of conventional dual-fuel natural gas diesel engine using direct fuel injection management and alternative combustion modes. Fuel 2023, 331, 125775.
- 5.
Fogla, N; Bybee, M; Mirzaeian, M; Millo, F; Wahiduzzaman, S; Development of a Kk-∊ phenomenological model to predict in-cylinder turbulence. SAE Int. J. Engines 2017, 10, 562–575.
- 6.
De Bellis, V; Malfi, E; Lanotte, A; Fasulo, G; Bozza, F; Cafari, A; Caputo, G; Hyvonen, J; Development of a phenomenological model for the description of RCCI combustion in a dual-fuel marine internal combustion engine. Appl. Energy 2022, 325, 119919.
- 7.
Karystinos, V; Papalambrou, G; A phenomenological combustion model for dieselmethanol dual-fuel engines. ASME J. Energy Resour. Technol. 2023, 145, 062303.
- 8.
Zhao, Y. Simulation Study on Heating Performance of Thermal Management in Heat Pump Air Conditioning Systems for Electric Vehicles. Int. J. Automot. Manuf. Mater. 2024, 3, 7. https://doi.org/10.53941/ijamm.2024.100025.
- 9.
Liu, Q; Xiong, B; Liu, Y; Zhang, C; Yuan, S; Ma, W; Study on Performance Simulation Matching of One-Dimensional Hydrogen Storage and Supply System for Hydrogen Fuel Cell Vehicles. Int. J. Automot. Manuf. Mater. 2024, 3, 6. https://doi.org/10.53941/ijamm.2024.100018.
- 10.
Lu, A; Achumu, J.J; Yang, J; Study on Naphtha Combustion in HCCI Engines. Int. J. Automot. Manuf. Mater. 2024, 3, 3. https://doi.org/10.53941/ijamm.2024.100021.
- 11.
Liu, Y; Gao, Q; Zhang, T; Cui, C; Jin, S; Exploration of interactive thermal influence characteristics of power and air conditioning system based on 1D/3D coupling calculation in electric vehicle underhood. Appl. Therm. Eng. 2020, 167, 114717.
- 12.
Lin, X; Deng, X; Jia, D; Xin, Q; Lei, J; . Characteristics of SACI combustion in a diesel rotary engine based on combined 1D and 3D comprehensive transient simulations. Fuel 2022, 313, 122647.
- 13.
Fu, X; Li, D; Wang, H; Li, Z; Zhao, Q; Wei, X; One-and three-dimensional coupling flow simulations of pumped-storage power stations with complex long-distance water conveyance pipeline system. J. Clean. Prod. 2021, 315, 128228.
- 14.
Guo, H. Research on the Fuel-Rich Combustion Reaction Mechanismin Pre-Chamber and Performance Optimization Strategy for a Marine LP-DF Engine; Harbin Engineering University: Harbin, China, 2021.
- 15.
Patterson, M.A; Reitz, R.D; Modeling the effects of fuel spray characteristics on diesel engine combustion and emission. SAE Tech. Paper 1998, 107, 27–43. https://doi.org/10.4271/980131.
- 16.
Curran, H.J; Gaffuri, P; Pitz, W.J; Westbrook, C.K; A comprehensive modeling study of iso-octane oxidation. Combust. Flame 2002, 129, 253–280. https://doi.org/10.1016/S0010-2180(01)00373-X.
- 17.
Özgül, E; Şimşek, M; Bedir, H; Use of thermodynamical models with predictive combustion and emission capability in virtual calibration of heavy duty engines. Fuel 2020, 264, 116744. https://doi.org/10.1016/j.fuel.2019.116744.
- 18.
Han, X; Liu, L; Physical-based surrogate model and its application in 3D-1D fusion optimization of a marine two-stroke engine. J. Mar. Eng. 2023, 45, 123–135.


This work is licensed under a Creative Commons Attribution 4.0 International License.
 Suite 4002 Level 4, 447 Collins Street, Melbourne, Victoria 3000, Australia
 General Inquiries: info@sciltp.com