This paper proposes ammonia as a combustion inhibitor to control the combustion process in pure hydrogen engines. A three-dimensional spark ignition engine simulation model is established, coupled with a hydrogen/ammonia chemical reaction mechanism. The reliability of the model is verified using experimental data. The influence of different excess air coefficients (EACs) on hydrogen engine power, combustion, and emission performance is studied under ammonia blending conditions. The results show that the indicated thermal efficiency (ITE) increases as the EAC grows, while the mean indicated pressure and indicated power decrease. The ammonia blending ratio (ABR) of 30% improves the mean indicated pressure and the ITE of the hydrogen engine when the EAC is in the range of 1.4–1.6. The improvement is most significant at the EAC of 1.4, with increases of 4.18% and 4.58%, respectively. However, the heat release rate peak is reduced by 40%. When the EAC exceeds 1.6, ammonia blending reduces the mean indicated pressure. As the EAC grows, the in-cylinder pressure and heat release rate decrease, resulting in a prolonged burning period. When the EAC is 1.4, adding 30% ammonia causes the crankshaft angle corresponding to peak pressure to approach the top dead centre. Increasing the EAC and blending ammonia can reduce in-cylinder combustion temperatures. When the EAC exceeds 1.8, hydrogen engines under both ABRs can achieve near-zero nitrogen oxide emissions.
- Open Access
- Article
Performance Analysis of a Spark Ignition Hydrogen/Ammonia DUAL Fuel Engine
- Guohui Zhu 1,2,
- Yong Wang 1,†,
- Wei Chen 1,3,*,
- Qingsong Zuo 1,*,
- Chuanfu Kou 3,
- Dezhong Ning 3,
- Hui Wang 3,
- Mingchang Zhao 1,
- Ying Chen 1
Author Information
Received: 07 Oct 2025 | Revised: 31 Oct 2025 | Accepted: 05 Nov 2025 | Published: 12 Nov 2025
Abstract
1.Introduction
1.1.Background of Hydrogen and Ammonia Fuel
In the context of contemporary global challenges related to energy and the environment, low-carbon fuels have become a prominent subject of discourse [1–3]. The predominant source of power for automobiles continues to be the internal combustion engine (ICE) [4,5]. The utilisation of fossil fuels in ICEs gives rise to the emission of pollutants, including carbon oxides, nitrogen oxides (NOx), hydrocarbons, solid particles, and other pollutants. These emissions have the potential to inflict considerable harm on the environment 6. Consequently, the quest for efficient and clean substitute fuels is paramount to alleviating the energy crisis and reducing pressure on the environment [7–9].
1.2.Hydrogen and Ammonia Fuel Applications on ICEs
ICE workers have conducted extensive research on a wide range of alternative fuels [10–12], primarily encompassing ethanol 13, natural gas [14,15], hydrogen [16,17], and vegetable oil [18], among others. Among the available fuels, hydrogen is considered to be the cleanest because it does not contain carbon and produces only water when burned [19–21]. In contrast, hydrogen exhibits lower ignition energy and faster flame propagation [22,23]. However, the utilisation of hydrogen in ICEs is susceptible to anomalous combustion phenomena, including premature ignition, backfiring, shock, and explosion. These phenomena result in diminished engine power and augmented NOx emissions [24–26]. In order to resolve this issue, researchers have employed a variety of methodologies to improve the hydrogen combustion process. Li et al. [26] posited that hydrogen direct injection technology has the potential to mitigate the occurrence of abnormal engine combustion. As asserted by Nguyen et al. [27], the utilisation of a boosting system has been demonstrated to enhance hydrogen combustion stability, augment output power, and minimize emissions. Szwaja et al. [28] conducted a study in which they diluted fuel by exhaust gas recirculation. This was done to investigate the effect of dilution combustion on the same intensity of combustion, shock, and explosion. In the study by Yu et al. [29], the application of a blended fuel comprising hydrogen and ethanol to an engine resulted in the achievement of more stable combustion under lean-burn conditions. Ammonia, akin to hydrogen, is classified as a carbon-free clean fuel [30] that can be utilised as a fuel for steam turbines [31], ICEs [32], and boilers [33]. Ammonia’s high ignition energy and slow flame propagation [34] typically necessitate its mixture with other highly reactive fuels for combustion, including hydrogen [35], gasoline [36], and dimethyl ether [37]. The blending of ammonia with hydrogen to form a blended fuel has been demonstrated to enhance combustion conditions, reduce or even prevent abnormal combustion and other phenomena, and ensure safety while improving engine performance.
1.3.Hydrogen as a Combustion Aid
The majority of research conducted on hydrogen-ammonia fuel focused on utilising hydrogen as a combustion aid. As posited by Khateeb et al. [38], the utilisation of a hydrogen-ammonia fuel blend has been demonstrated to stabilise a flame with an equivalence ratio of less than 0.7, provided that the molar fraction of ammonia is less than 0.7. Yang et al. [39] investigated the flame structure of hydrogen-ammonia fuels under different equivalence ratios and found that hydrogen doping accelerated the rate of ammonia combustion and enhanced combustion stability. Dinesh et al. [40] conducted a study to investigate the impact of hydrogen mass fraction and compression ratio on the combustion process and NOx emissions in engines. The findings indicated that an augmented compression ratio led to a reduction in the combustion cycle, while an elevated hydrogen content enhanced combustion stability. It was also noted that ammonia was a critical factor in reducing nitric oxide. Tang et al. [41] explored the combustion limit of ammonia-hydrogen flames. It was established that augmenting the initial temperature of the premixed gas could engender an expansion in the ammonia-hydrogen flame’s lean/rich combustion limit. Wang et al. [42] investigated the impact of varying hydrogen-to-ammonia ratios on the combustion and emission performance of diesel engines. The investigation revealed that diesel engines blended with 30% hydrogen exhibited optimal overall performance. Mashruk et al. [43] investigated the NOx emission trend of hydrogen-ammonia fuel engines under varying equivalence ratios. The findings of the study indicated that the optimal equivalence ratio for reducing NOx emissions was in the range of 1.05 to 1.2, when the hydrogen fuel fraction was between 0 and 25%. Pochet et al. [44] conducted a study into the combustion of engines under varying hydrogen-ammonia mixing ratios. The investigation revealed that the blending of hydrogen-ammonia fuels had the potential to enhance engine power. Hong et al. [45] conducted a study on the lean combustion performance of the engine at varying ammonia-hydrogen mixing ratios. It was established that an increase in ammonia volume share resulted in a significant prolongation of combustion duration, accompanied by a reduction in both CoVpmax and brake thermal efficiency (BTE). Yu et al. [46] examined the impact of varying levels of hydrogen doping on the combustion and emissions of engines across a range of excess air coefficients (EAC). The findings of the study demonstrated that with an increase in hydrogen percentage, there was an improvement in the indicated mean effective pressure (IMEP), a reduction in combustion duration, and an enhancement in NOx emissions. Hong et al. [47] conducted a study on the impact of the hydrogen injection number and oxygen concentration on the performance of an ammonia-hydrogen engine. The findings of the study indicated that the combination of multiple hydrogen injections and an oxygen enrichment strategy yielded superior engine performance. Xin et al. [48] conducted a study to examine the effect of varying ammonia-hydrogen mixing ratios and EAC on engines. The findings indicated that the engine exhibited symptoms of misfiring when the ammonia content exceeded 80%. The BTE underwent a gradual decline as the EAC diminished.
1.4.Ammonia as a Combustion Inhibitor
Concurrently, studies have been conducted on the utilisation of ammonia as a combustion inhibitor to enhance the combustion stability of hydrogen. Wang et al. [49] conducted a study to examine the effect of injection timing and compression ratio on ammonia/hydrogen dual-fuel engines. The investigation revealed that the delay in fuel injection time led to diminished engine power, suboptimal economic performance, and elevated NOx emissions. It was demonstrated that an increased compression ratio resulted in enhanced engine power performance and economy. Xin et al. [50] conducted a study to ascertain the effect of ammonia doping on the combustion performance of a hydrogen fuel engine. The results demonstrated that the addition of ammonia led to a reduction in the hydrogen combustion rate, a decrease in the heat release rate, and an extension in the flame development (CA0-10) and propagation (CA10-90) periods of the engine. Concurrently, there was an enhancement in the thermal efficiency and performance of the engine. It has been confirmed that the administration of ammonia in the form of a dopant has the capacity to enhance the combustion of hydrogen. Ji et al. [51] analysed the engine performance of pure hydrogen and ammonia-hydrogen mixed fuel blended with 2.2% volume ammonia under different ignition timing strategies. A comparison of the results with those obtained for pure hydrogen reveals that ammonia doping prolonged the combustion time and reduced the in-cylinder pressure rise rate. However, this did not have any impact on the engine’s performance. The ignition time exerted a significant influence on the indicated thermal efficiency (ITE) of the blended fuel. Guo et al. [52] discovered that the addition of ammonia resulted in a decrease in the overall combustion rate and combustion efficiency, and an increase in NOx emissions. As demonstrated by Xin et al. [53], an increase in ammonia volume fraction was observed to correspond with elevated IMEP and ITE of the hydrogen engine. Ammonia is a combustion inhibitor that provides a new reference for hydrogen engines.
1.5.Objectives and Motivation
In conclusion, the present study demonstrates that ammonia can improve the combustion stability of hydrogen as a combustion inhibitor. Nevertheless, the study of ammonia as an inhibitor remains in its infancy. A significant number of studies on the application of hydrogen/ammonia fuels in engines have recently concentrated on parameters such as compression ratio, ignition strategy, and fuel ratio fraction. Furthermore, the fuel-to-air ratio is predominantly proximate to the stoichiometric ratio. It is imperative to investigate the combustion of hydrogen/ammonia fuel under conditions of thinning to enhance its thin combustion limit. It is important to note that experimental studies are only capable of obtaining a limited amount of quantitative engine data. Conversely, numerical simulations have the capacity to qualitatively analyse the combustion process of hydrogen/ammonia fuels and demonstrate greater levels of detail with regard to the combustion process. In the domain of engine research, the EAC parameter is of paramount importance, exerting a pivotal influence on the performance of engines in terms of power, combustion, and emission. However, there is a paucity of research reports on the combustion and emission performance of hydrogen/ammonia engines under various EAC terms.
The present paper adopts a three-dimensional numerical simulation method combined with a chemical reaction mechanism to investigate the combustion properties of hydrogen/ammonia dual-fuel engines and to obtain in-cylinder combustion information, with a view to revealing the effect of ammonia on hydrogen combustion under lean burn conditions. Subsequently, the model’s dependability is validated with experimental data. The hydrogen/ammonia fuel supply is premixed at the intake port. The present study investigates the effects of ammonia blending ratios (ABR) and EAC on engine power, combustion, and emissions performance. This work may provide research methodology and guidance for the application of hydrogen-blended ammonia in engine applications.
2.Model Building and Validation
2.1.Engine Geometry and Mesh Models
In this paper, a model of a spark ignition hydrogen engine is established using Converge software. The process of the hydrogen engine intake, compression, expansion, and exhaust is simulated. Table 1 gives the engine parameters.
Engine parameters.
| Parameter | Value |
|---|---|
| Stroke | 85.8 mm |
| Bore | 77 mm |
| Connecting rod length | 138.5 mm |
| Compression ratio | 10.5 |
| Displacement volume | 0.3995 L |
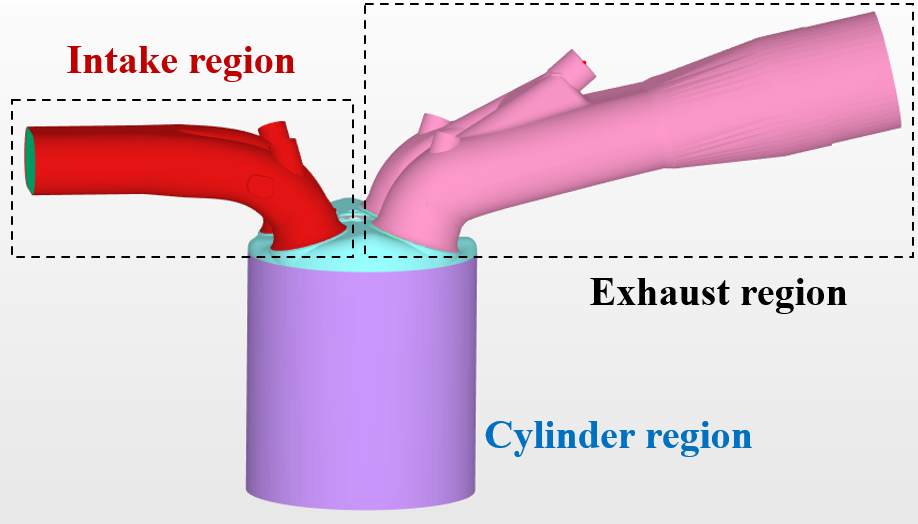
In order to facilitate the calculation process, the engine model is divided into three distinct regions: the intake region, the in-cylinder region, and the exhaust region. As illustrated in Figure 1, the three-dimensional geometric model of the engine is represented.
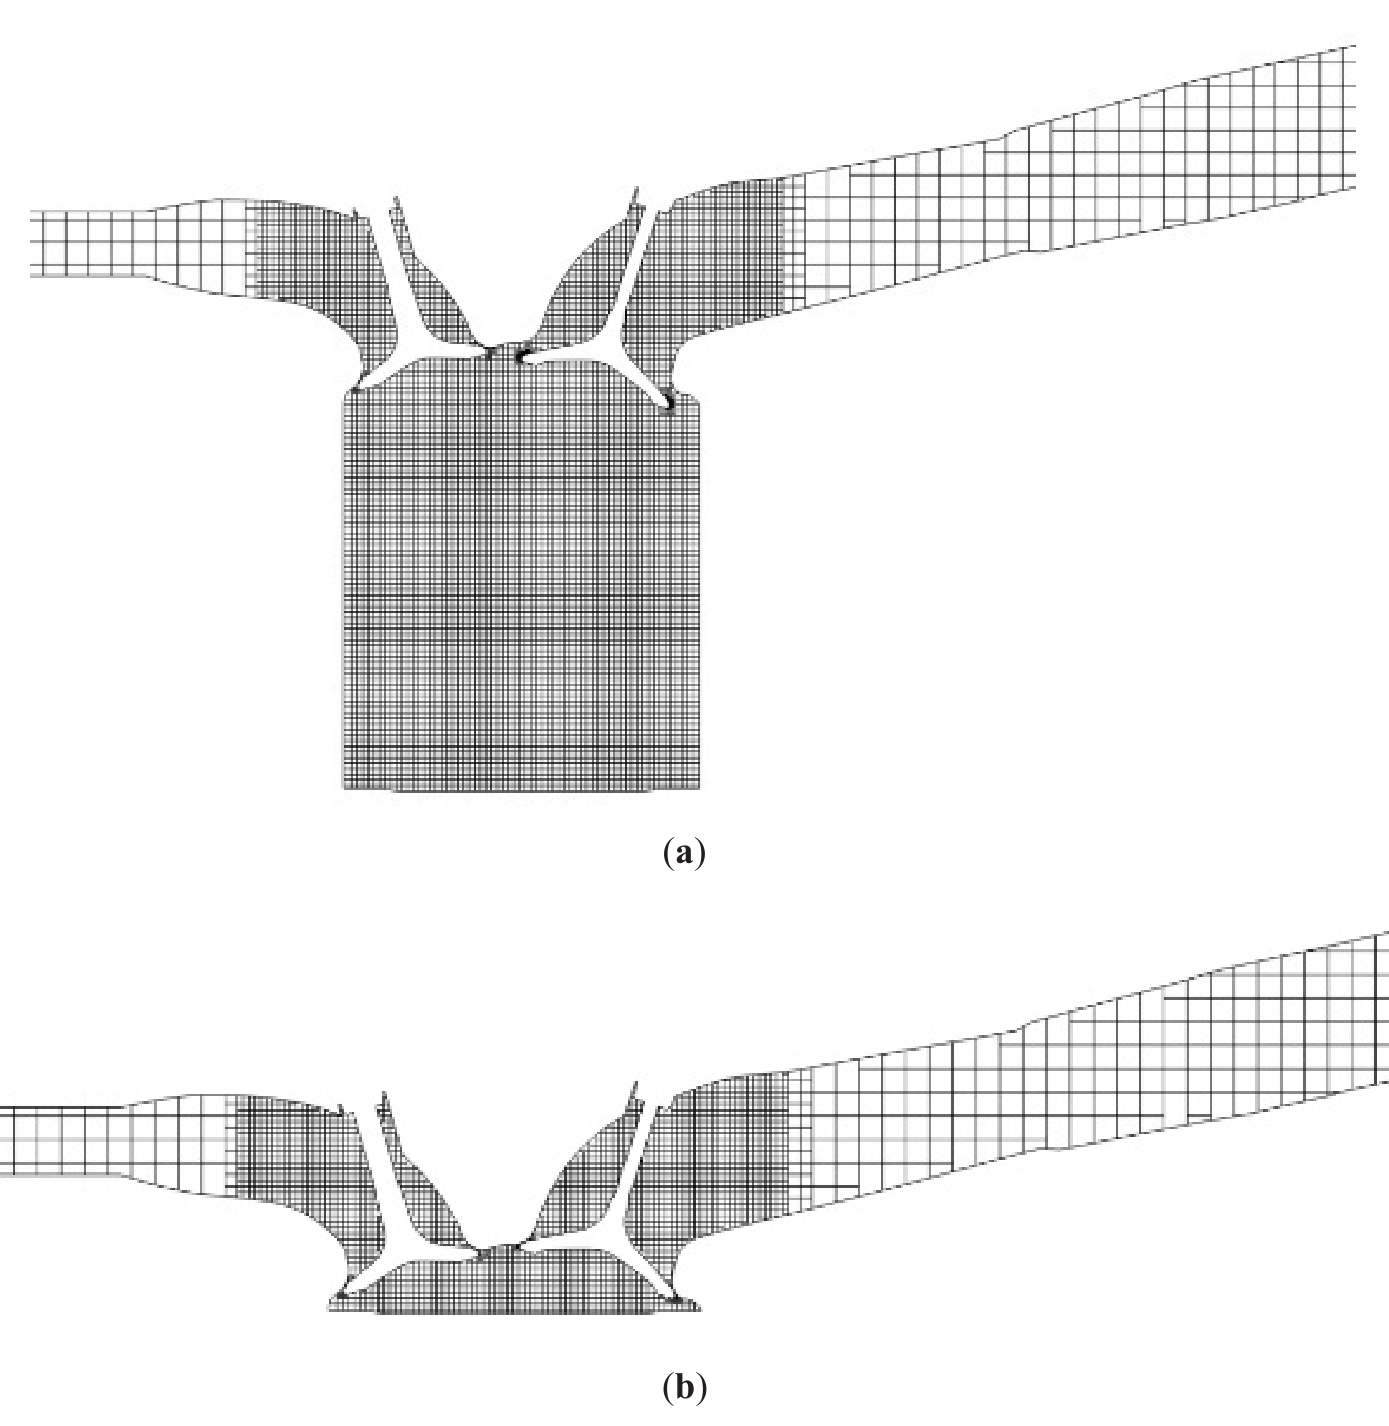
Converge software (v2.4, Thermo Fisher Scientific Inc., Waltham, MA, USA) possesses a fully automated mesh generation process that automatically generates orthogonal meshes based on fundamental mesh dimensions. The selection of the appropriate mesh generation for the engine model is based on two key principles: ensuring calculation accuracy and saving calculation time. Based on the automated mesh, three, four, and five levels of encryption are applied to the in-cylinder region, the intake valve, and the spark plug region, where the temperature, pressure, and flow rate vary greatly. The mesh when the piston is at the bottom dead center is shown in Figure 2a, and the maximum number of meshes for the intake process is 738,676. The mesh when the piston is at the top dead centre is shown in Figure 2b, and the maximum number of meshes in the combustion stage is 211,035.
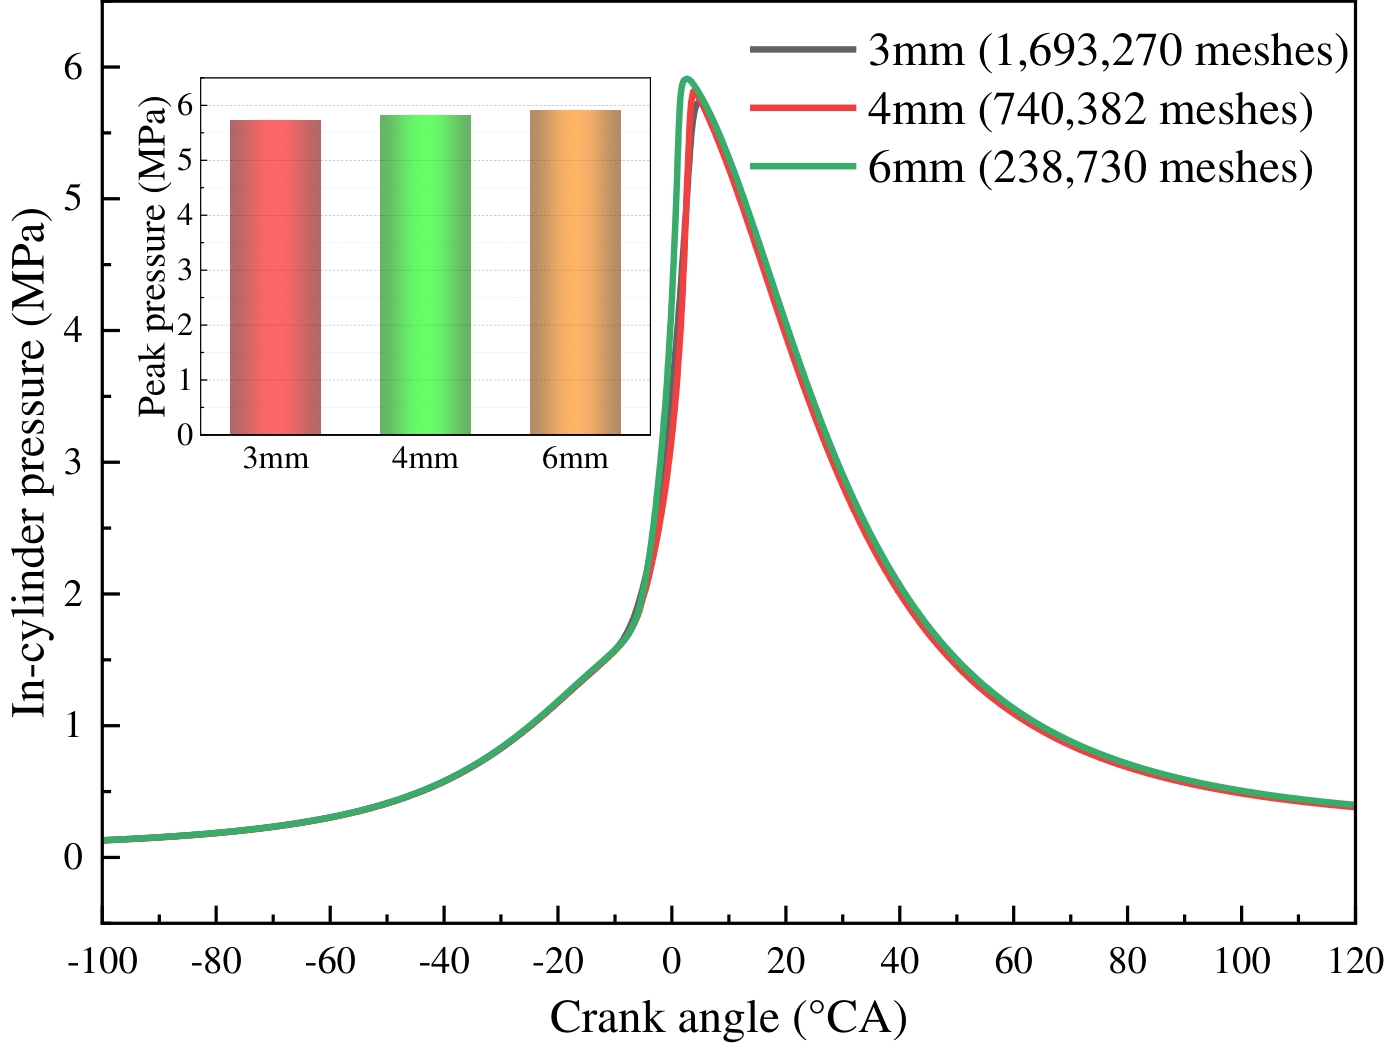
To circumvent the impact of the mesh on the calculation outcomes, it is imperative to ascertain the irrelevance of the mesh sizes prior to the execution of the calculation. The results of the comparison of in-cylinder pressure and peak pressure under different mesh numbers are shown in Figure 3. As demonstrated in Figure 3, the discrepancy between the cylinder pressure curves for basic mesh sizes of 3 mm and 4 mm is negligible, with a peak pressure error of 1.47%. Given the computational accuracy and time cost, a 4 mm base mesh size is selected for the subsequent calculations.
2.2.Physical Model Selection
The in-cylinder combustion process of the engine is simulated using Converge three-dimensional computational fluid dynamics (CFD) software (v2.4, Thermo Fisher Scientific Inc., Waltham, MA, USA). The RNG k-ε model is selected as the turbulence model in this paper, as it has been demonstrated to provide a superior description of the combustion and heat release processes of the fuel in the cylinder [54]. Furthermore, the RNG k-ε model employs the “reforming group” mathematical method, a technique that boasts the advantages of reduced computational requirements and extensive applicability. The SAGE model is selected as the combustion model based on the detailed chemical reaction mechanism. The software is capable of solving each chemical reaction step and the transport equation in accordance with the kinetic theory of chemical reactions. It is evident that, in accordance with the imported reaction mechanism file, the model has the capacity to accurately simulate the process of ammonia/hydrogen combustion, in addition to the phenomena of shock waves and explosion backfire. Furthermore, the model is capable of accurately characterising the combustion process. The present paper selects the widely used ammonia/hydrogen chemical reaction mechanism [55], including 42 components and 130 reactions. The ignition model utilises a spherical ignition source with a radius of 0.5 mm, which is subdivided into a breakdown ignition and a continuous discharge phase. The ignition energy in this paper is set to 20 mJ, the breakdown ignition period is set to 0.5 °CA, and the continuous discharge period is set to 10 °CA [54,56]. These settings are based on the ignition energy settings of hydrogen engines in the literature. Since the combustion of hydrogen and ammonia hardly produces soot, the Soot emission model is not enabled. Given that NOx is the dominant pollutant from hydrogen/ammonia combustion, the mature Extended Zeldovich model [57] is applied to predict NOx emissions.
2.3.Boundary Conditions and Study Cases
The establishment of reasonable boundary conditions is imperative to ensure the reliability of the simulation results. As demonstrated in Table 2 of this paper, the model boundary conditions are set according to the experimental data. The intake and exhaust boundaries are set to one atmosphere. The engine is naturally aspirated. Since this model uses ammonia/hydrogen premixed combustion, the intake conditions need to be modified to an appropriate ratio of ammonia/hydrogen/air mixture according to the calculated working conditions.
Boundary conditions.
| Parameters | Value |
|---|---|
| Intake temperature | 323 K |
| Intake pressure | 0.1 MPa |
| Exhaust pressure | 0.1 MPa |
| Piston temperature | 550 K |
| Cylinder wall temperature | 500 K |
| Cylinder head temperature | 500 K |
The simulation start time is the intake valve opening timing (410 °CA BTDC), and the end time is delineated as the exhaust valve closing timing (370 °CA ATDC). The ignition timing is set to 16 °CA BTDC according to Reference [58], and the combustion model is turned on before the start of ignition and turned off at the moment of exhaust valve opening.
To examine the effect of ammonia doping on the hydrogen engine, pure hydrogen and hydrogen/ammonia (ammonia mass fraction of 30%) are selected as fuels, and the engine speed is 1500 r/min. The engine performance of power, combustion, and emissions is studied and compared under different EAC operating conditions from 1.4 to 1.9. The specifics of the study cases are given in Table 3.
Selection of study cases.
| Fuel | EAC | Fuel | EAC |
|---|---|---|---|
| 100% Hydrogen | 1.4 | 70% Hydrogen +30% Ammonia | 1.4 |
| 1.5 | 1.5 | ||
| 1.6 | 1.6 | ||
| 1.7 | 1.7 | ||
| 1.8 | 1.8 | ||
| 1.9 | 1.9 |
2.4.Model Validation
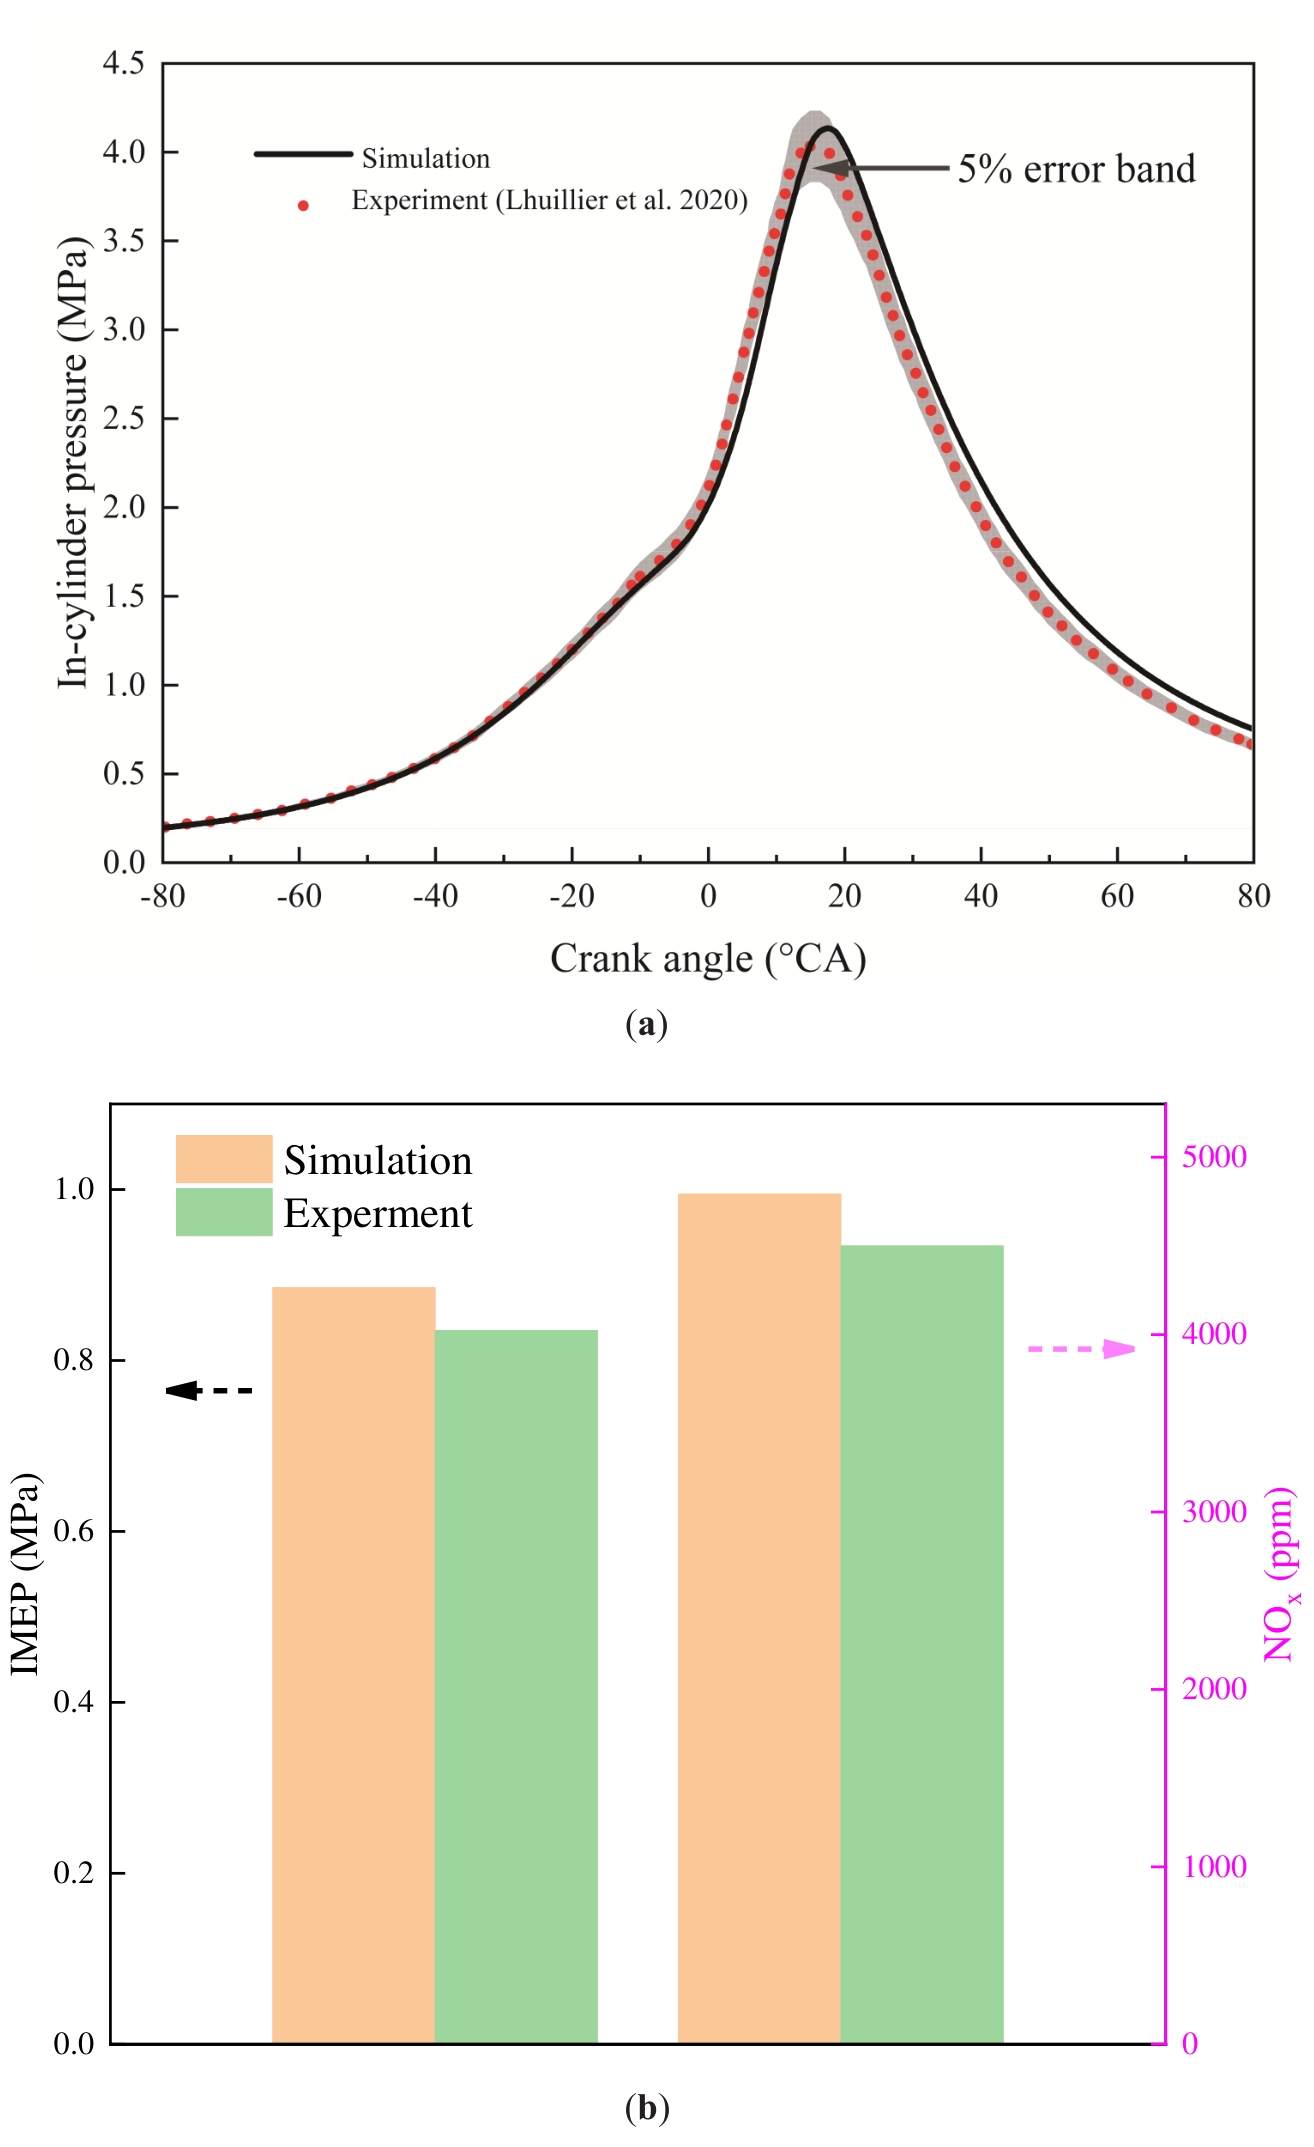
In order to verify the reliability of the numerical model presented in this paper, its accuracy is assessed through the utilisation of experimental data from Ref. [58]. As demonstrated in Table 4, the parameters and simulation conditions of the engine are delineated. The validation results are displayed in Figure 4. As demonstrated in Figure 4a, the simulated values of the in-cylinder pressure during the intake period demonstrate a strong correlation with the experimental data. The peak pressure error between the simulated values and the experimental data is 1.9%, and the in-cylinder pressure average error is 5.4%. In comparison with the experimental data, the simulated peak pressure appeared to be phase-delayed by 2 °CA. The 5% error band is illustrated in the figure, and it can be observed that the simulation pressure curve is located close to this error band, thereby substantiating the reliability of the combustion prediction model. The measurement of engine power and emission performance is typically achieved through the utilisation of IMEP and NOx, respectively. The comparison results of the simulated values with the experimental data are illustrated in Figure 4b. The IMEP and NOx emission errors between the simulated value and the experimental data are 6% and 6.5%, respectively. In summary, this paper compares three parameters: in-cylinder pressure, IMEP, and NOx emission. The results demonstrate that the data errors are within acceptable limits and that the numerical model developed in this paper is reasonable and reliable. The main reasons for the errors in the model are as follows: (1) The numerical simulation cannot fully predict the heat loss between the cylinder walls. (2) CFD techniques do not fully simulate real engine conditions and don’t consider the potential effects of air leakage. Therefore, the simulated values will have some deviation from the experimental data.
Engine working parameters and simulation conditions.
| Parameters | Experimental | Simulation |
|---|---|---|
| Engine speed | 1500 rpm | 1500 rpm |
| Intake temperature | 323 K | 323 K |
| Intake pressure | 0.1 MPa | 0.1 MPa |
| Ignition timing | 13 °CA BTDC | 13 °CA BTDC |
| Ignition energy | - | 20 mJ |
| Equivalence ratio | 1 | 1 |
| Hydrogen fuel fraction | 60% | 60% |
3.Results and Discussions
3.1.Effect of Engine Power Performance
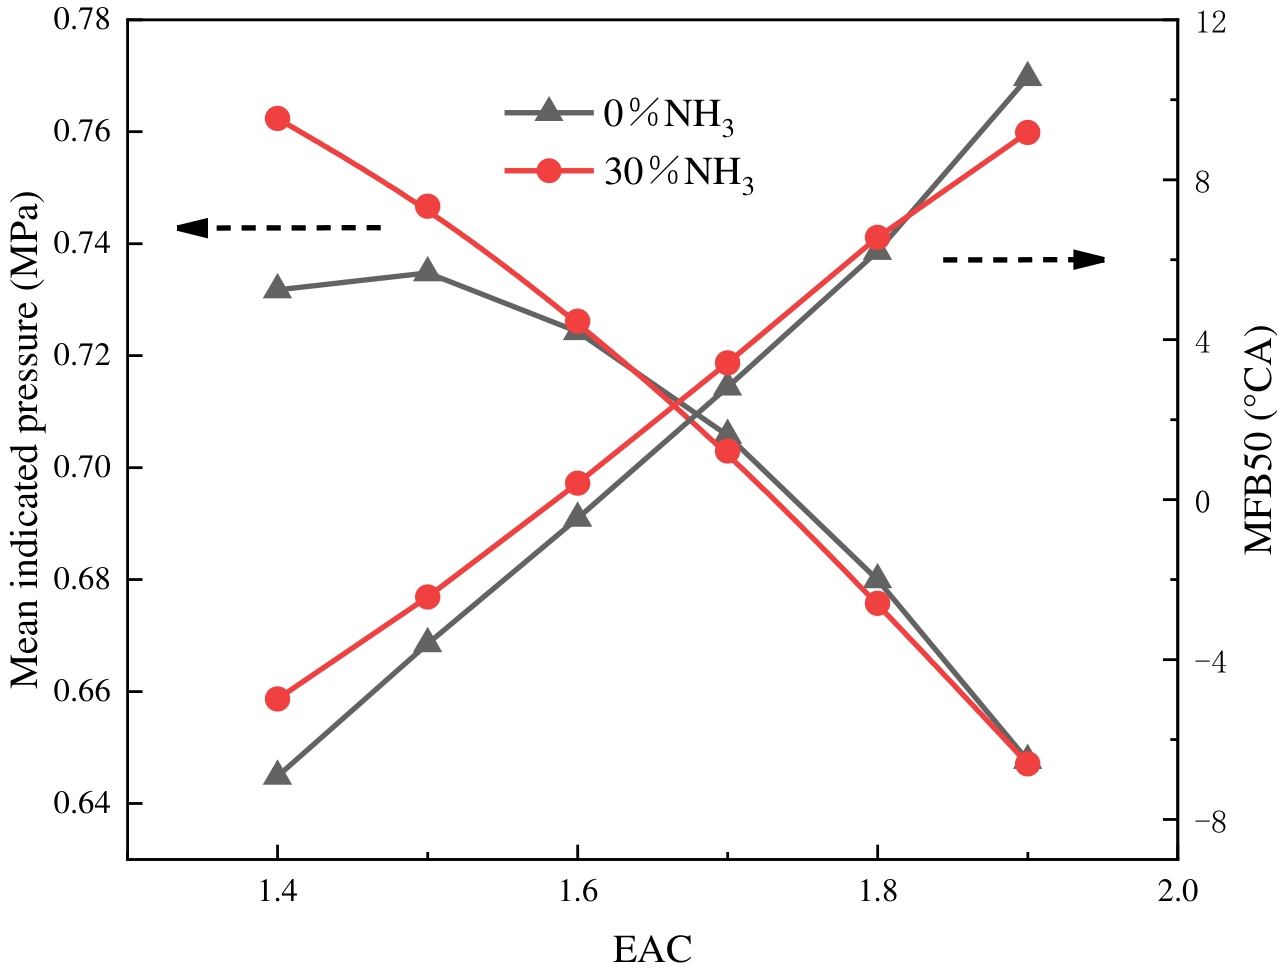
The mean indicated pressure is a significant metric for evaluating the operational efficiency of the engine. MFB50 denotes the position of the combustion centre of gravity. As illustrated in Figure 5, the mean indicated pressure and MFB50 changing rules are shown at varying ABRs and EACs. It is evident that with the increase in EAC, the mean indicated pressure firstly increases and then decreases for the pure hydrogen condition, and gradually decreases for the ammonia-doped 30% condition. In comparison with pure hydrogen fuel, the mean indicated pressure for the doping of 30% ammonia is higher at an EAC of 1.4–1.6, but slightly lower at an EAC of 1.6–1.9. This phenomenon can be attributed to the fact that as the EAC increases, the proportion of fuel relative to air is reduced, thereby leading to an insufficient release of heat. Consequently, this results in a decrease in the mean indicated pressure. While the percentage of pure hydrogen fuel is higher under low EAC conditions, the hydrogen combusts too rapidly, and the fuel combusts unevenly, combusting more before the top dead centre. This results in lower engine performance at an EAC of 1.4. At an EAC of 1.4, blending 30% ammonia results in an approximate 4.18% improvement in the mean indicated pressure. Although ammonia fuel exhibits low activity, the blending process of ammonia slows down the hydrogen combustion rate, thereby bringing the centre of combustion gravity closer to the top dead centre. 16 °CA BTDC is increasingly the best ignition timing, and the combustion is closer to the maximum brake torque condition. Consequently, at the EAC of 1.4 to 1.5, the mean indicated pressure under 30% ammonia blending is higher than that of pure hydrogen. At the EAC of 1.6 to 1.9, the centre of combustion gravity is located after the top dead centre. This is because ammonia has a low heat value, and the fuel releases less heat. Consequently, the mean indicated pressure of the engine is reduced after blending ammonia fuel. In summary, matching the proper EAC to the fuel characteristics is extremely critical for engine performance improvement.
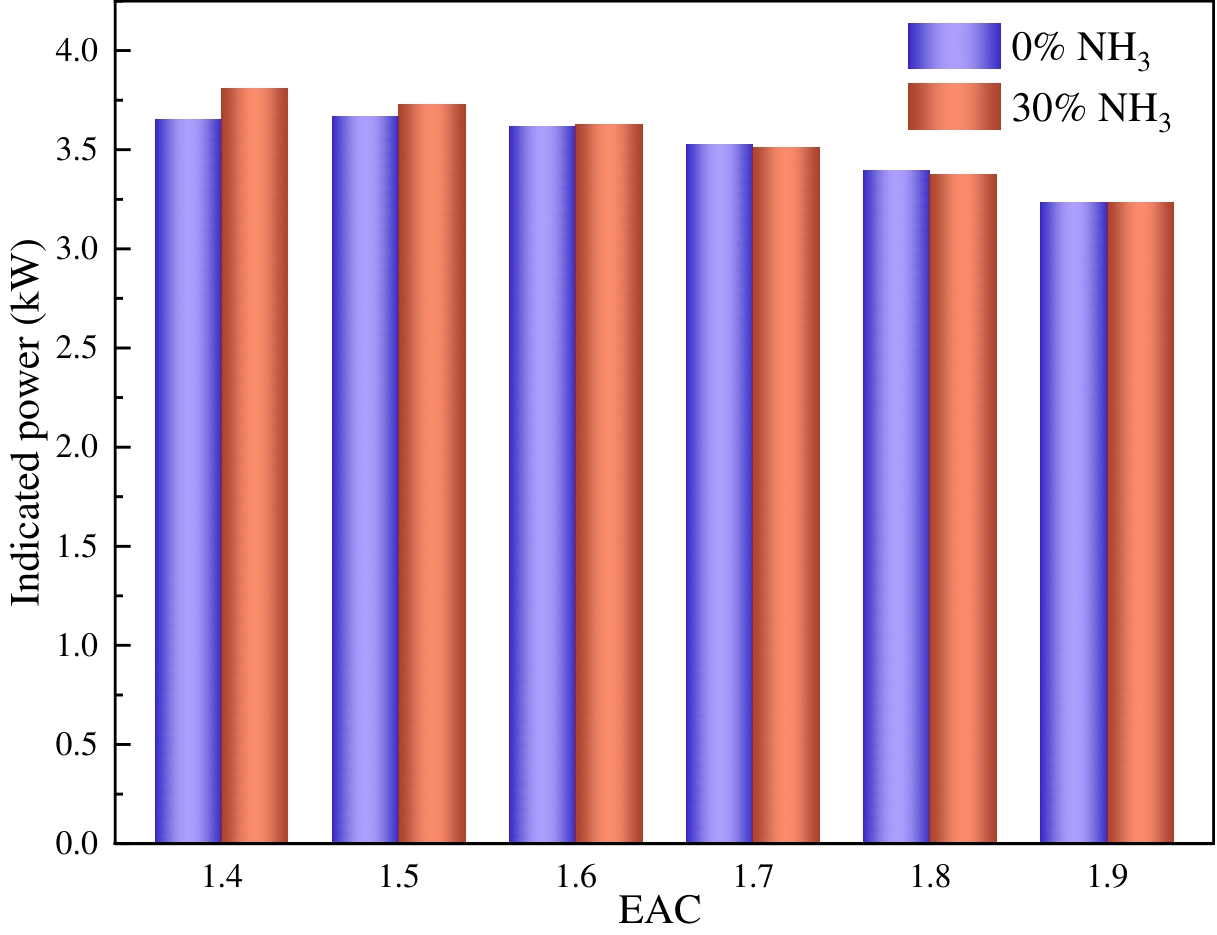
The indicated power is defined as the work done by the engine per unit of time, which is another important index of the engine’s dynamic performance. Figure 6 shows the indicated power-changing rules at different ABRs and EACs. The indicated power under both fuels generally decreases with an increase in EAC. When the EAC is in the range of 1.4 to 1.6, the blending of ammonia results in an increase in the indicated power. Conversely, when the EAC is in the range of 1.6 to 1.9, the blending of ammonia leads to a slight reduction in the indicated power. The cause of this phenomenon is consistent with the mean indicated pressure above.
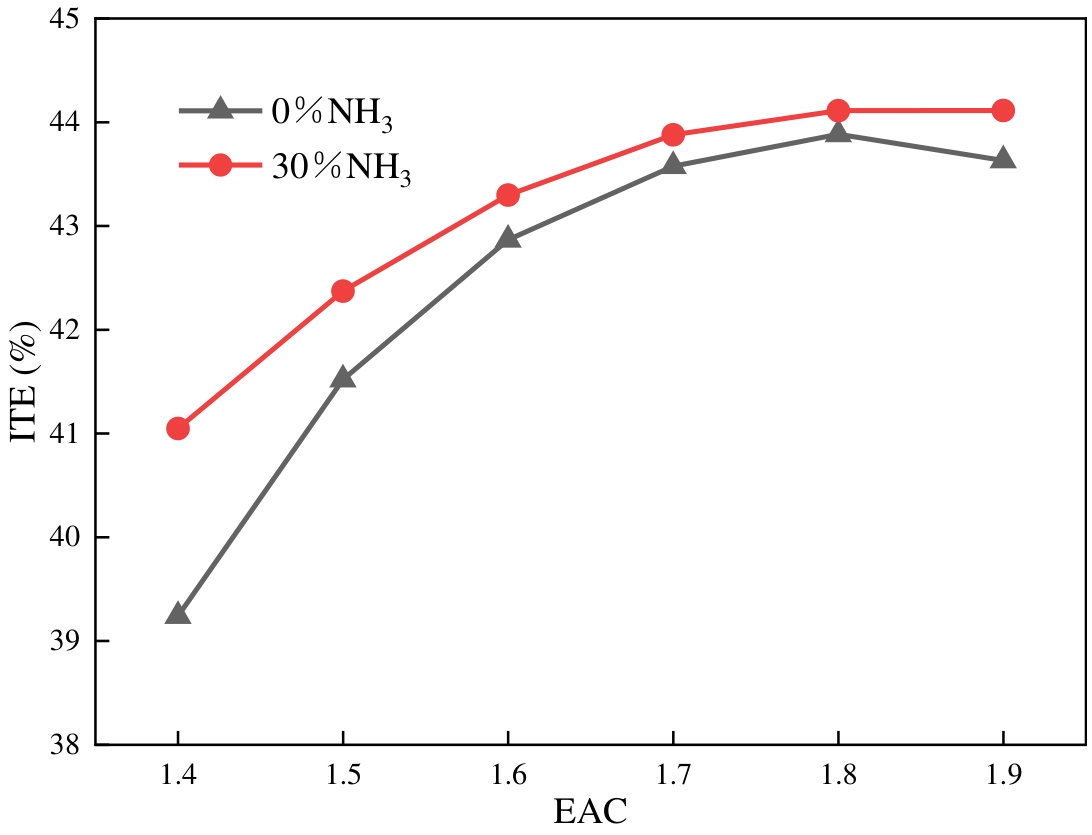
ITE is a significant index for evaluating the economic performance of the engine, calculated from Equations (1) and (2) [59]. Figure 7 displays the ITE changing laws at different ABRs and EACs. The ITE of pure hydrogen fuel exhibits an initial increase, followed by a subsequent decrease, as the EAC is increased. As the EAC grows, the ITE of hydrogen engines after ammonia doping initially increases and then stabilises. This is due to the larger EAC, which enhances the oxygen concentration in the fuel-air mixture. This, in turn, boosts the fuel’s combustion efficiency and makes the heat release more uniform and stable. Furthermore, the increasing EAC leads to lower in-cylinder temperatures, which reduce cooling losses and exhaust losses. Consequently, the ITE increases. Conversely, elevated EAC levels result in diminished in-cylinder temperature, thereby impeding flame propagation and prolonging combustion duration. The heat release time will be too long, causing grave heat loss. It is also evident from Figure 7 that blending ammonia improves the hydrogen engine ITE at different EACs. The enhancement is most noticeable at an EAC of 1.4, with ITE improving by 4.58%. Adding ammonia slows the rate of hydrogen combustion, reduces the rate of in-cylinder pressure and temperature rise, and decreases cooling losses.
where is the mean indicated pressure, D is the cylinder diameter, and S is the stroke.
where Q is the heat consumed to obtain the corresponding indicated work (kJ).
3.2.Effect of Engine Combustion Performance
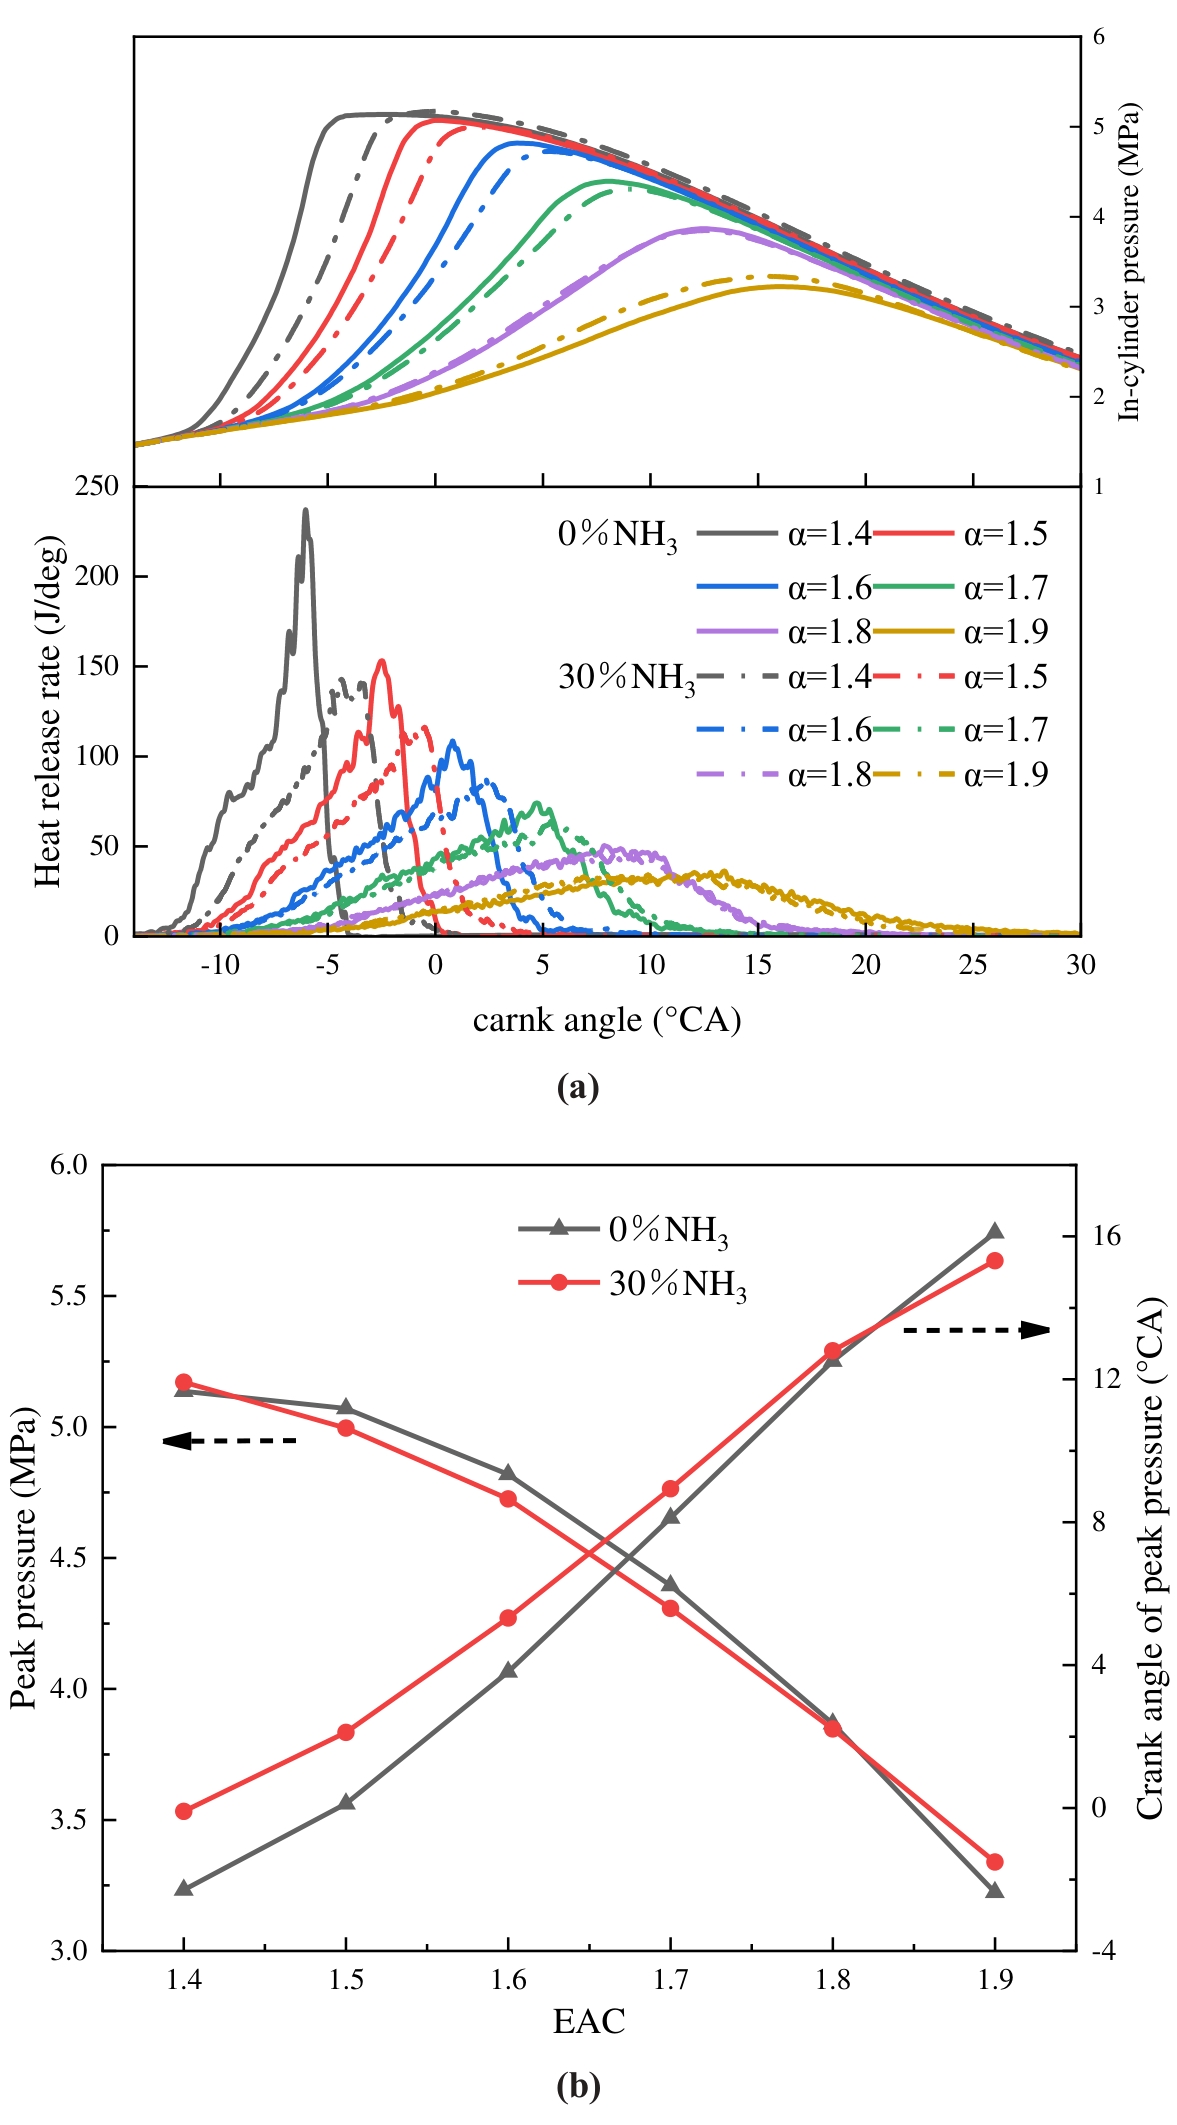
The in-cylinder pressure and heat release rate are critical parameters in characterising the engine’s operational capacity and reflecting the combustion state, which is pivotal for the analysis of combustion. Figure 8 illustrates the in-cylinder pressure and heat release rate-changing laws at different ABRs and EACs. As demonstrated in Figure 8a,b, as the EAC increases, the peak pressure decreases, and the crank angle corresponding to the peak pressure is delayed accordingly. In-cylinder pressure undergoes a precipitous increase at low EAC, reaching its peak just before the top dead centre. The heat release rate peak also reduces as EAC increases, and the crank angle, which is homologous to the starting heat release, is delayed accordingly. With the addition of ammonia, the crank angle is homologous to the heat release start being delayed, the heat release rate peak declines, and the heat release cycle is prolonged, a phenomenon that is more pronounced at low EAC. At the EAC of 1.4, the heat release rate peak is reduced by 40%. The impact of blending 30% ammonia is less pronounced, yet the occurrence of the crank angle corresponding to the peak pressure is postponed at an EAC of less than 1.8. Furthermore, the crank angle corresponding to the peak pressures at two fuels is progressively closer as EAC increases, and is closest at EAC = 1.8. This phenomenon is attributed to the higher EAC, which results in lower fuel concentration in the cylinder, slower combustion heat release, lower pressure generated by combustion, and thus a delayed crank angle corresponding to the peak pressure. In conditions of low EAC, the upstroke of the piston and the high combustion rates of hydrogen resulted in a sharp increase in in-cylinder pressure to a peak. Meanwhile, as combustion proceeds, the fuel concentration drops and the combustion rate slows down, leading to a lower heat release rate after reaching its peak and a longer heat release time. Ammonia has a higher ignition energy and the laminar flame speed is 1/50 of hydrogen. In comparison with pure hydrogen, the blending of 30% ammonia results in an increase in the required ignition energy of the fuel, as well as a deceleration of both the combustion rate and the flame propagation spread. This results in an increase in the quantity of fuel burned during the do-work stroke, an extension of the heat release time, and a reduction in the heat release rate peak. Too high a heat release rate will harm the engine, which indicates that blending ammonia at low EAC has a significant effect on improving the combustion of hydrogen.
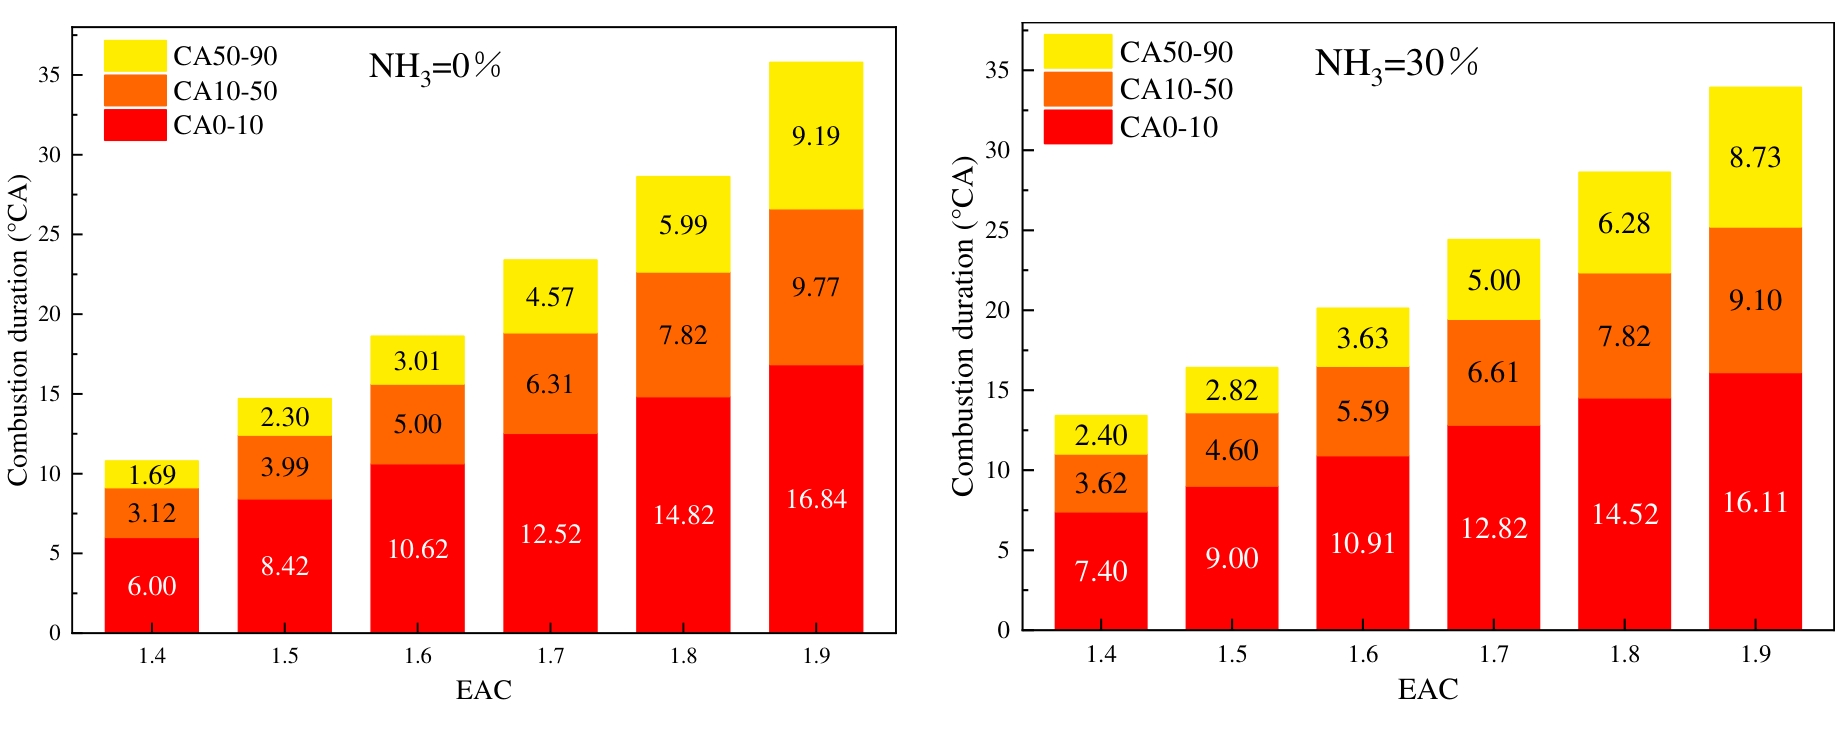
The initial combustion stage is denoted by CA0-10, the flame propagation stage by CA10-50, the rapid combustion stage by CA50-90, and the combustion duration period by CA10-90. As illustrated in Figure 9, the variation rule of the combustion phase is demonstrated under differing conditions of ABRs and EACs. It has been demonstrated that the duration of all combustion stages is subject to an increase in accordance with the rise in EAC. This phenomenon is attributed to the elevated EAC, which leads to a reduction in in-cylinder temperature and pressure. This results in the deterioration of fuel combustion conditions, thereby impeding flame development and propagation. It is also clear from Figure 9 that ammonia blending results in an augmentation of the combustion time for each stage when the EAC is less than 1.8. However, when the EAC is 1.9, ammonia blending has been shown to shorten the CA10-50 and the CA50-90. The ammonia exhibits high ignition energy and a slow laminar flame propagation rate. The blending of ammonia slows down the hydrogen flame developing rate, thus prolonging the combustion duration. Under high EAC conditions, regardless of whether ammonia is mixed or not, flame propagation is slow with long combustion durations. According to Figure 8a, it can be seen that when the EAC is 1.9, ammonia doping raises the cylinder pressure, which plays a major role in the flame development and propagation process, thereby leading to a slight reduction in combustion duration.
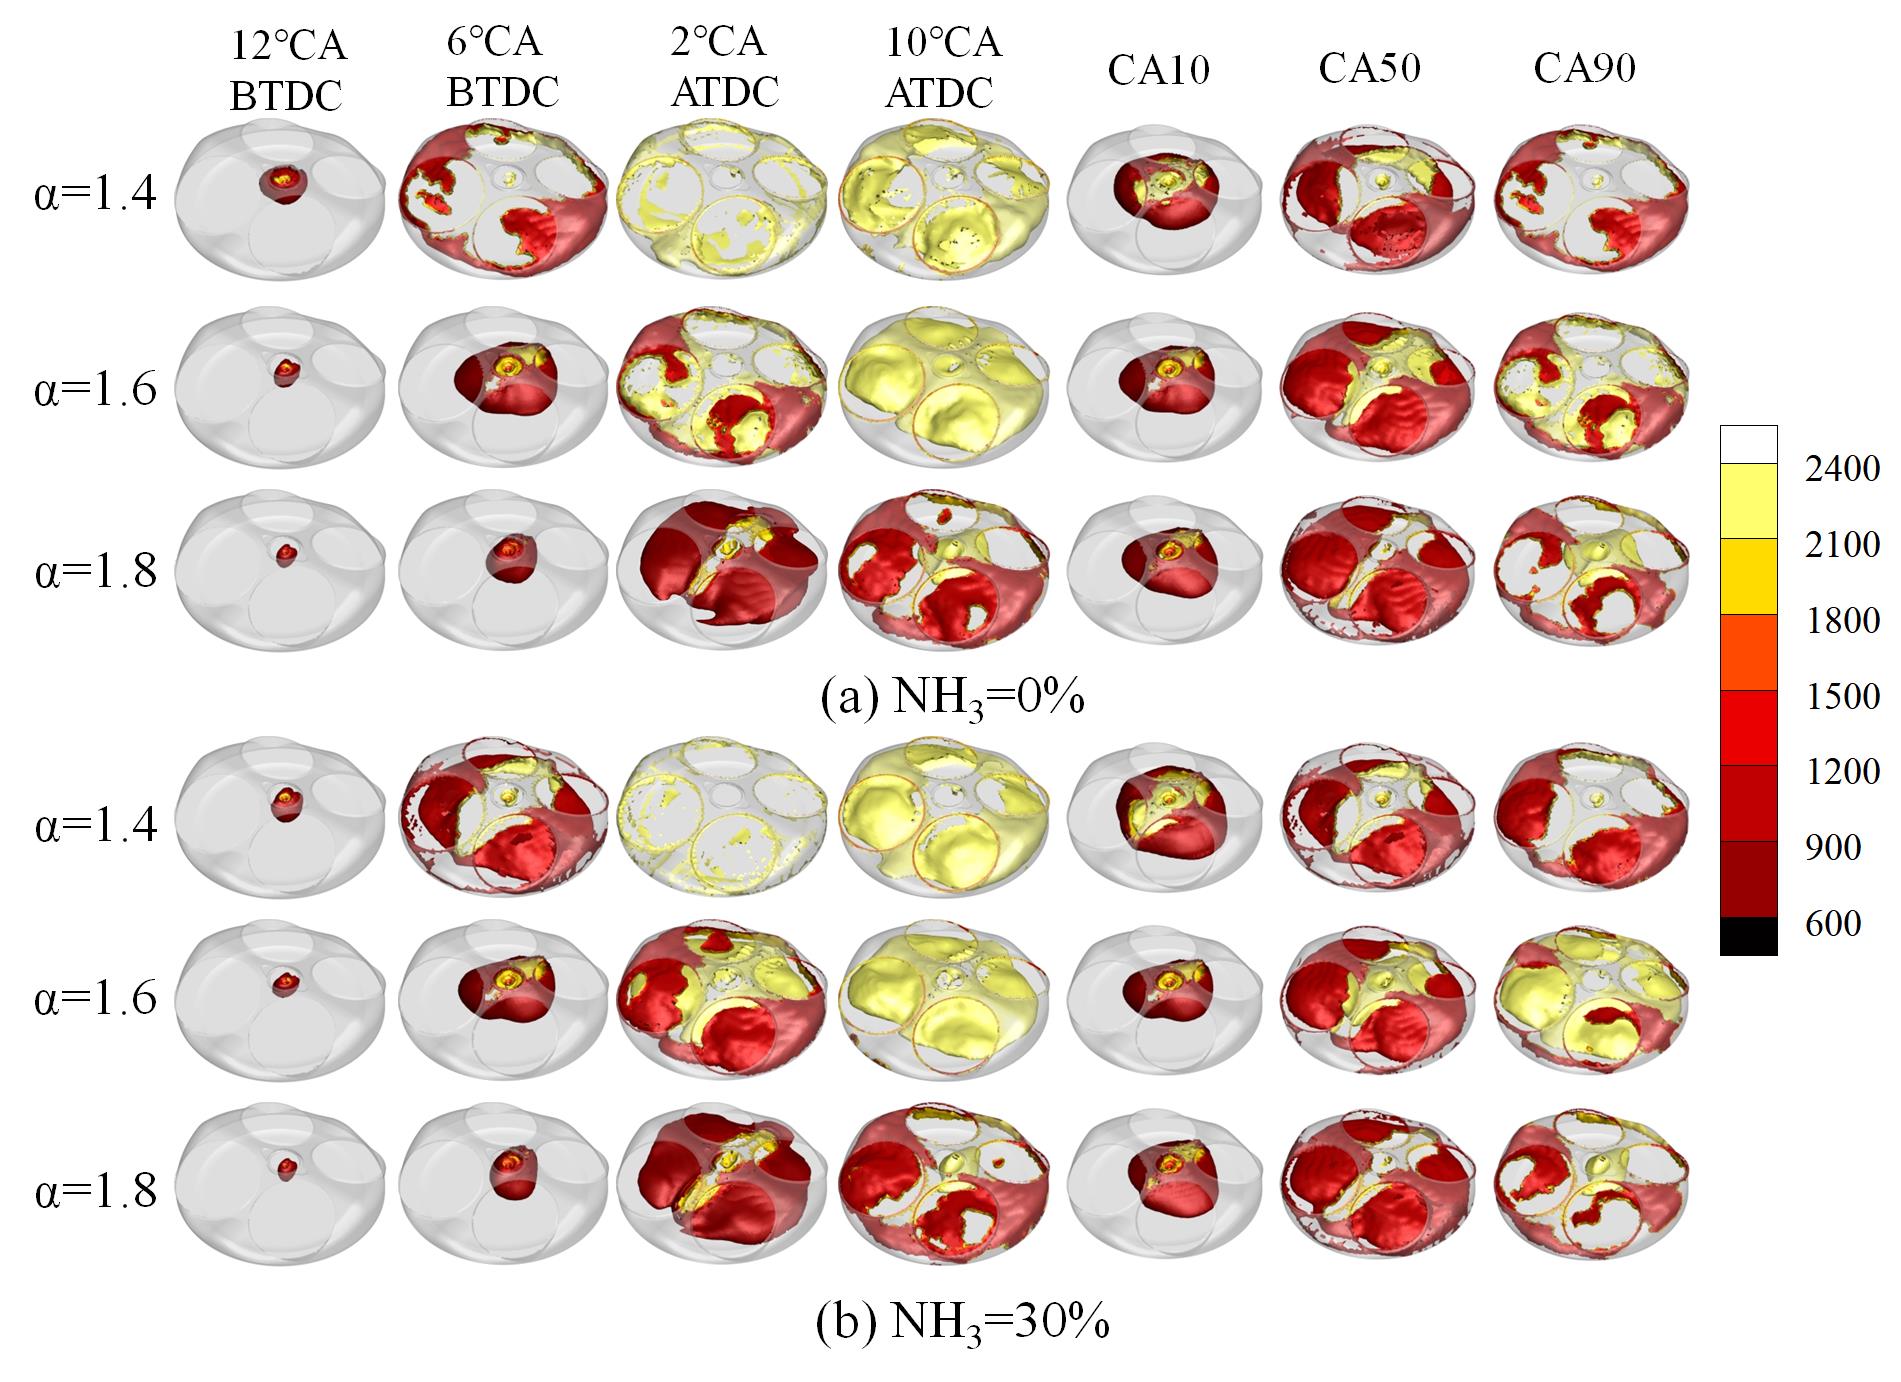
The temperature field cloud map provides a more intuitive characterization of the flame development process. Figure 10 illustrates the changing rule of the temperature field cloud map at different ABRs and EACs. As demonstrated in Figure 10a, when the EAC is set at 1.4 and the crank angle is at 6 °CA BTDC, the flame front has propagated to the surrounding walls of the combustion chamber. The mean temperature of the cylinder is approaching 2400 K at the crank angle of 2 °CA ATDC. At an EAC of 1.6, the development of the flame is relatively slow, and at a crank angle of 6 °CA BTDC, the flame occupies only one-third of the combustion chamber. And the flame development near the top dead center is complete. When the EAC is 1.8, at a crank angle of 6 °CA BTDC, the flame front remains in proximity to the spark plug, exhibiting a significantly slower rate of propagation in comparison to the EAC of 1.4. The complete development of the flame is only observed at 10 °CA ATDC. As demonstrated in Figure 10b, the development of hydrogen flames following the mixing of ammonia is retarded due to the reduced laminar flame speed of ammonia. In conditions of low EAC, the development of the flame front is found to be more significantly inhibited by ammonia. At an EAC of 1.8, ammonia doping will not slow flame development. From Figure 10b, the flame surface does not extend to the surrounding walls of the combustion chamber until 10 °CA ATDC. This is slightly faster than under pure hydrogen conditions, which is consistent with the aforementioned results. As illustrated in Figure 10, it is found that the flame of mixed ammonia develops more completely than pure hydrogen at CA10 when the EAC is 1.4. This is because the addition of ammonia results in a delay in the crank angle corresponding to CA10, CA50, and CA90. Consequently, the flame development lasts longer than that of pure hydrogen and has a greater flame area. When the EAC is 1.8, there is no significant difference in flame development between doped 30% ammonia and pure hydrogen.
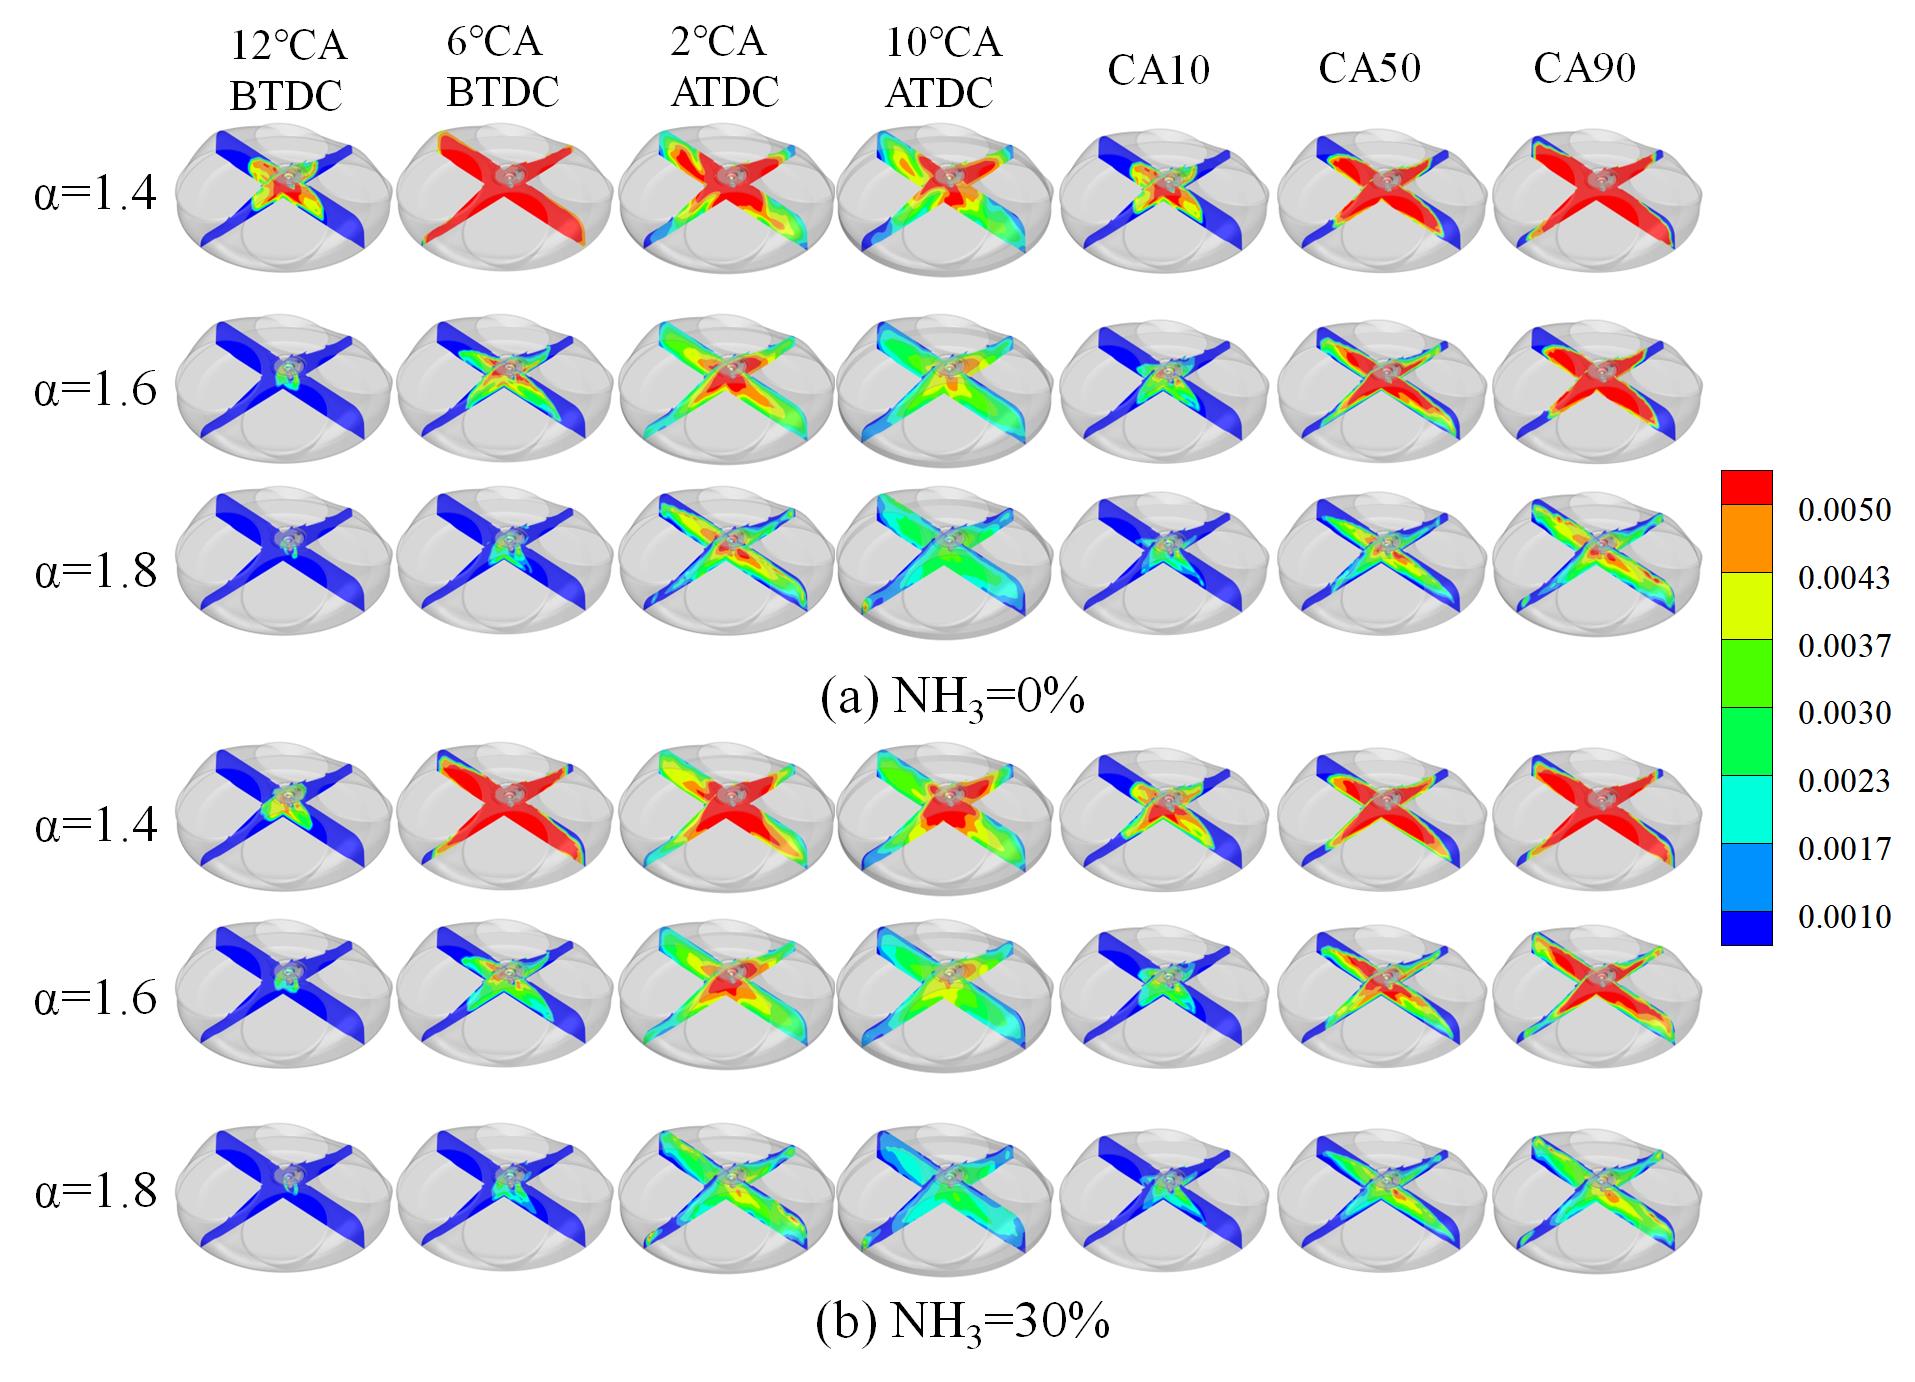
The mass fraction of the OH group is indicative of the reaction intensity. Figure 11 shows the OH group mass fraction change rule at different ABRs and EACs. The region of higher OH group concentration is located in proximity to the spark plug. With the increase in EAC, the diffusion speed of the reaction from the center to the surroundings slowed down. At the EAC of 1.4, the concentration of the OH group in the cylinder at 6 °CA BTDC is approximately 0.005, and CA90 is located in proximity to 6 °CA BTDC. However, when the EAC is 1.8, there is a reduced number of regions in which the OH group concentration can reach 0.005, with the majority of areas only reaching a maximum of approximately 0.0037. This indicates that the EAC significantly slows down the intensity of the reaction in the cylinder. A comparison of Figure 11a,b reveals that the blending of ammonia leads to a reduction in the overall concentration of OH groups within the combustion chamber. At the EAC of 1.4, the reaction diffusion rate is found to be slowed down by blending ammonia at a crank angle of 10 °CA BTDC. Concurrently, a substantial decline in the concentration of the OH group is observed in the vicinity of the spark plug. At the EAC of 1.8, following the blending of ammonia, the concentration of the OH group in the cylinder of 14 °CA ATDC and 20 °CA ATDC is also significantly lower than that of pure hydrogen. Concurrently, the high concentration region of the OH group exhibits a decline at CA10, CA50, and CA90, a phenomenon that is collectively influenced by the crank angle delay and the slow reaction rate of ammonia.
3.3.Effect of Engine Emissions Performance
The in-cylinder temperature exerts a substantial influence on NOx generation. Figure 12 illustrates the effects of ABR and EAC on the in-cylinder temperature are demonstrated. The maximum combustion temperature within the cylinder undergoes a substantial decline with an escalation in EAC, while the crank angle at which the maximum temperature is attained is postponed concomitantly. Following the blending of 30% ammonia, a decline in the maximum temperature within the cylinder is observed, and the crank angle corresponding to this maximum temperature is postponed under low EAC conditions. However, when the EAC exceeds 1.8, the maximum combustion temperature in the cylinder rises when ammonia is added. The observed phenomenon can be attributed to the fact that the increase in the EAC results in a reduction of the fuel energy flow rate. And leads to a decrease in temperature and a delay in the crank angle corresponding to the maximum temperature. The low laminar flame speed of ammonia slows down the hydrogen flame development, and the heat release is not concentrated, resulting in lower cylinder temperatures and delayed crank angles after mixing ammonia. However, at higher EAC conditions, ammonia blending accelerates the temperature rise rate, speeding up the fuel’s heat release and thus keeping the temperature constant or even higher.
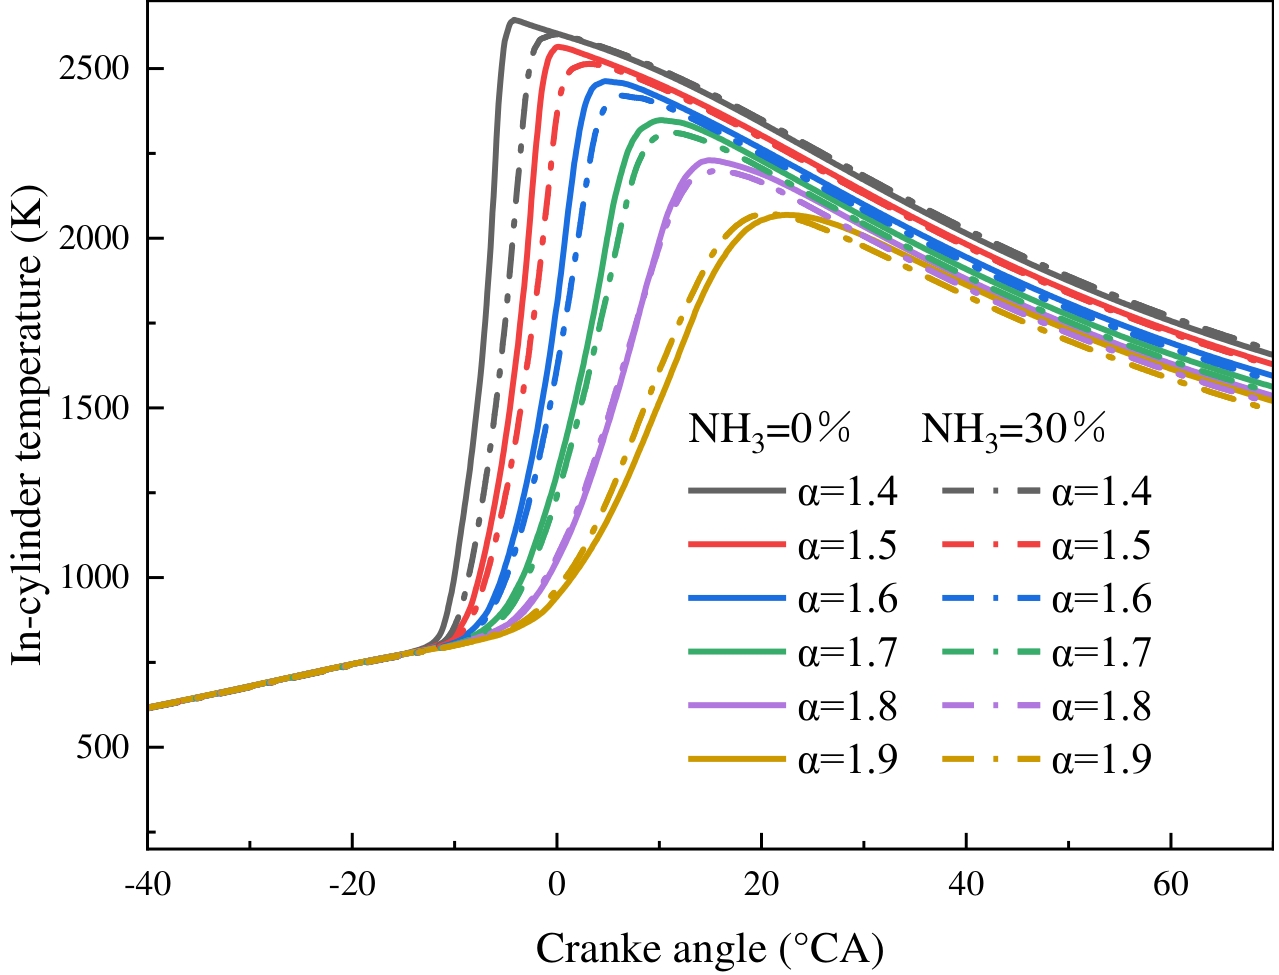
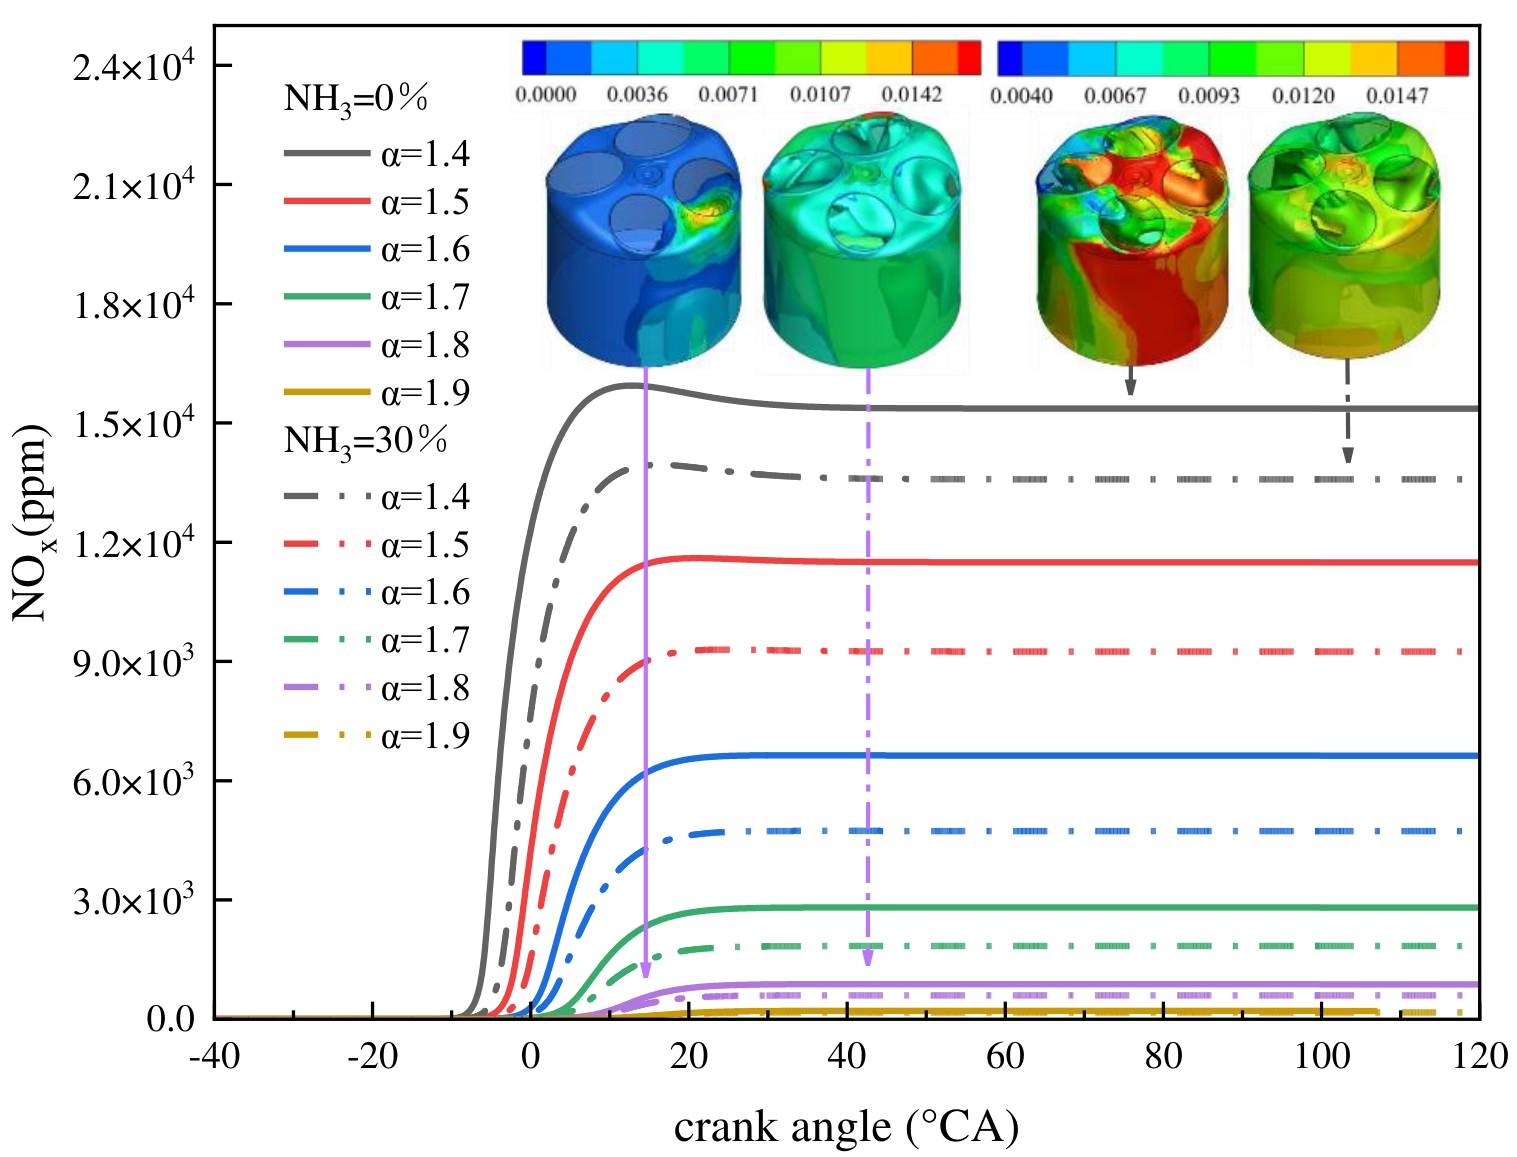
Figure 13 gives the NOx emissions at different ABRs and EACs. The pattern of NOx production is consistent with the pattern of temperature change. With constant fuel mass, a decline in NOx production is observed as EAC increases, and the crank angle at which NOx production commences is postponed. The effect of ammonia blending on NOx emissions is more pronounced at low EAC operating conditions. When the EAC is 1.4 to 1.7, blending 30% ammonia can effectively reduce NOx emissions. When the EAC exceeds 1.8, NOx emissions can approach zero. The NOx distribution cloud diagram at the time of the exhaust valve opening is shown in Figure 13, which demonstrates that NOx is more distributed at the exhaust valve side. The in-cylinder NOx distribution under pure hydrogen fuel is concentrated on the exhaust side when the EAC is 1.8. When blending 30% ammonia, there is a significant decrease in NOx in the cylinder, accompanied by a more uniform distribution within the cylinder. The mass fraction is primarily concentrated at 0.005. This phenomenon can be attributed to the Zeldovich mechanism [60], the generation of NOx depends on the high-temperature, oxygen-rich environment, and is related to the period of high temperature, so the generation of NOx is closely dependent on the temperature change in the cylinder. Compared with pure hydrogen, although the presence of nitrogen atoms in ammonia reacts with oxygen to generate additional NOx, the formation of NOx is mostly dominated by temperature in this condition.
4.Conclusions
The present study aims to examine the combustion and emission performance of pure hydrogen and ammonia/hydrogen engines under lean combustion conditions. To this end, a three-dimensional spark ignition engine numerical simulation model of the coupled hydrogen/ammonia chemical reaction mechanism has been constructed. The reliability of the model is then verified based on experimental data. The present study investigates the effect of ABR on engine power, combustion, and emission performance at an EAC ranging from 1.4 to 1.9. The mean indicated pressure, in-cylinder pressure, heat release rate, NOx emissions, etc., are mainly analyzed. The main conclusions are summarized as follows:
(1) As the EAC rises, the hydrogen engine’s mean indicated pressure and indicated work decrease for both ammonia blending ratios, while the ITE improves. However, in the pure hydrogen condition, when EAC rises from 1.8 to 1.9, ITE reduces instead. At EAC 1.4 to 1.6, 30% ammonia significantly improves the power performance of the hydrogen engine. The enhancement is most noticeable at EAC = 1.4, where the mean indicated pressure and indicated work increase by 4.18% and 4.18% respectively, and the ITE improves by 4.58%. When the EAC is above 1.6, the ammonia blending improvement effect diminishes.
(2) With rising EAC, pressure and heat release rate peak in the cylinder drop, and the heat release period lengthens, delaying the crank angle at which it starts. With an identical EAC, blending ammonia had a limited impact on pressure peaks. But at low EAC, ammonia blending delays the crank angle at which peak pressure appears, a phenomenon that fades at higher EAC. Also, ammonia mixing slashes the heat release rate peak and extends the heat release time under low EAC. At an EAC of 1.4, the heat release rate peak drops by 40%.
(3) Ammonia slows the propagation speed of the hydrogen flame and has a significant inhibitory effect on hydrogen flame development and propagation at low EAC conditions. The combustion duration is shortened when the EAC exceeds 1.7. Ammonia blending slows the hydrogen combustion reaction rate in the combustion chamber, providing effective control of hydrogen combustion.
(4) As EAC increases, the maximum combustion temperature in the cylinder decreases, and the crank angle corresponding to this temperature is delayed. NOx emissions reduce with increasing EAC, approaching zero at over 1.8 EAC. Compared to the pure hydrogen mode, blending 30% ammonia significantly reduces in-cylinder combustion temperatures and NOx emissions at an EAC of 1.4 to 1.7. At 1.8 to 1.9 EAC, ammonia blending has no significant effect on in-cylinder temperature or emissions.
It is imperative to undertake a comprehensive study of both the ABR and EAC to enhance the power output and reduce the emissions of a hydrogen engine operating under lean combustion conditions. In the future, the effects of lean combustion strategies (dual-fuel injection strategies, ignition strategies, wider ammonia mixing ratios, jet ignition methods, etc.) on hydrogen engine performance will be studied in depth.
Author Contributions: G.Z.: Investigation, Funding acquisition Writing—review & editing, Supervision; Y.W.: Validation, Data curation, Writing—review & editing, Writing—original draft; W.C.: Conceptualization, Writing—review & editing, Methodology, Supervision, Funding acquisition; Q.Z.: Investigation, Funding acquisition Writing—review & editing, Supervision; C.K.: Software, Methodology; D.N.: Software, Methodology; H.W.: Software, Methodology; M.Z.: Methodology, Visualization; Y.C.: Software, Methodology. All authors have read and agreed to the published version of the manuscript”.
Funding: This research was funded by National Natural Science Foundation of China, grant number 52076184; was funded by Guangxi Science and Technology Major Program, grant number GuikeAA24206057; was funded by Natural Science Foundation of Hunan Province, grant number 2023JJ10042; was funded by Natural Science Foundation of Hunan Province, grant number 2025JJ70096; was funded by China Postdoctoral Science Foundation, grant number 2023MD734160; was funded by Guangxi Postdoctoral Special Foundation, grant number 2023011; was funded by Guangxi Postdoctoral Special Foundation, grant number 2024053; was funded by Scientific Research Fund of Hunan Provincial Education Department, grant number 24B0156; was funded by Open Research Fund of Vehicle Measurement Control and Safety Key Laboratory of Sichuan Province of Xihua University, grant number QCCK2025-0020.
Institutional Review Board Statement: Not applicable for studies not involving humans or animals.
Informed Consent Statement: Not applicable for studies not involving humans.
Data Availability Statement: The original contributions presented in this study are included in the article. Further inquiries can be directed to the corresponding authors.
Acknowledgments: The authors would like to acknowledge Project (52076184) supported by the National Natural Science Foundation of China; Project (GuikeAA24206057) supported by the Guangxi Science and Technology Major Program; Project (2023JJ10042, 2025JJ70096) supported by the Natural Science Foundation of Hunan Province; Project (2023MD734160) supported by the China Postdoctoral Science Foundation; Project (2023011, 2024053) supported by the Guangxi Postdoctoral Special Foundation; Project (24B0156) supported by the Scientific Research Fund of Hunan Provincial Education Department; Project (QCCK2025-0020) supported by the Open Research Fund of Vehicle Measurement Control and Safety Key Laboratory of Sichuan Province of Xihua University.
Conflicts of Interest: The authors declare no conflict of interest.
Use of AI and AI-assisted Technologies: No AI tools were utilized for this paper.
References
- 1.
Lu, Z; Ma, M; Wang, T; Lu, T; Wang, H; Feng, Y; Shi, L; Numerical research of the in-cylinder natural gas stratification in a natural gas-diesel dual-fuel marine engine. Fuel 2023, 337, 126861.
- 2.
Zhou, Y; Hong, W; Xie, F; Su, Y; Wang, Z; Liu, Y; Effects of different valve lift adjustment strategies on stoichiometric combustion and lean burn of engine fueled with methanol/gasoline blending. Fuel 2023, 339, 126934.
- 3.
Tian, Z; Wang, Y; Zhen, X; Liu, Z; The effect of methanol production and application in internal combustion engines on emissions in the context of carbon neutrality: A review. Fuel 2022, 320, 123902.
- 4.
Wang, X; Huang, J; Liu, H; Can China’s carbon trading policy help achieve Carbon Neutrality?—A study of policy effects from the Five-sphere Integrated Plan perspective. J. Environ. Manag. 2022, 305, 114357.
- 5.
Li, A; Zheng, Z; Peng, T; Effect of water injection on the knock, combustion, and emissions of a direct injection gasoline engine. Fuel 2020, 268, 117376.
- 6.
Barboza, A.B.V; Mohan, S; Dinesha, P; Influence of hydrogen peroxide emulsification with gasoline on the emissions and performance in an MPFI engine. Int. J. Hydrogen Energy 2022, 47, 25034–25043.
- 7.
Yang, S; Feng, J; Sun, P; Wang, Y; Dong, W; Yu, X; Li, W; Combustion and emissions characteristics of methanol/gasoline CISI engines under different injection modes. Fuel 2023, 333, 126506.
- 8.
Fil, H.E; Akansu, S.O; Ilhak, M.I; Experimental assessment on performance, emission and combustion characteristics of the use of diesel-acetylene mixtures at different loads in a ci engine. Fuel 2022, 324, 124469.
- 9.
Sun, X; Liu, H; Duan, X; Guo, H; Li, Y; Qiao, J; Liu, Q; Liu, J; Effect of hydrogen enrichment on the flame propagation, emissions formation and energy balance of the natural gas spark ignition engine. Fuel 2022, 307, 121843.
- 10.
Jia, Z; Denbratt, I; Experimental investigation into the combustion characteristics of a methanol-Diesel heavy duty engine operated in RCCI mode. Fuel 2018, 226, 745–753.
- 11.
Liu, J; Wang, L; Wang, P; Sun, P; Liu, H; Meng, Z; Zhang, L; Ma, H; An overview of polyoxymethylene dimethyl ethers as alternative fuel for compression ignition engines. Fuel 2022, 318, 123582.
- 12.
Tian, Z; Wang, Y; Zhen, X; Liu, D; Numerical comparative analysis on performance and emission characteristics of methanol/hydrogen, ethanol/hydrogen and butanol/hydrogen blends fuels under lean burn conditions in SI engine. Fuel 2022, 313, 123012.
- 13.
Chen, W; Yu, S; Pan, J; Fan, B; Zuo, Q; Zhang, B; Zhu, G; Yang, X; Effect analysis of the forward flow fuel injection angle on stratified combustion process in a high-pressure direct injection diesel Wankel engine (HPDI-DWE). Energy Convers. Manag. 2022, 253, 115179.
- 14.
Garg, M; Ravikrishna, R.V; In-cylinder flow and combustion modeling of a CNG-fuelled stratified charge engine. Appl. Therm. Eng. 2019, 149, 425–438.
- 15.
Meng, X; Tian, H; Long, W; Zhou, Y; Bi, M; Tian, J; Lee, C.F.F; Experimental study of using additive in the pilot fuel on the performance and emission trade-offs in the diesel/CNG (methane emulated) dual-fuel combustion mode. Appl. Therm. Eng. 2019, 157, 113718.
- 16.
Castro, N; Toledo, M; Amador, G; An experimental investigation of the performance and emissions of a hydrogen-diesel dual fuel compression ignition internal combustion engine. Appl. Therm. Eng. 2019, 156, 660–667.
- 17.
Santos, N.D.S.A; Alvarez, C.E.C; Roso, V.R; Baeta, J.G.C; Valle, R.M; Combustion analysis of a SI engine with stratified and homogeneous pre-chamber ignition system using ethanol and hydrogen. Appl. Therm. Eng. 2019, 160, 113985.
- 18.
Thiyagarajan, S; Varuvel, E; Karthickeyan, V; Sonthalia, A; Kumar, G; Saravanan, C.G; Dhinesh, B; Pugazhendhi, A; Effect of hydrogen on compression-ignition (CI) engine fueled with vegetable oil/biodiesel from various feedstocks: A review. Int. J. Hydrogen Energy 2022, 47, 37648–37667.
- 19.
Qian, L; Wan, J; Qian, Y; Sun, Y; Zhuang, Y; Experimental investigation of water injection and spark timing effects on combustion and emissions of a hybrid hydrogen-gasoline engine. Fuel 2022, 322, 124051.
- 20.
Chen, W; Yu, S; Zuo, Q; Zhu, G; Zhang, B; Yang, X; Combined effect of air intake method and hydrogen injection timing on airflow movement and mixture formation in a hydrogen direct injection rotary engine. Int. J. Hydrogen Energy 2022, 47, 12739–12758.
- 21.
Chen, X; Liu, Q; Zhao, W; Li, R; Zhang, Q; Mou, Z; Experimental and chemical kinetic study on the flame propagation characteristics of ammonia/hydrogen/air mixtures. Fuel 2023, 334, 126509.
- 22.
Kamil, M; Rahman, M.M; Performance prediction of spark-ignition engine running on gasoline-hydrogen and methane-hydrogen blends. Appl. Energy 2015, 158, 556–567.
- 23.
Zareei, J; Rohani, A; Alvarez, J.R.N; The effect of EGR and hydrogen addition to natural gas on performance and exhaust emissions in a diesel engine by AVL fire multi-domain simulation, GPR model, and multi-objective genetic algorithm. Int. J. Hydrogen Energy 2022, 47, 21565–21581.
- 24.
Xin, G; Ji, C; Wang, S; Meng, H; Chang, K; Yang, J; Hong, C; Monitoring of hydrogen-fueled engine backfires using dual manifold absolute pressure sensors. Int. J. Hydrogen Energy 2022, 47, 13134–13142.
- 25.
Park, C; Kim, Y; Choi, Y; Lee, J; Lim, B; The effect of engine speed and cylinder-to-cylinder variations on backfire in a hydrogen-fueled internal combustion engine. Int. J. Hydrogen Energy 2019, 44, 22223–22230.
- 26.
Mogi, Y; Oikawa, M; Kichima, T; Horiguchi, M; Goma, K; Takagi, Y; Mihara, Y; Effect of high compression ratio on improving thermal efficiency and NOx formation in jet plume controlled direct-injection near-zero emission hydrogen engines. Int. J. Hydrogen Energy 2022, 47, 31459–31467.
- 27.
Nguyen, D; Choi, Y; Park, C; Kim, Y; Lee, J; Effect of supercharger system on power enhancement of hydrogen-fueled spark-ignition engine under low-load condition. Int. J. Hydrogen Energy 2021, 46, 6928–6936.
- 28.
Szwaja, S. Dilution of fresh charge for reducing combustion knock in the internal combustion engine fueled with hydrogen rich gases. Int. J. Hydrogen Energy 2019, 44, 19017–19025.
- 29.
Yu, X; Hu, Z; Guo, Z; Li, D; Wang, T; Li, Y; Gong, T; Li, Y; Research on combustion and emission characteristics of a hydrous ethanol/hydrogen combined injection spark ignition engine under lean-burn conditions. Int. J. Hydrogen Energy 2022, 47, 27223–27236.
- 30.
Guo, Y; Pan, Z; An, L; Carbon-free sustainable energy technology: Direct ammonia fuel cells. J. Power Sources 2020, 476, 228454.
- 31.
Cesaro, Z; Ives, M; Nayak-Luke, R; Mason, M; Bañares-Alcántara, R; Ammonia to power: Forecasting the levelized cost of electricity from green ammonia in large-scale power plants. Appl. Energy 2021, 282, 116009.
- 32.
Cardoso, J.S; Silva, V; Rocha, R.C; Hall, M.J; Costa, M; Eusébio, D; Ammonia as an energy vector: Current and future prospects for low-carbon fuel applications in internal combustion engines. J. Clean. Prod. 2021, 296, 126562.
- 33.
Wen, D; Aziz, M; Flexible operation strategy of an integrated renewable multi-generation system for electricity, hydrogen, ammonia, and heating. Energy Convers. Manag. 2022, 253, 115166.
- 34.
Liu, L; Tan, F; Wu, Z; Wang, Y; Liu, H; Comparison of the combustion and emission characteristics of NH3/NH4NO2 and NH3/H2 in a two-stroke low speed marine engine. Int. J. Hydrogen Energy 2022, 47, 17778–17787.
- 35.
Dai, L; Hashemi, H; Glarborg, P; Gersen, S; Marshall, P; Mokhov, A; Levinsky, H; Ignition delay times of NH3/DME blends at high pressure and low DME fraction: RCM experiments and simulations. Combust. Flame 2021, 227, 120–134.
- 36.
Feng, Y; Zhu, J; Mao, Y; Raza, M; Qian, Y; Yu, L; Lu, X; Low-temperature auto-ignition characteristics of NH3/diesel binary fuel: Ignition delay time measurement and kinetic analysis. Fuel 2020, 281, 118761.
- 37.
Wang, Y; Zhou, X; Liu, L; Study on the mechanism of the ignition process of ammonia/hydrogen mixture under high-pressure direct-injection engine conditions. Int. J. Hydrogen Energy 2021, 46, 38871–38886.
- 38.
Khateeb, A.A; Guiberti, T.F; Wang, G; Boyette, W.R; Younes, M; Jamal, A; Roberts, W.L; Stability limits and NO emissions of premixed swirl ammonia-air flames enriched with hydrogen or methane at elevated pressures. Int. J. Hydrogen Energy 2021, 46, 11969–11981.
- 39.
Yang, W; Dinesh, K.R; Luo, K.H; Thevenin, D; Direct numerical simulation of turbulent premixed ammonia and ammonia-hydrogen combustion under engine-relevant conditions. Int. J. Hydrogen Energy 2022, 47, 11083–11100.
- 40.
Dinesh, M.H; Pandey, J.K; Kumar, G.N; Study of performance, combustion, and NOx emission behavior of an SI engine fuelled with ammonia/hydrogen blends at various compression ratio. Int. J. Hydrogen Energy 2022, 47, 25391–25403.
- 41.
Tang, G; Jin, P; Bao, Y; Chai, W.S; Zhou, L; Experimental investigation of premixed combustion limits of hydrogen and methane additives in ammonia. Int. J. Hydrogen Energy 2021, 46, 20765–20776.
- 42.
Wang, B; Yang, C; Wang, H; Hu, D; Wang, Y; Effect of Diesel-Ignited Ammonia/Hydrogen mixture fuel combustion on engine combustion and emission performance. Fuel 2023, 331, 125865.
- 43.
Mashruk, S; Kovaleva, M; Alnasif, A; Chong, C.T; Hayakawa, A; Okafor, E.C; Valera-Medina, A; . Nitrogen oxide emissions analyses in ammonia/hydrogen/air premixed swirling flames. Energy 2022, 260, 125183.
- 44.
Pochet, M; Truedsson, I; Foucher, F; Jeanmart, H; Contino, F; Ammonia-hydrogen blends in homogeneous-charge compression-ignition engine. SAE Tech. Pap. 2017, 2017-24-0087, 1–10.
- 45.
Hong, C; Ji, C; Wang, S; Xin, G; Meng, H; Yang, J; Ma, T; An experimental study of a strategy to improve the combustion process of a hydrogen-blended ammonia engine under lean and WOT conditions. Int. J. Hydrogen Energy 2023, 48, 33719–33731.
- 46.
Yu, X; Li, Y; Zhang, J; Guo, Z; Du, Y; Li, D; Wang, T; Shang, Z; Zhao, Z; Zhang, J; Effects of hydrogen blending ratio on combustion and emission characteristics of an ammonia/hydrogen compound injection engine under different excess air coefficients. Int. J. Hydrogen Energy 2024, 49, 1033–1047.
- 47.
Hong, C; Ji, C; Wang, S; Xin, G; Qiang, Y; Yang, J; Evaluation of hydrogen injection and oxygen enrichment strategies in an ammonia-hydrogen dual-fuel engine under high compression ratio. Fuel 2023, 354, 129244.
- 48.
Xin, G; Ji, C; Wang, S; Hong, C; Meng, H; Yang, J; Su, F; Experimental study on Miller cycle hydrogen-enriched ammonia engine by rich-burn strategy. Fuel 2023, 350, 128899.
- 49.
Wang, B; Yang, C; Wang, H; Hu, D; Duan, B; Wang, Y; Study on injection strategy of ammonia/hydrogen dual fuel engine under different compression ratios. Fuel 2023, 334, 126666.
- 50.
Xin, G; Ji, C; Wang, S; Meng, H; Chang, K; Yang, J; Effect of ammonia addition on combustion and emission characteristics of hydrogen-fueled engine under lean-burn condition. Int. J. Hydrogen Energy 2022, 47, 9762–9774.
- 51.
Ji, C; Xin, G; Wang, S; Cong, X; Meng, H; Chang, K; Yang, J; Effect of ammonia addition on combustion and emissions performance of a hydrogen engine at part load and stoichiometric conditions. Int. J. Hydrogen Energy 2021, 46, 40143–40153.
- 52.
Guo, S; Lou, Z; Huang, F; Wang, L; Liu, H; Hou, Z; Yang, Z; Zhang, X; Effect of hydrogen/ammonia mixing ratio on combustion and emission performance of hydrogen engine with different injection timing. Int. J. Hydrogen Energy 2024, 78, 157–168.
- 53.
Xin, G; Ji, C; Wang, S; Meng, H; Chang, K; Yang, J; Effect of different volume fractions of ammonia on the combustion and emission characteristics of the hydrogen-fueled engine. Int. J. Hydrogen Energy 2022, 47, 16297–16308.
- 54.
Yu, X; Li, G; Dong, W; Shang, Z; Guo, Z; Li, Y; Li, D; Zhao, Z; Numerical study on effects of hydrogen direct injection on hydrogen mixture distribution, combustion and emissions of a gasoline/hydrogen SI engine under lean burn condition. Int. J. Hydrogen Energy 2020, 45, 2341–2350.
- 55.
Okafor, E.C; Naito, Y; Colson, S; Ichikawa, A; Kudo, T; Hayakawa, A; Kobayashi, H; . Experimental and numerical study of the laminar burning velocity of CH4–NH3–air premixed flames. Combust. Flame 2018, 187, 185–198.
- 56.
Ji, C; Meng, H; Wang, S; Wang, D; Yang, J; Shi, C; Ma, Z; Realizing stratified mixtures distribution in a hydrogen-enriched gasoline Wankel engine by different compound intake methods. Energy Convers. Manag. 2020, 203, 112230.
- 57.
Li, Y; Gao, W; Li, Y; Fu, Z; Zou, J; Numerical investigation on combustion and knock formation mechanism of hydrogen direct injection engine. Fuel 2022, 316, 123302.
- 58.
Lhuillier, C; Brequigny, P; Contino, F; Mounaïm-Rousselle, C; Experimental study on ammonia/hydrogen/air combustion in spark ignition engine conditions. Fuel 2020, 269, 117448.
- 59.
Liu, S; Zhou, L; Internal Combustion Engine Fundamentals, 4th ed.; China Machine Press: Beijing, China, 2017.
- 60.
Bao, L; Sun, B; Luo, Q; Experimental investigation of the achieving methods and the working characteristics of a near-zero NOx emission turbocharged direct-injection hydrogen engine. Fuel 2022, 319, 123746.

This work is licensed under a Creative Commons Attribution 4.0 International License.
 Suite 4002 Level 4, 447 Collins Street, Melbourne, Victoria 3000, Australia
 General Inquiries: info@sciltp.com