The direct-injection spark-ignition methanol engines face challenges such as complex air-fuel mixture formation and severe wall heat transfer losses. A feasible solution is to adopt a spatial optimization approach using three-dimensional computational fluid dynamics (CFD) simulation. This paper utilizes a three-dimensional CFD full-cycle simulation model of a methanol engine with a complete spray and SAGE combustion coupling process. It conducts a comparative optimization based on the controlled variables, such as the spatial target point distributions of three different nozzle hole arrangements (AR1, AR2, and AR3). Through detailed numerical simulation, it obtains the optimized injector structural parameters. In the three-dimensional CFD simulation, compared with the highly centralized AR2 scheme, the indicated thermal efficiency of the AR1 and AR3 schemes was increased to 38.6% and 38.3%, respectively, and the heat transfer losses were significantly reduced to 17.7% and 20.4%, respectively, from 23.0%. Ultimately, the AR1 scheme achieved the optimal thermodynamic energy distribution. Moreover, its near-wall heat transfer loss was significantly less than that of the AR2 scheme.
- Open Access
- Article
Effects of Nozzle Hole Arrangement on Combustion Characteristics and Energy Distribution in a DISI Methanol Engine
- Yongqing Luo 1,
- Long Liu 1,
- Xingjian Guo 1,
- Keyan Liu 1,2,
- Hongliang Luo 1,*
Author Information
Received: 08 Apr 2026 | Revised: 08 May 2026 | Accepted: 14 May 2026 | Published: 10 Jun 2026
Abstract
Keywords
methanol engine | direct injection | nozzle hole arrangement | combustion characteristics | indicated thermal efficiency
1. Introduction
Traditional fossil fuels heavily power maritime shipping, the backbone of international trade, significantly exacerbating global warming and air pollution [1]. Facing increasingly stringent emission regulations, reducing pollutant emissions and promoting green and low-carbon transformation in the transportation sector have become important development goals. The use of clean and efficient alternative fuels is a key technical approach to achieve these goals [2]. Currently, promising alternative fuels include biodiesel [3], dimethyl ether [4], methanol [5], hydrogen [6], ammonia [7], and biomethane [8], among others. Methanol, recognized as a clean energy source by the International Renewable Energy Agency (IRENA) [9], has become one of the most highly anticipated fuels in the field of internal combustion engines. As a fuel or chemical, methanol itself does not directly reduce CO2 emissions; significant carbon reduction effects can only be achieved when methanol is produced using renewable energy sources. Research indicates that methanol produced via CO2 hydrogenation technology using renewable hydrogen can achieve near-zero carbon emissions [10]. Furthermore, renewable methanol produced through the pathway of biomass gasification combined with water electrolysis for hydrogen production can even achieve carbon-negative emissions under certain circumstances [11]. Currently, methanol exhibits significant improvements in economic viability, power performance, and emissions compared to gasoline engines [12]. Therefore, methanol possesses immense potential to become the primary alternative fuel in the future.
Depending on the method of fuel introduction into the cylinder, methanol engines are primarily classified into two categories: port fuel injection (PFI) and direct injection (DI) [13]. Compared to PFI, DI exhibits a shorter combustion duration and more stable heat release, thereby achieving higher thermal efficiency and a larger methanol energy fraction [14]. In terms of knock suppression, employing DI combined with optimized injection timing and split injection strategies can effectively mitigate knock intensity and enhance engine performance [15]. In the direct injection system of spark-ignition (SI) methanol engines, the spray and atomization characteristics of the fuel during the injection process play a critical role in air-fuel mixture formation and overall engine performance. Furthermore, the structural parameters of the injector represent one of the primary factors influencing the injection process [16]. The structural parameters of the injector primarily include the number of nozzle holes, their arrangement, and the orifice diameter. Kang et al. [17] investigated the effects of nozzle orifice diameter and hole number on the combustion characteristics of a light-duty diesel engine. The results indicated that with a smaller orifice diameter and a larger number of holes, both the lift-off length and spray penetration distance decreased. As the number of holes increased, interference and overlapping between adjacent flames were observed. Kim et al. [18] studied the influence of nozzle hole arrangements on the spray characteristics of gasoline direct injection (GDI) engines. The results demonstrated that hole arrangement affects the spatial distribution of fuel and droplet diameter by altering the spray penetration distance, cone angle, and atomization uniformity, thereby regulating the in-cylinder combustion process and emission formation. Chang et al. [19] compared and analyzed the evaporation characteristics of flash-boiling sprays from two five-hole GDI injectors with different hole arrangements. Jiang et al. [20] numerically optimized single-layer and multi-layer injector hole arrangements for a methanol/diesel DDFS engine. They explored how the relative positions, layer count, and inter-layer spacing of nozzle holes affect engine performance, combustion, and emissions.
Overall, injector parameters crucially affect spark-ignition engine performance. Previous research on injector hole arrangements predominantly focused on gasoline, diesel, and dual-fuel engines. Studies on pure methanol spark-ignition engines remain highly limited. Because of methanol’s distinct physicochemical properties—particularly its exceptionally high latent heat of vaporization—its spray and mixture formation behaviors differ significantly from conventional fuels. Consequently, existing nozzle design experiences from gasoline or diesel engines cannot be directly applied, making targeted spatial spray optimization for pure methanol engines essential. Therefore, this study developed three methanol injectors with different nozzle hole arrangements. We compared their combustion performance and energy distribution via numerical simulation. The simulations were conducted on the same engine under identical operating conditions.
2. Model Establishment and Verification
2.1. Model Construction
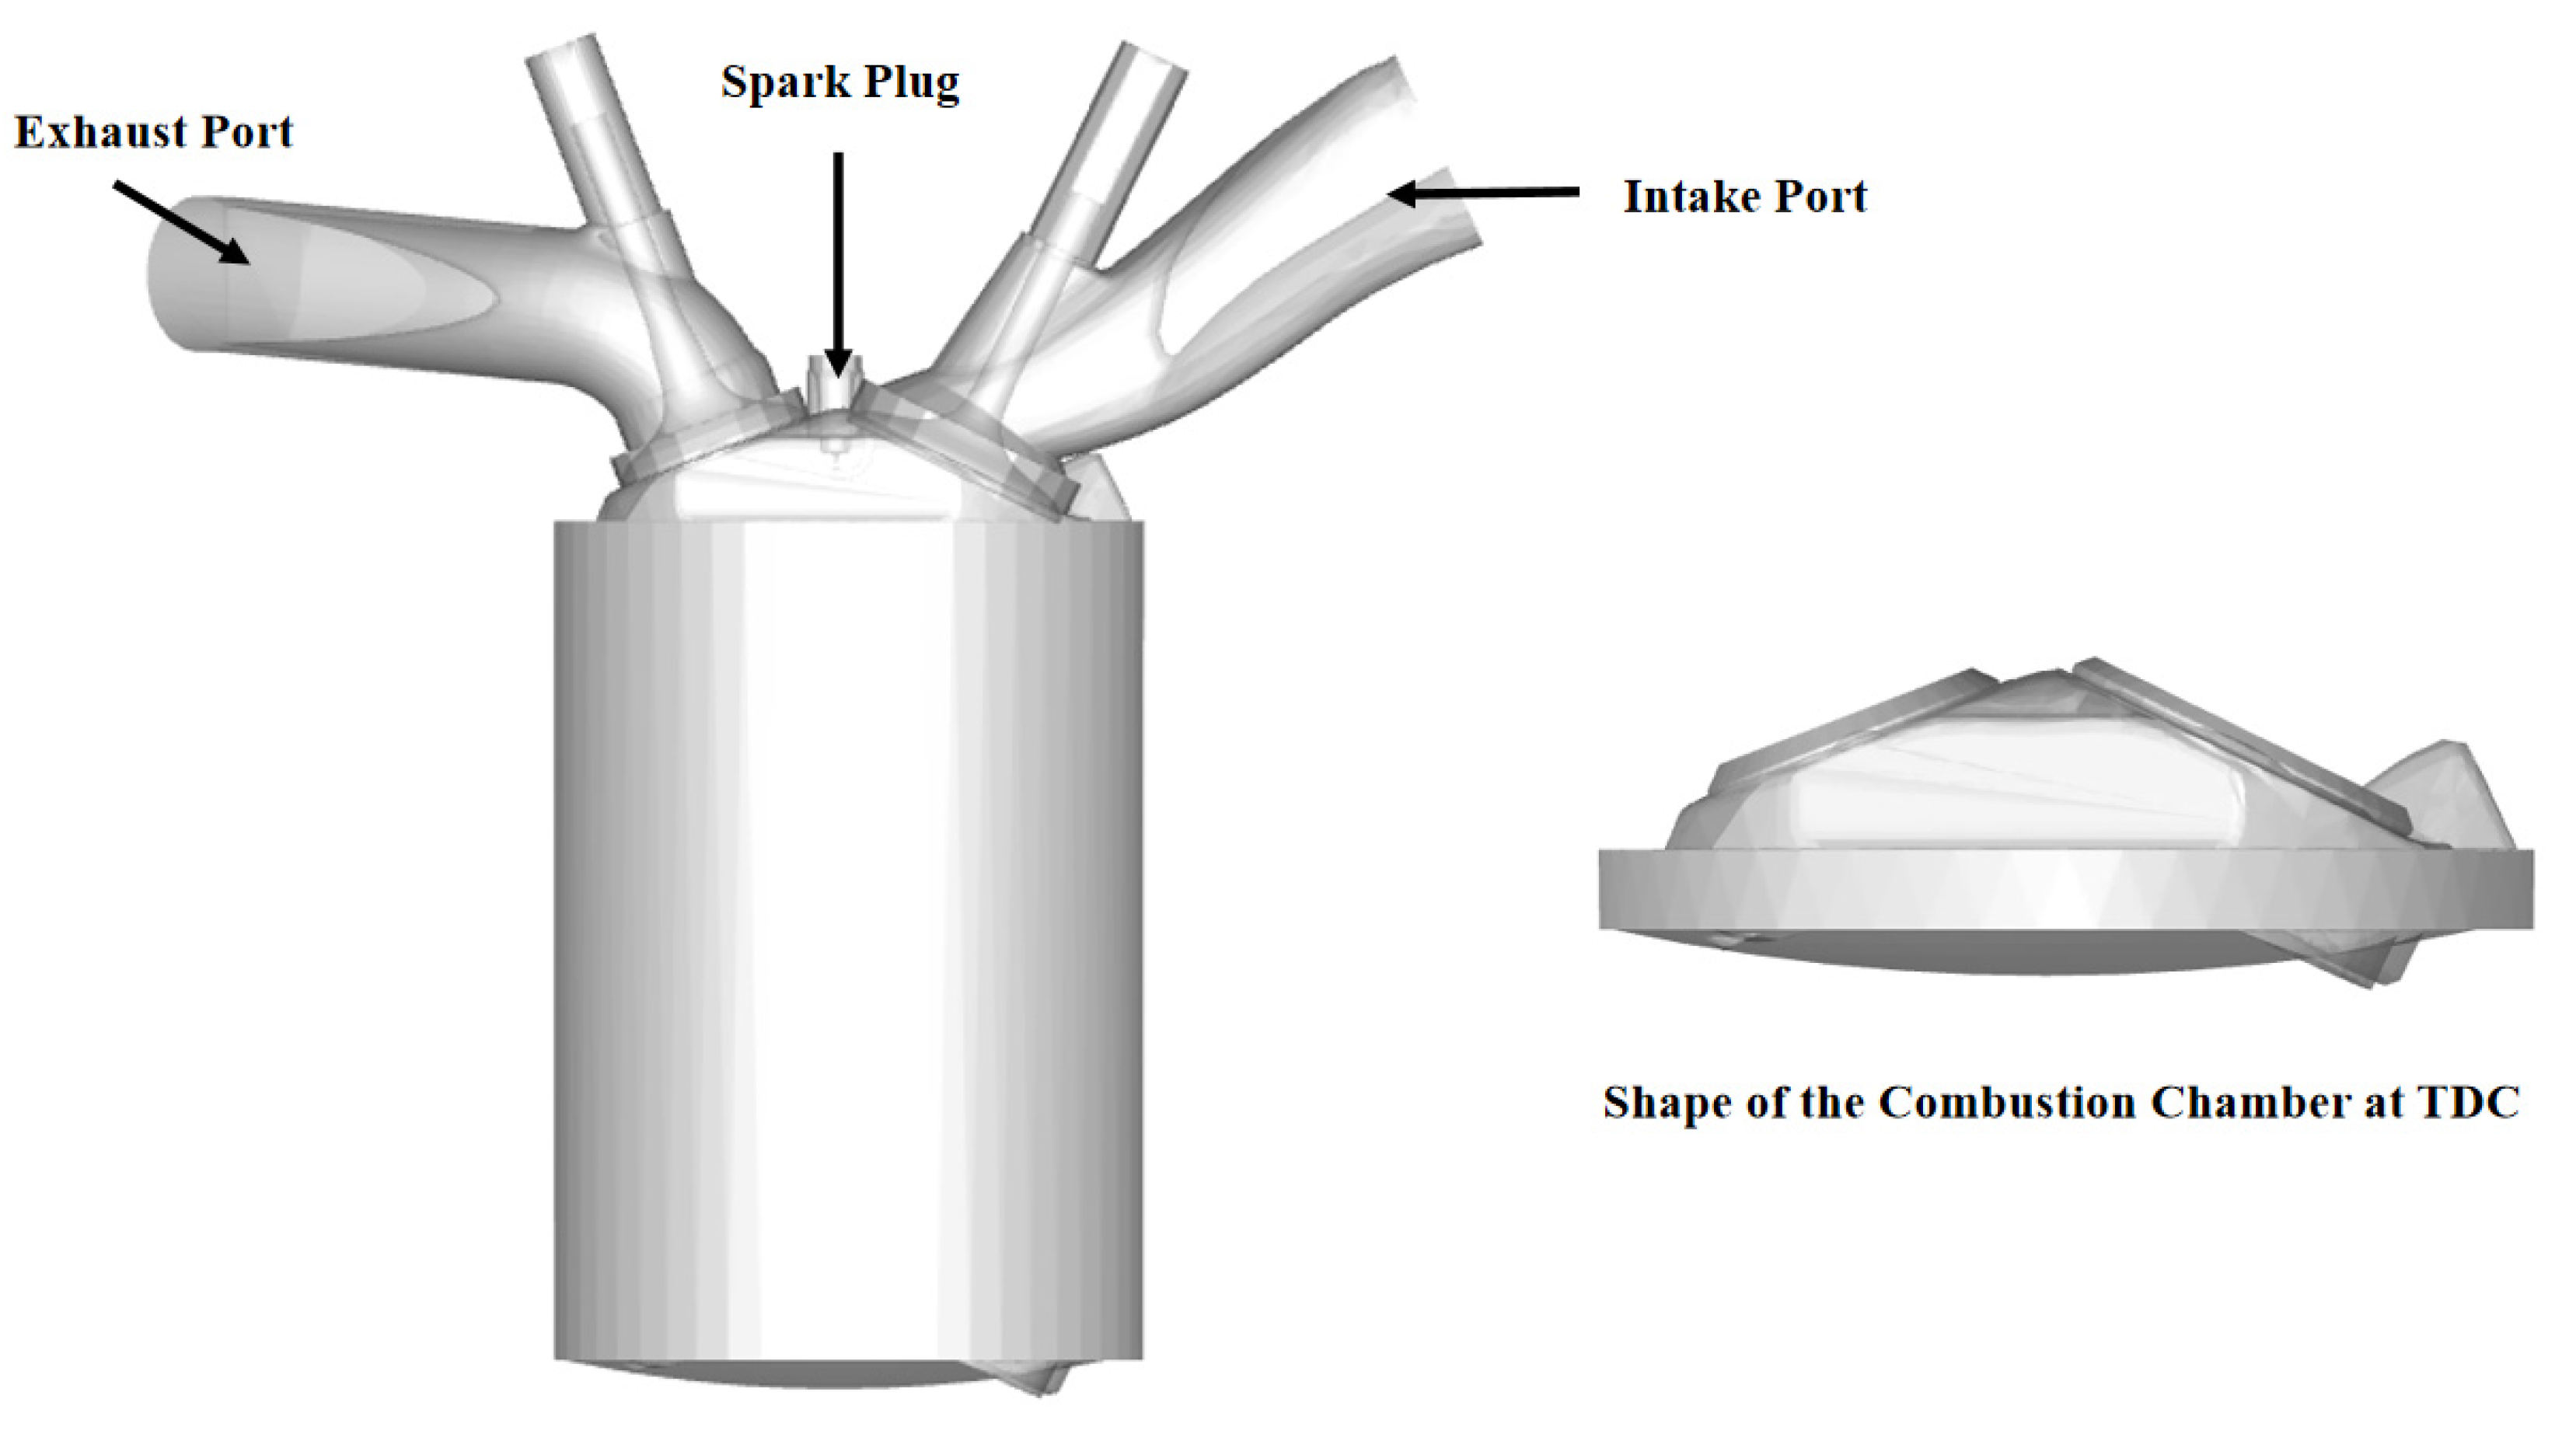
In this study, a three-dimensional computational fluid dynamics (CFD) computational domain model is established based on a four-stroke, four-valve direct-injection engine, and the numerical simulations are conducted using CONVERGE software. In the timing convention of the simulation, 720 °CA ATDC is defined as the top dead center (TDC) of the compression stroke. The single-cylinder displacement of the engine is 0.73 L, with a compression ratio of 12. The cylinder bore and piston stroke are 87 mm and 123 mm, respectively. The specific core technical parameters are detailed in Table 1.
| Parameters | Values |
|---|---|
| Engine Type | 4-stroke, 4-valve, direct injection |
| Number of cylinders | 4 |
| Bore × stroke | 87 mm × 123 mm |
| Compression ratio | 12 |
| Single Cylinder Displacement | 0.73 L |
| Number of nozzles | 6 |
| Nozzle hole diameter | 0.2 mm |
| Intake valve closing | 552 °CA ATDC |
| Exhaust valve opening | 869 °CA ATDC |
| Spark timing | 720 °CA ATDC |
| Fuel injection quality | 80 mg |
| Engine speed | 2000 rpm |
To further enhance the computational accuracy, adaptive mesh refinement (AMR) and fixed mesh refinement (FMR) methods are employed to effectively handle the large local velocity and temperature gradients during the combustion process. Specifically, a level-3 AMR is applied to the velocity and temperature fields within the cylinder region; a level-3 FMR is utilized in the intake and exhaust valve regions; a level-4 FMR is adopted in the spray region; and a level-5 FMR is implemented in the spark plug region (Figure 1).
Selecting appropriate physical and chemical models is crucial for ensuring the accuracy of combustion process simulations. Regarding the turbulence model, this study employs the Renormalization Group (RNG) k-ε turbulence model, which can effectively capture the flow characteristics in low Reynolds number regions and exhibits high accuracy and stability in complex shear flows and vortex scales [21]. In terms of droplet dynamics modeling, to accurately describe droplet collision behaviors and their interactions with the wall during the spray process, the NTC collision model [22] and the O’Rourke model [23] are utilized in combination. The droplet evaporation process is simulated using the Frossling evaporation model, which is based on mass and heat transfer theories and can effectively predict the evaporation rate of droplets under different temperature fields [24]. Meanwhile, the KH-RT model is adopted to simulate the spray breakup process, effectively capturing the primary and secondary breakup mechanisms [25]. For chemical reactions, the SAGE combustion model [26] is employed to simulate the in-cylinder combustion process. Specifically, the methanol oxidation process is modeled using the reaction kinetics mechanism proposed by Lindstedt and Meyer, which comprises 32 species and 167 reactions [27]. The submodels applied in this study are listed in Table 2.
| Submodel Category | Model |
|---|---|
| Turbulence model | RNG k-ε turbulence model |
| Droplet collision model | NTC collision model and O’Rourke model |
| Droplet evaporation model | Frossling evaporation model |
| Spray breakup model | KH-RT model |
| Combustion model | SAGE combustion model |
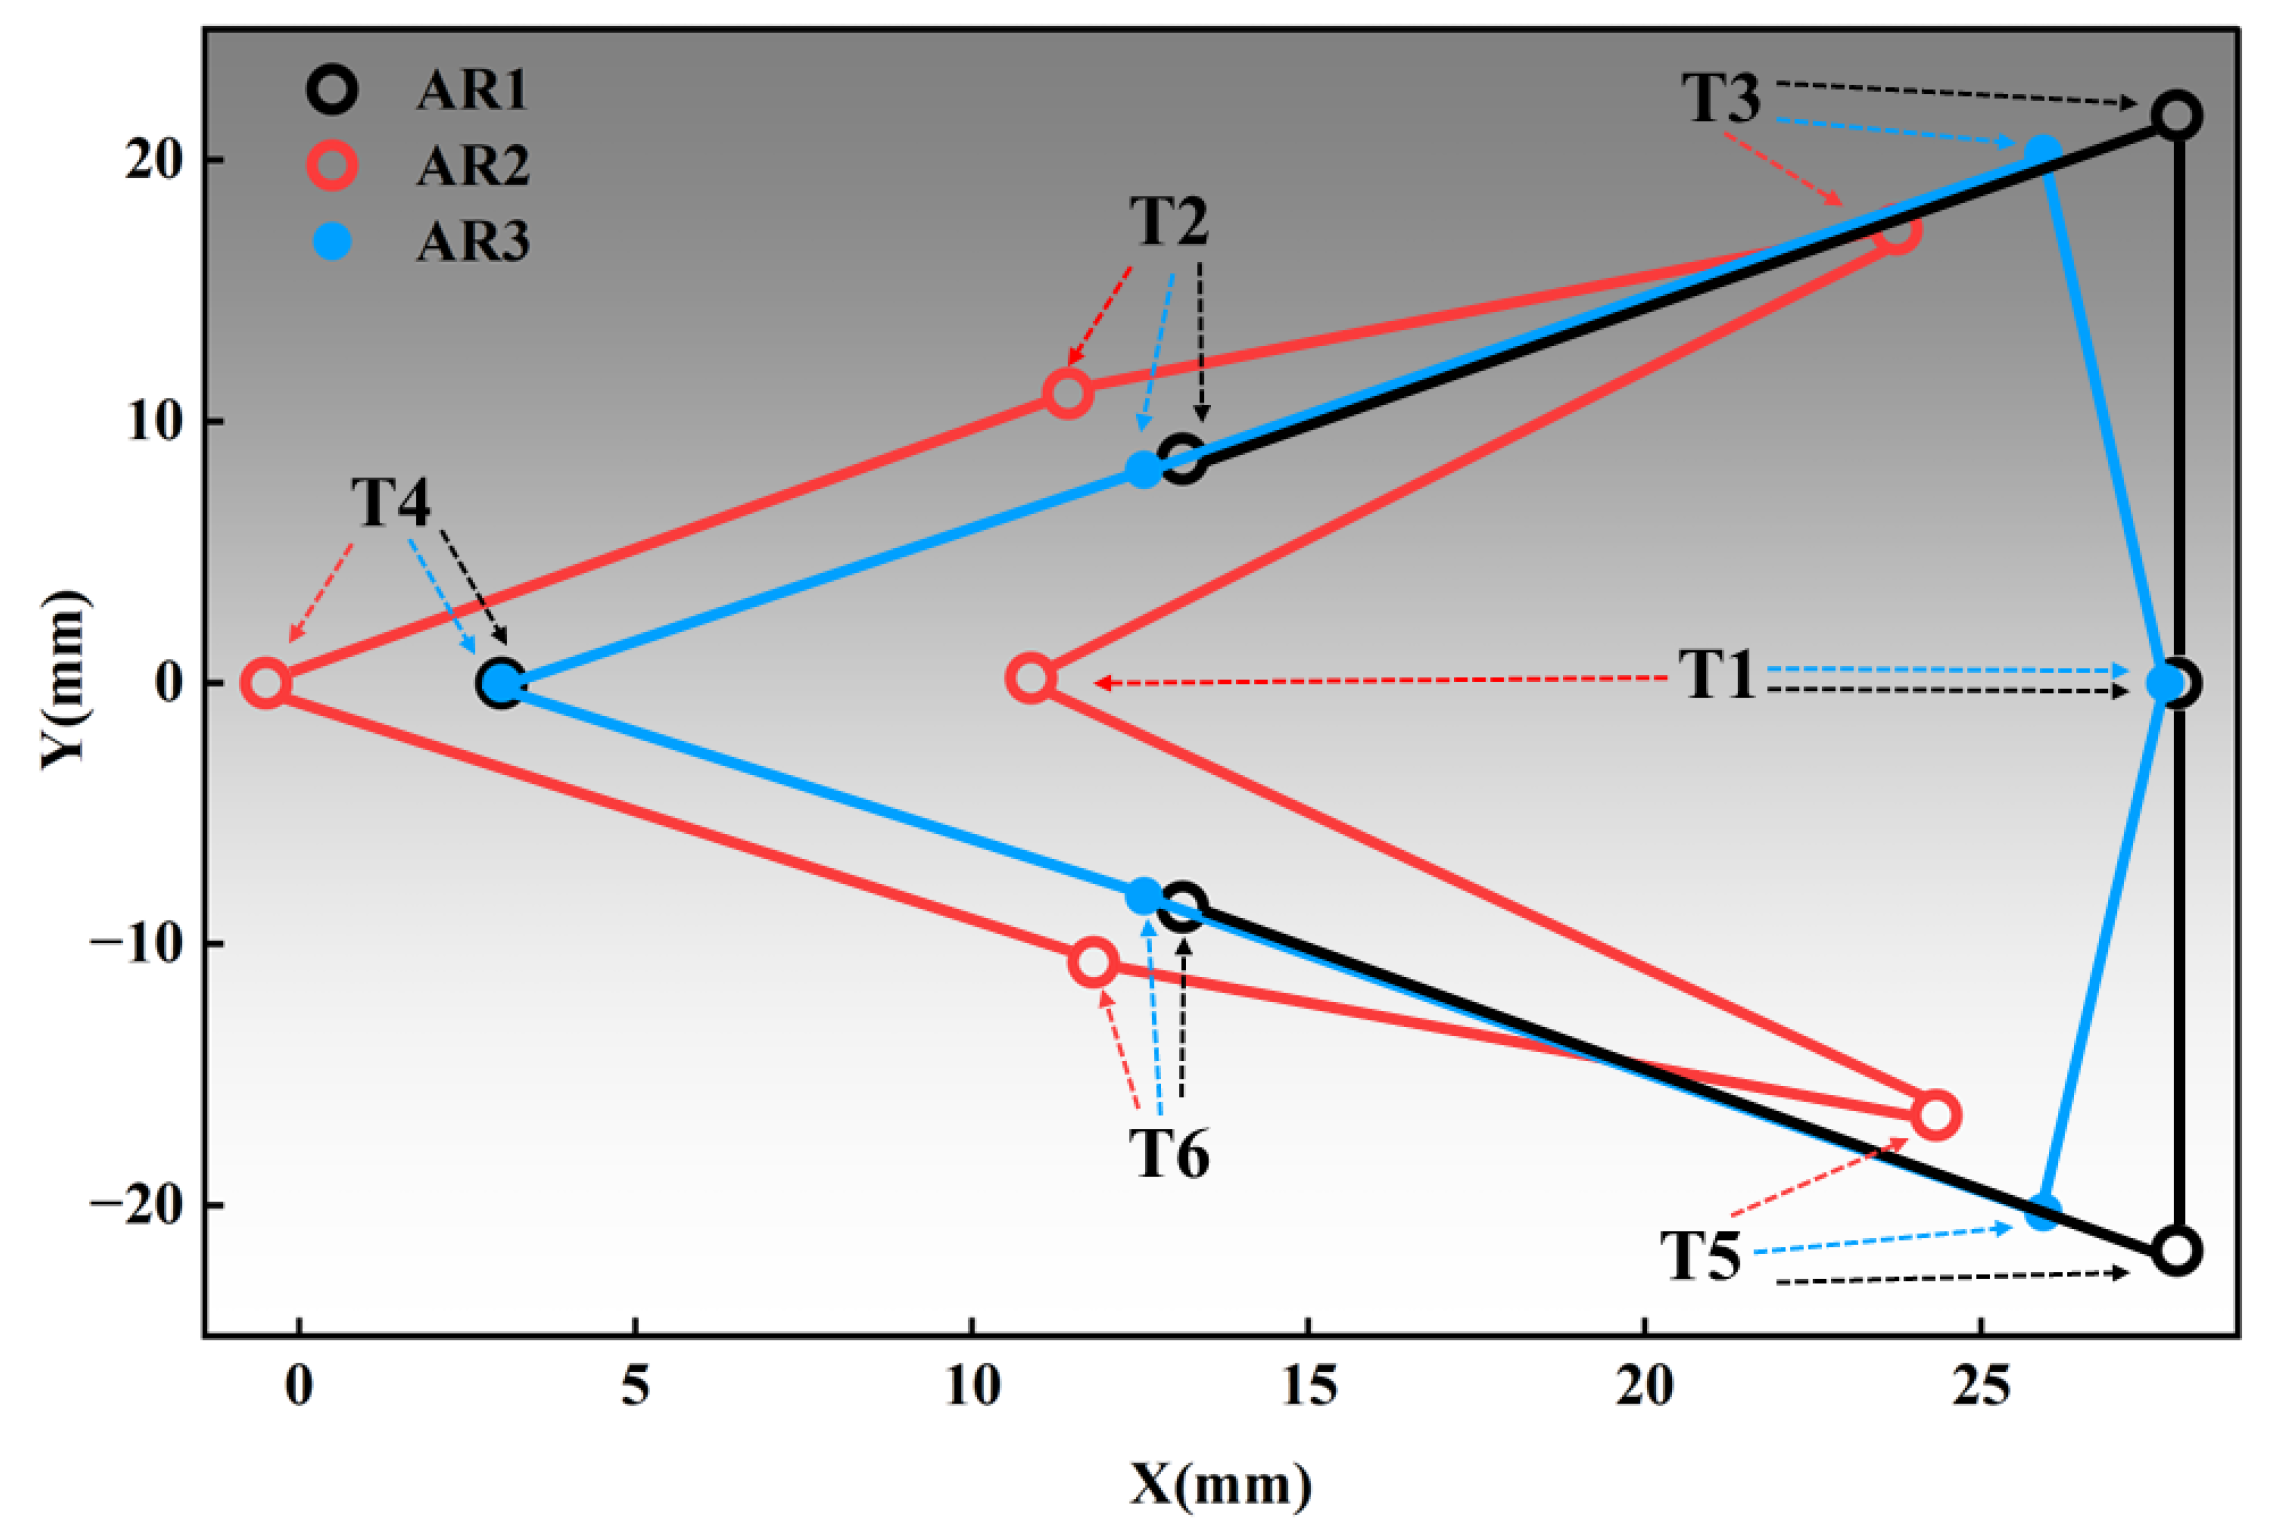
The fuel injection system of the target engine utilizes a 6-hole injector with an orifice diameter of 0.2 mm. To investigate the effects of spatial spray distribution on the in-cylinder flow field and air-fuel mixture formation, three different hole arrangement schemes (named AR1, AR2, and AR3, respectively) are designed in this study. The differences among these schemes are primarily reflected in the distribution of the target points (i.e., the intersections of the six spray plume centerlines on a plane 30 mm downstream from the nozzle tip), as shown in Figure 2. T1 to T6 denote the target points of the six injection holes, respectively, on the plane 30 mm downstream from the nozzle tip.
As intuitively observed in Figure 2, the geometric profiles of the target points for AR1 and AR3 are highly similar. Their target points for hole 4 and hole 1 almost overlap, and those for holes 2 and 6 are close to each other. The primary difference is that the target points of holes 3 and 5 in AR1 exhibit a wider spatial distribution. In contrast, the target points of AR2 shrink towards the central origin overall. The most significant change is that the target point of hole 1 falls into the same column interval as holes 2 and 6. This completely alters the structural characteristic observed in AR1 and AR3, where hole 1 was located in the outer column alongside holes 3 and 5.
2.2. Model Validation
In the numerical simulation process, the number of computational grids significantly impacts computational accuracy and solving efficiency. Therefore, while ensuring computational accuracy, it is necessary to reasonably select the grid size to balance computational cost and accuracy. To this end, a grid independence analysis is conducted by adjusting the base grid size. Five different base grid sizes—8 mm, 6 mm, 4.5 mm, 4 mm, and 3 mm—are employed in the calculations. The in-cylinder pressure results under different grid sizes are presented in Figure 3.
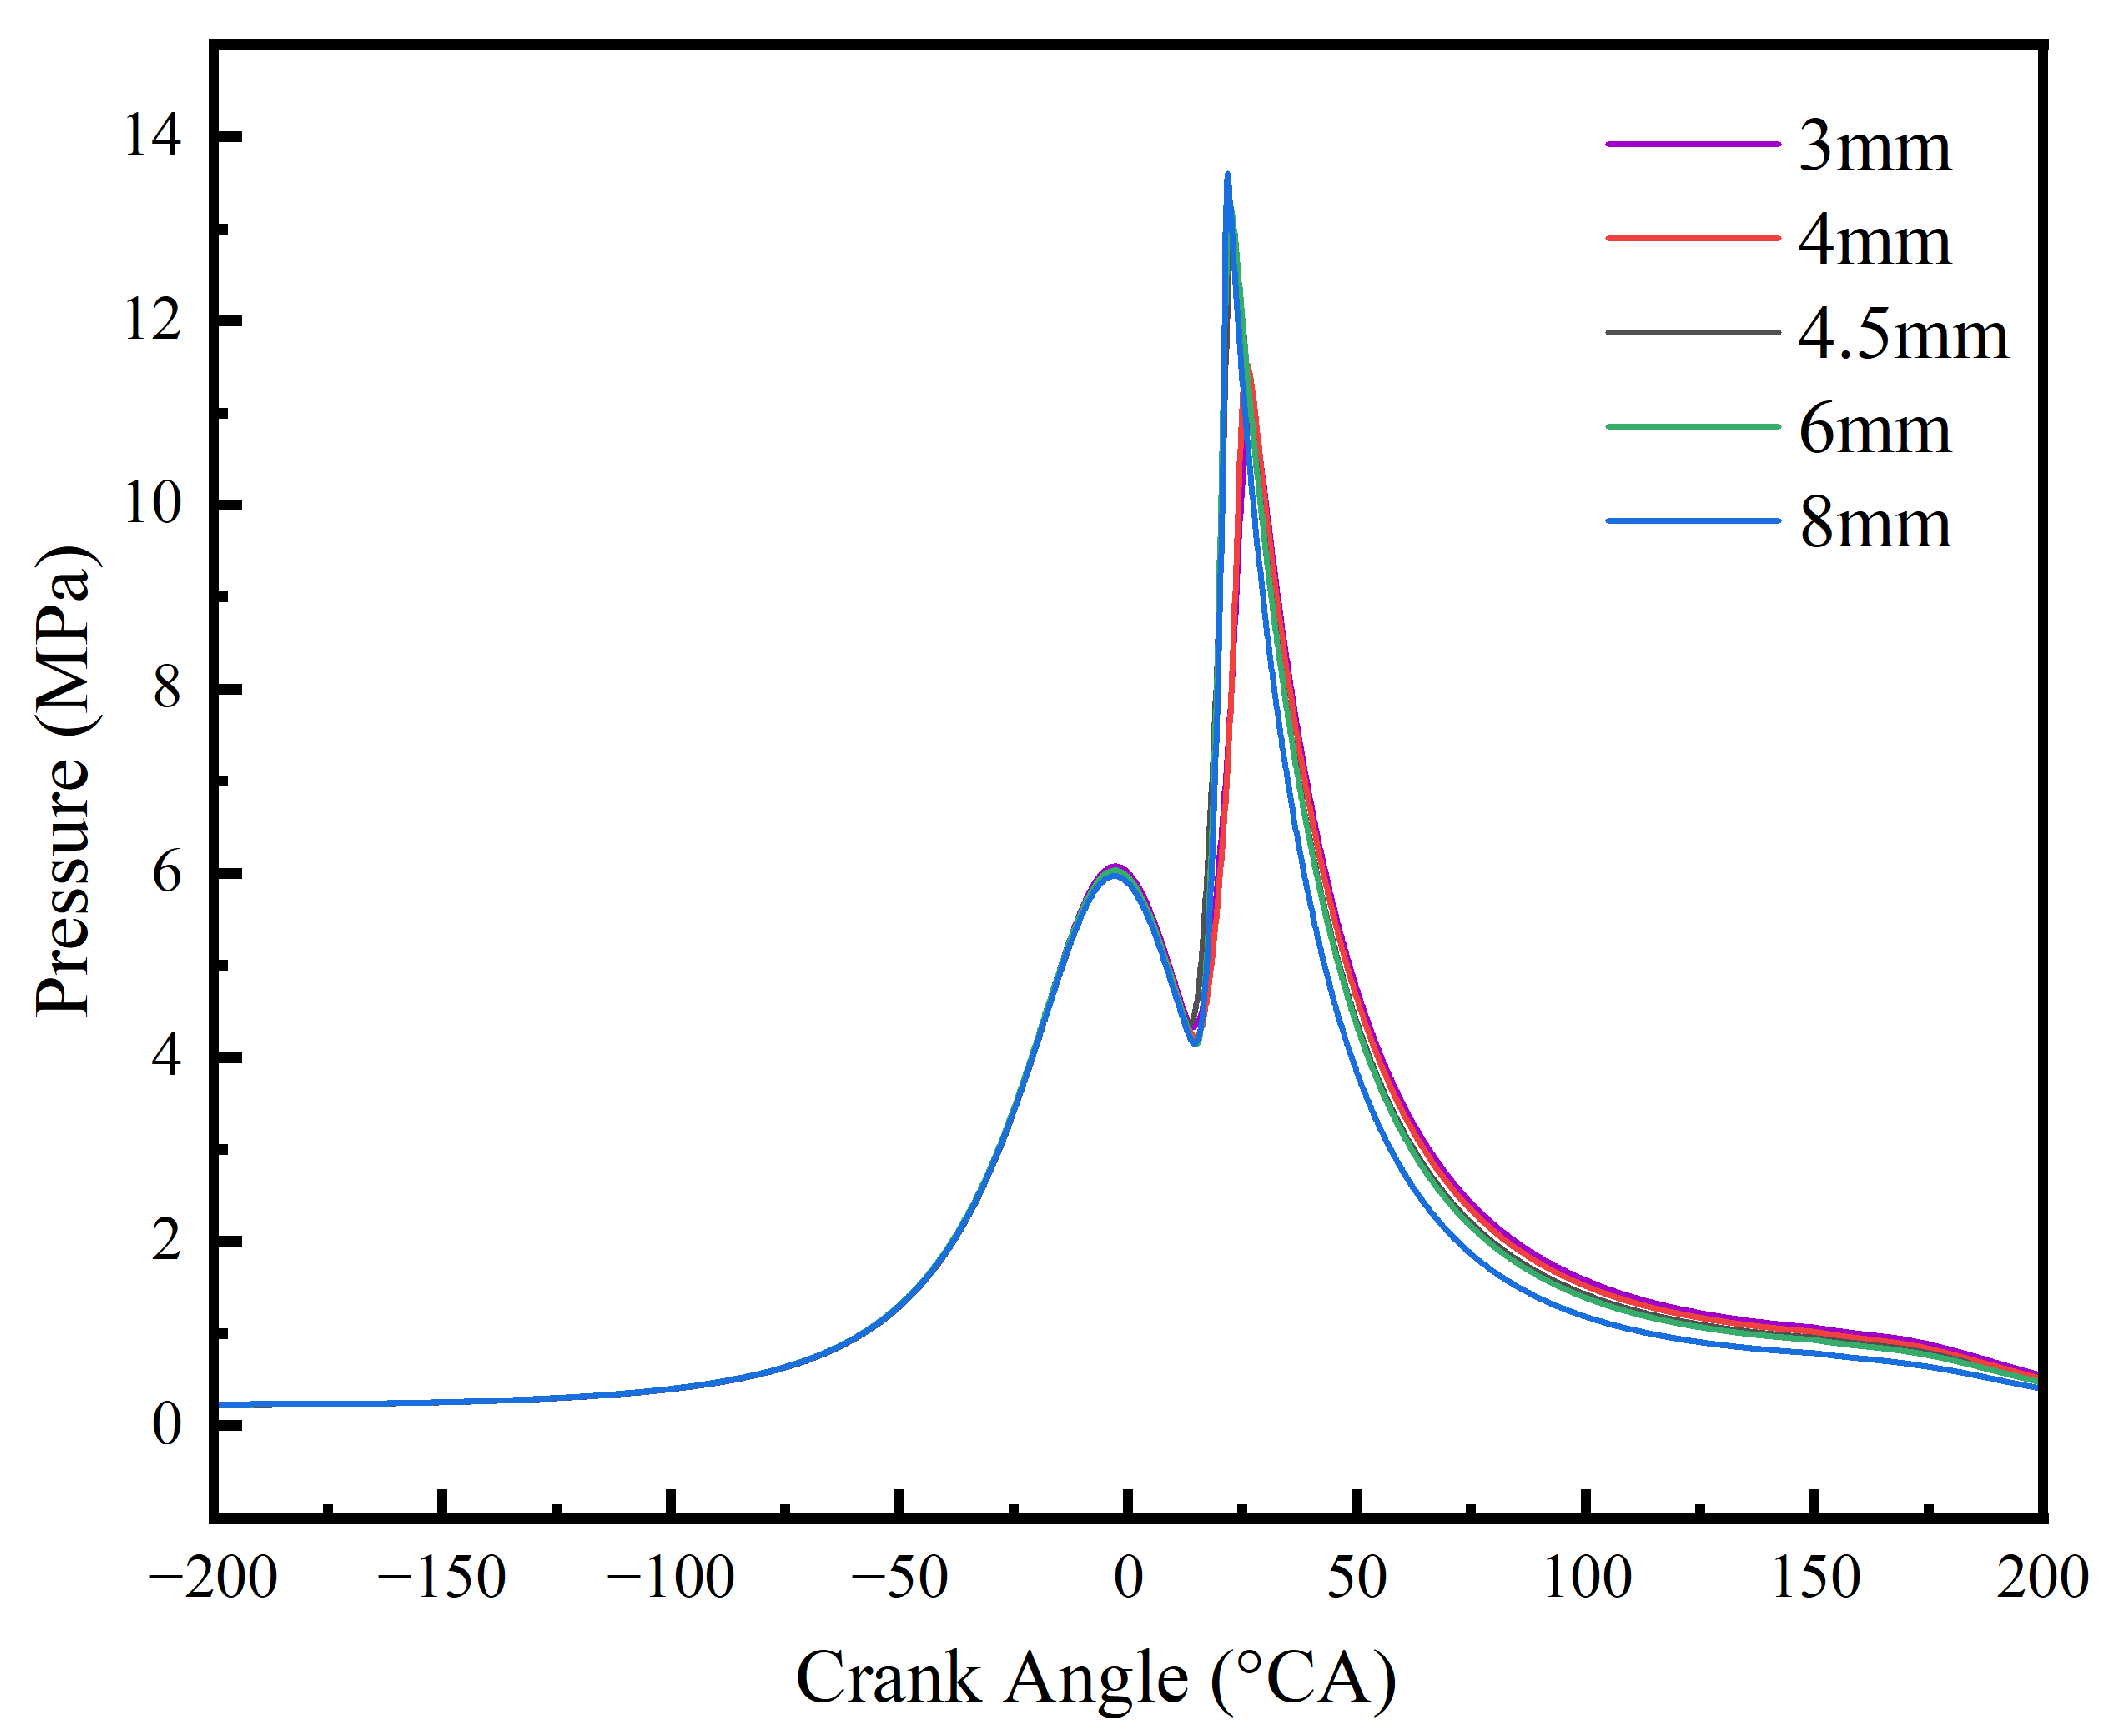
The results indicate that as the base grid size decreases, the calculation results under different grids gradually converge. The difference in the calculated in-cylinder pressure between the 4 mm and 3 mm grids is less than 5.0%. Considering both computational accuracy and efficiency, 4 mm is ultimately selected as the base grid size. Throughout the calculation process, the maximum number of grids is controlled within 2 million.
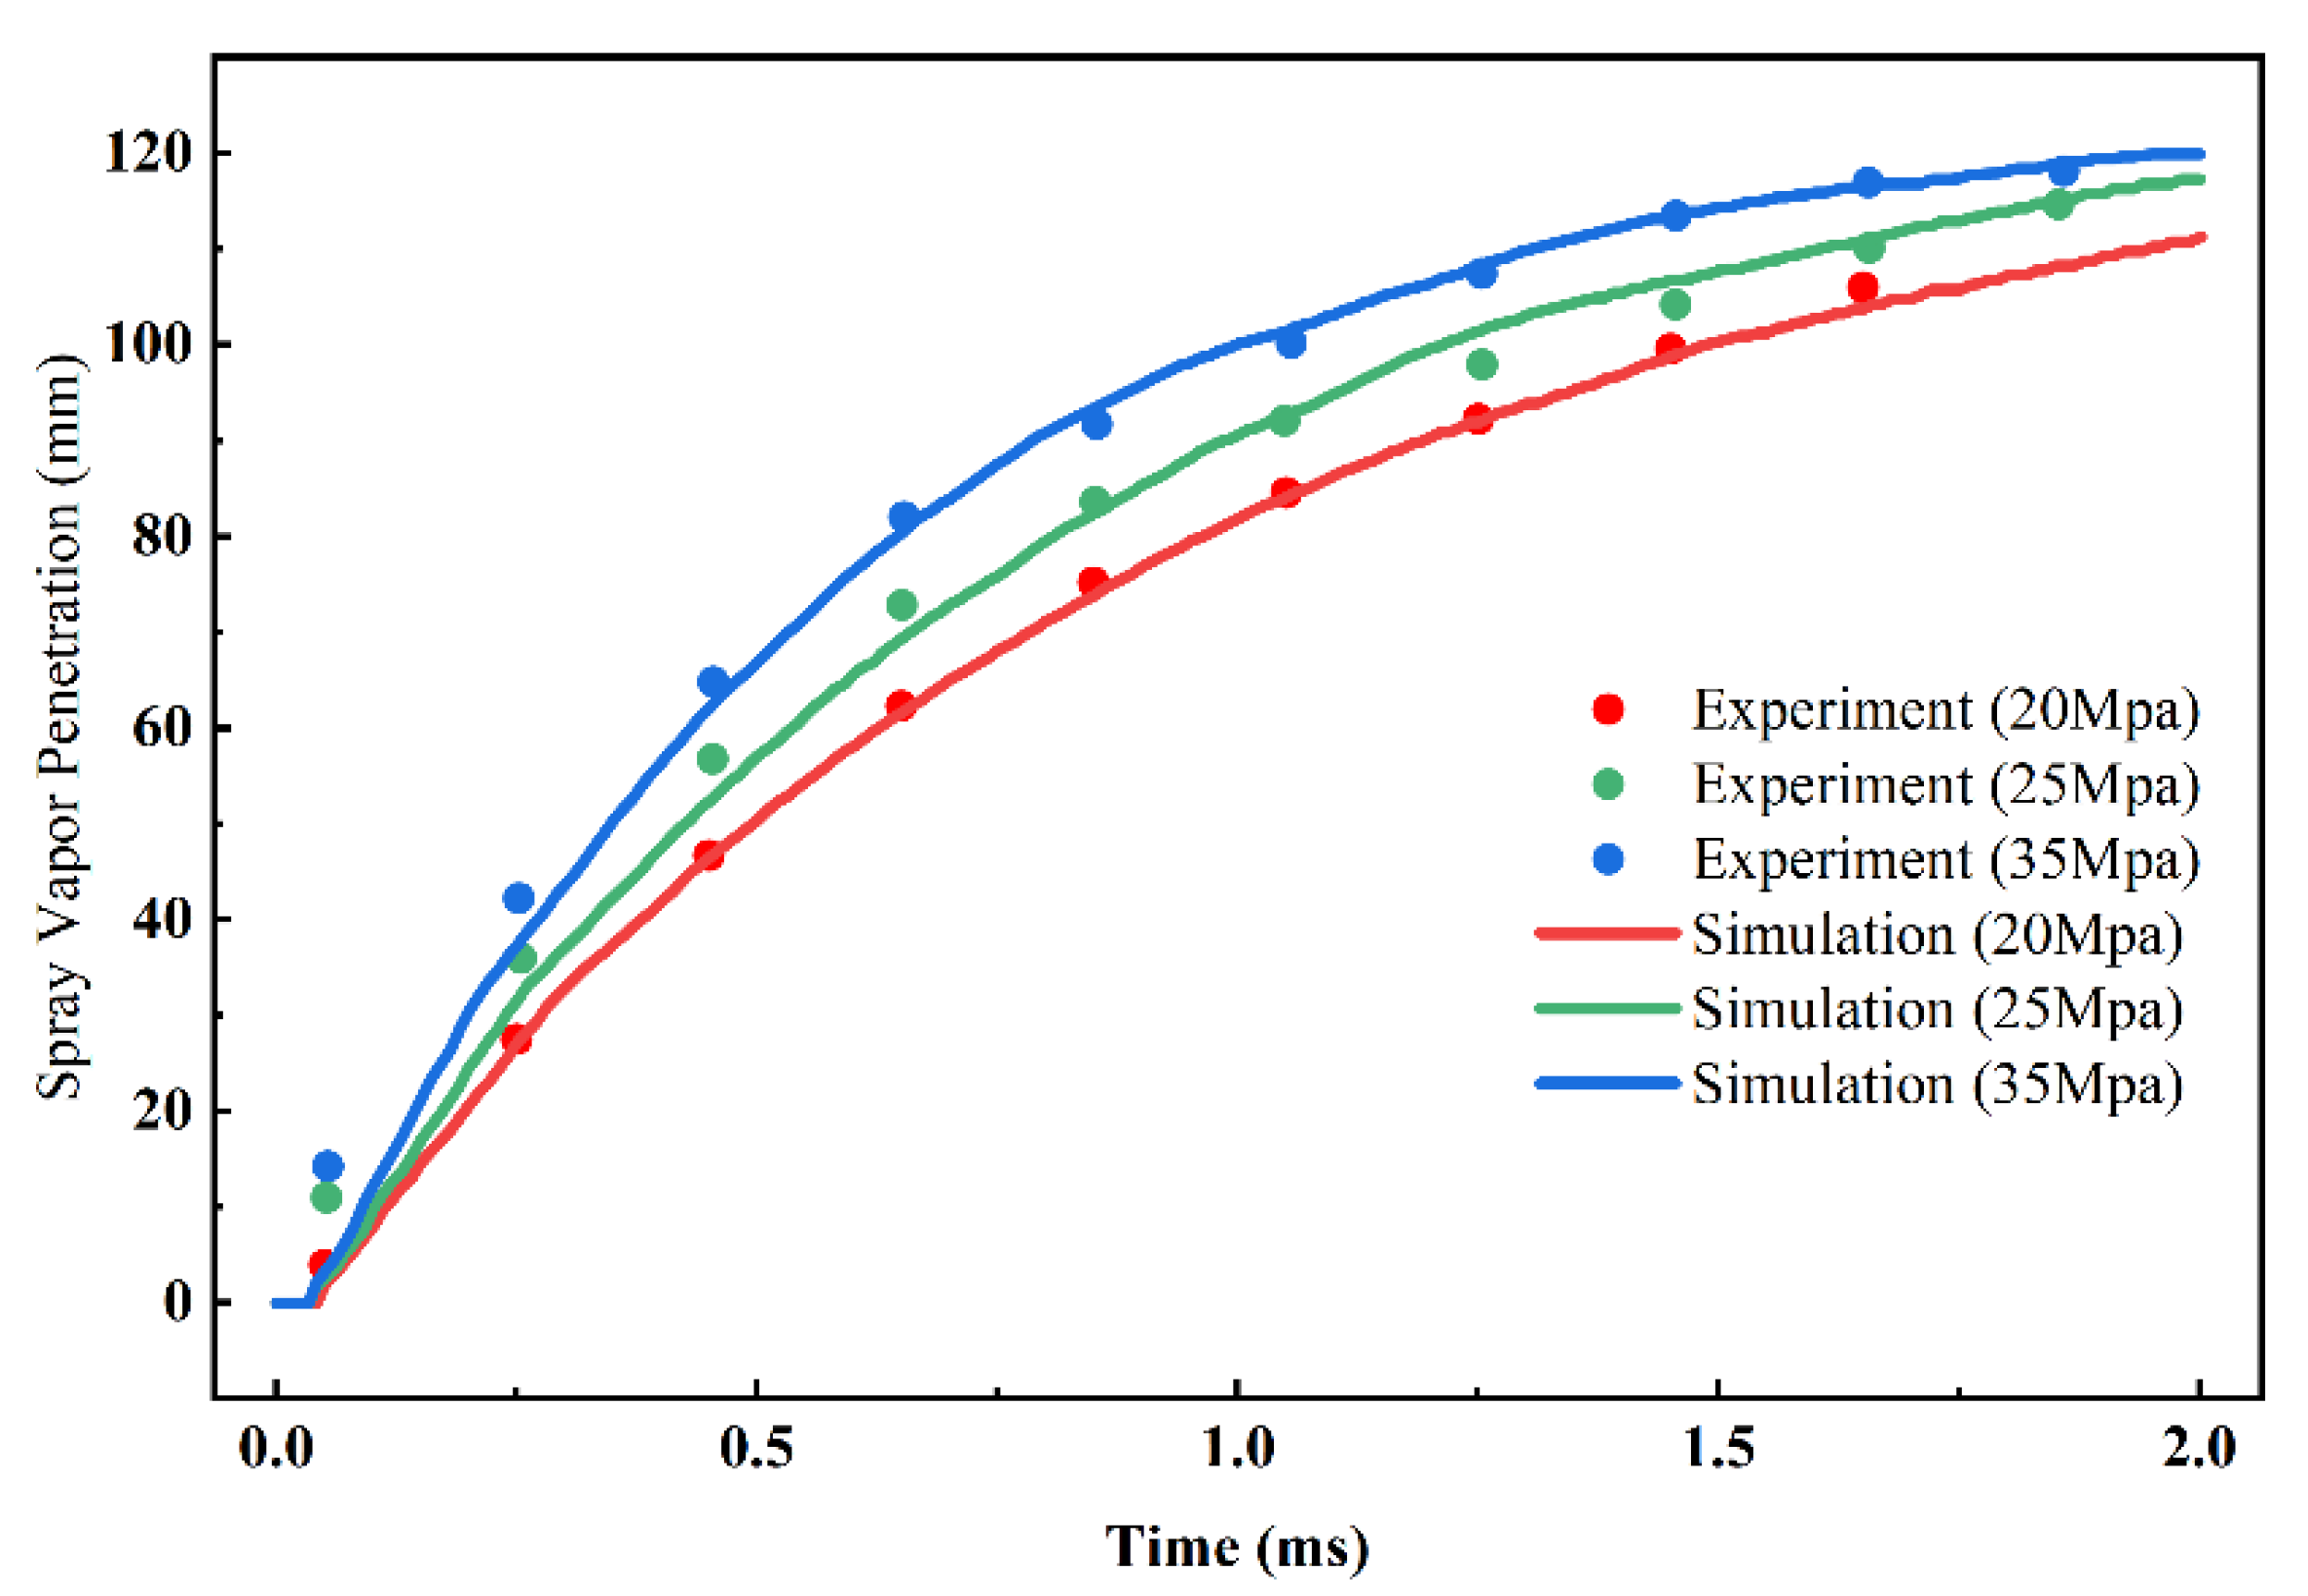
Figure 4 shows the variation trends of the experimental spray vapor penetration and the simulated spray vapor penetration over time under different injection pressures.
It can be seen from the figure that the trend of the simulated vapor penetration is consistent with the experimental measurements, matching well under injection pressures of 20 MPa and 35 MPa. At an injection pressure of 25 MPa, the simulated vapor penetration exhibits slight discrepancies in the early stage. The primary reasons for these early-stage errors are that the initial conditions and injection rate profile in the spray simulation are set based on assumptions and empirical values, leading to certain deviations; moreover, measurement errors in the experiments are inevitable.
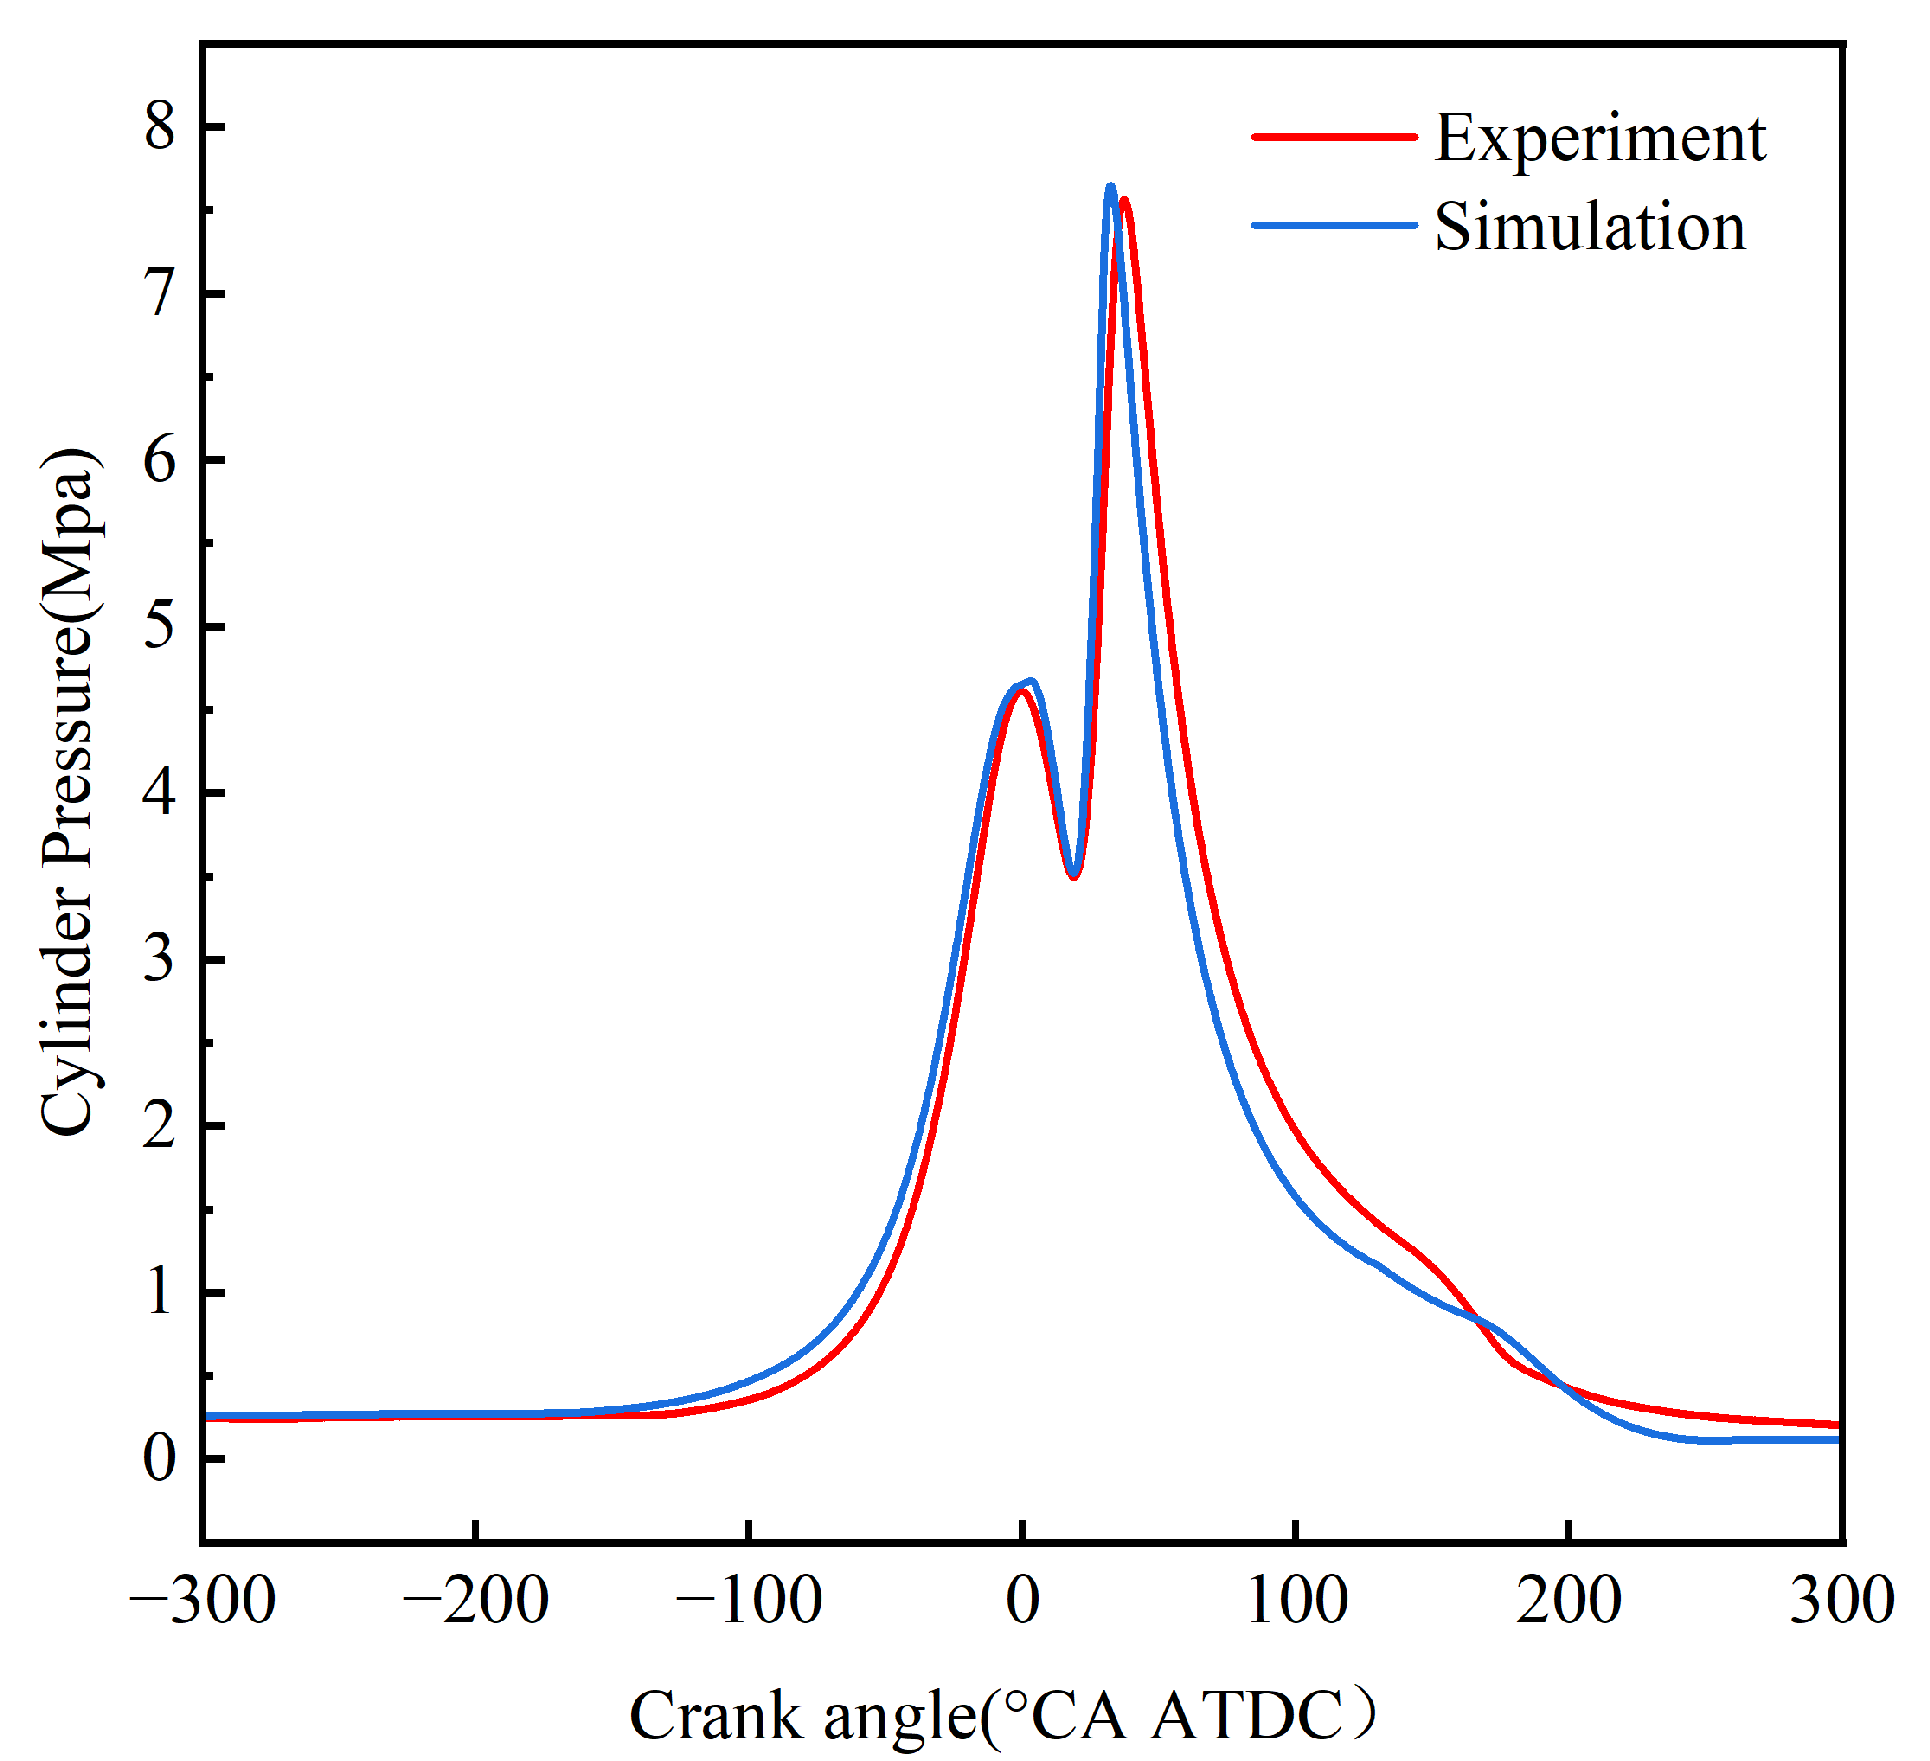
The reliability of the numerical simulation is validated by comparing the experimental and simulated in-cylinder pressure results. As shown in Figure 5, the calculated cylinder pressure from the numerical simulation agrees well with the experimental results, with a maximum error of less than 5%.
3. Results and Discussion
3.1. Effect of Nozzle Hole Arrangement on Engine Cylinder Pressure
Figure 6 presents the effects of the three different hole arrangement schemes (AR1, AR2, and AR3) on the in-cylinder pressure under the same early injection strategy (420 °CA–450 °CA ATDC). During the main heat release phase, the AR2 scheme not only achieves the highest peak cylinder pressure (6.06 MPa), but its peak timing (733.8 °CA) also appears significantly earlier than those of AR3 (5.73 MPa, 735.3 °CA) and AR1 (5.60 MPa, 736.0 °CA). However, it is worth noting that before the ignition timing, the cylinder pressure curve of AR2 remains consistently lower than those of AR1 and AR3. This pressure retardation phenomenon is closely related to the extremely high latent heat of vaporization of methanol fuel and the liquid film distribution within the cylinder. Because the overall spray of AR2 shifts, a large amount of fuel fails to impinge on the high-temperature piston crown like AR1 and AR3, but instead adheres to the relatively lower-temperature cylinder liner surface. The lower wall temperature of the cylinder liner severely limits the evaporation rate of the methanol liquid film. This severe evaporation retardation significantly reduces the generation of gaseous methanol participating in the compression, directly decreasing the total number of moles of the in-cylinder mixture before ignition. According to the ideal gas law, under the same compression volume, the decrease in the number of moles of the working fluid is macroscopically manifested as a lower pre-ignition cylinder pressure for AR2. In contrast, the spray plumes of AR1 and AR3 mainly fall into the piston crown region. Heated by the high temperature of the piston, the fuel vaporizes sufficiently, thus maintaining a higher cylinder pressure level before ignition.
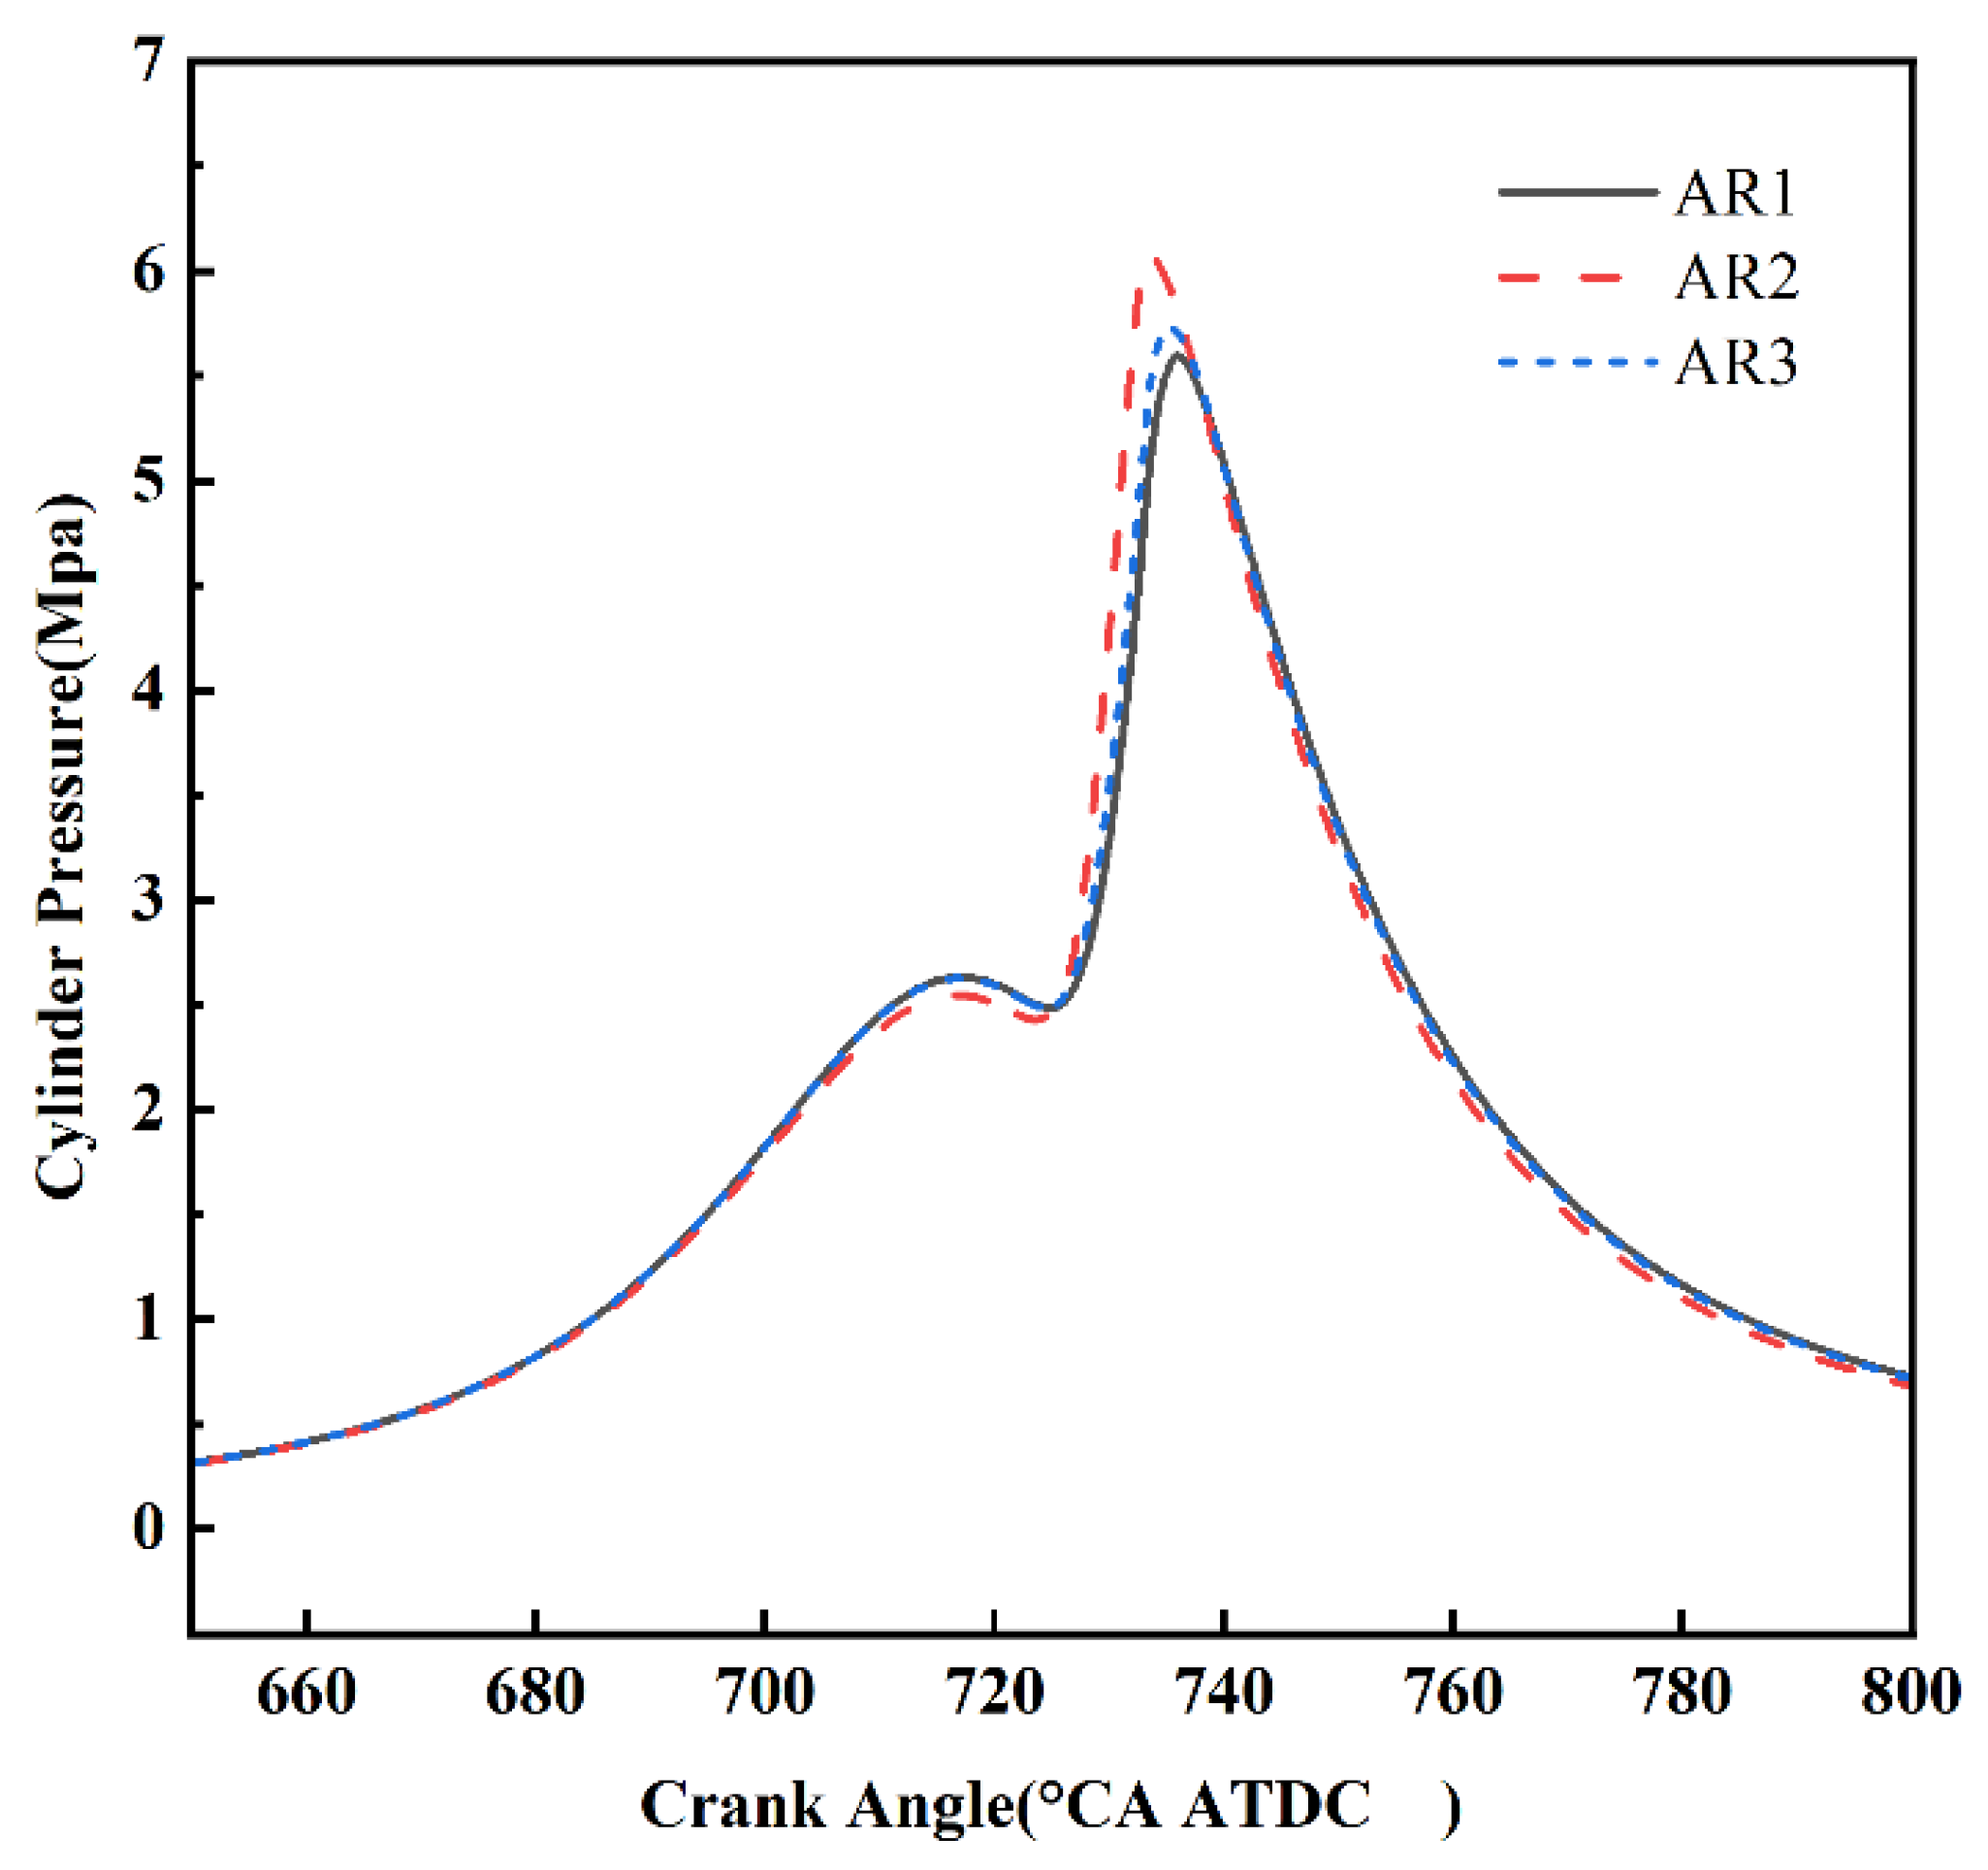
To further reveal the microscopic mechanism of the cylinder pressure evolution after ignition, Figure 7 extracts the spatial distribution slice of the equivalence ratio (ER) near the spark plug at the ignition timing. The local mixture state at the ignition timing directly determines the formation quality of the early flame kernel and the propagation rate of the subsequent flame front. As can be observed from Figure 7, AR2 forms a highly symmetrical equivalence ratio distribution field around the spark plug, which is highly suitable for methanol ignition, and it exhibits excellent spatial concentration stratification characteristics. This ideal local mixture state promotes the stable ignition and rapid development of the early flame kernel, resulting in an extremely high pressure rise rate. Therefore, AR2 reaches a higher peak cylinder pressure at an earlier crank angle compared to AR1 and AR3.
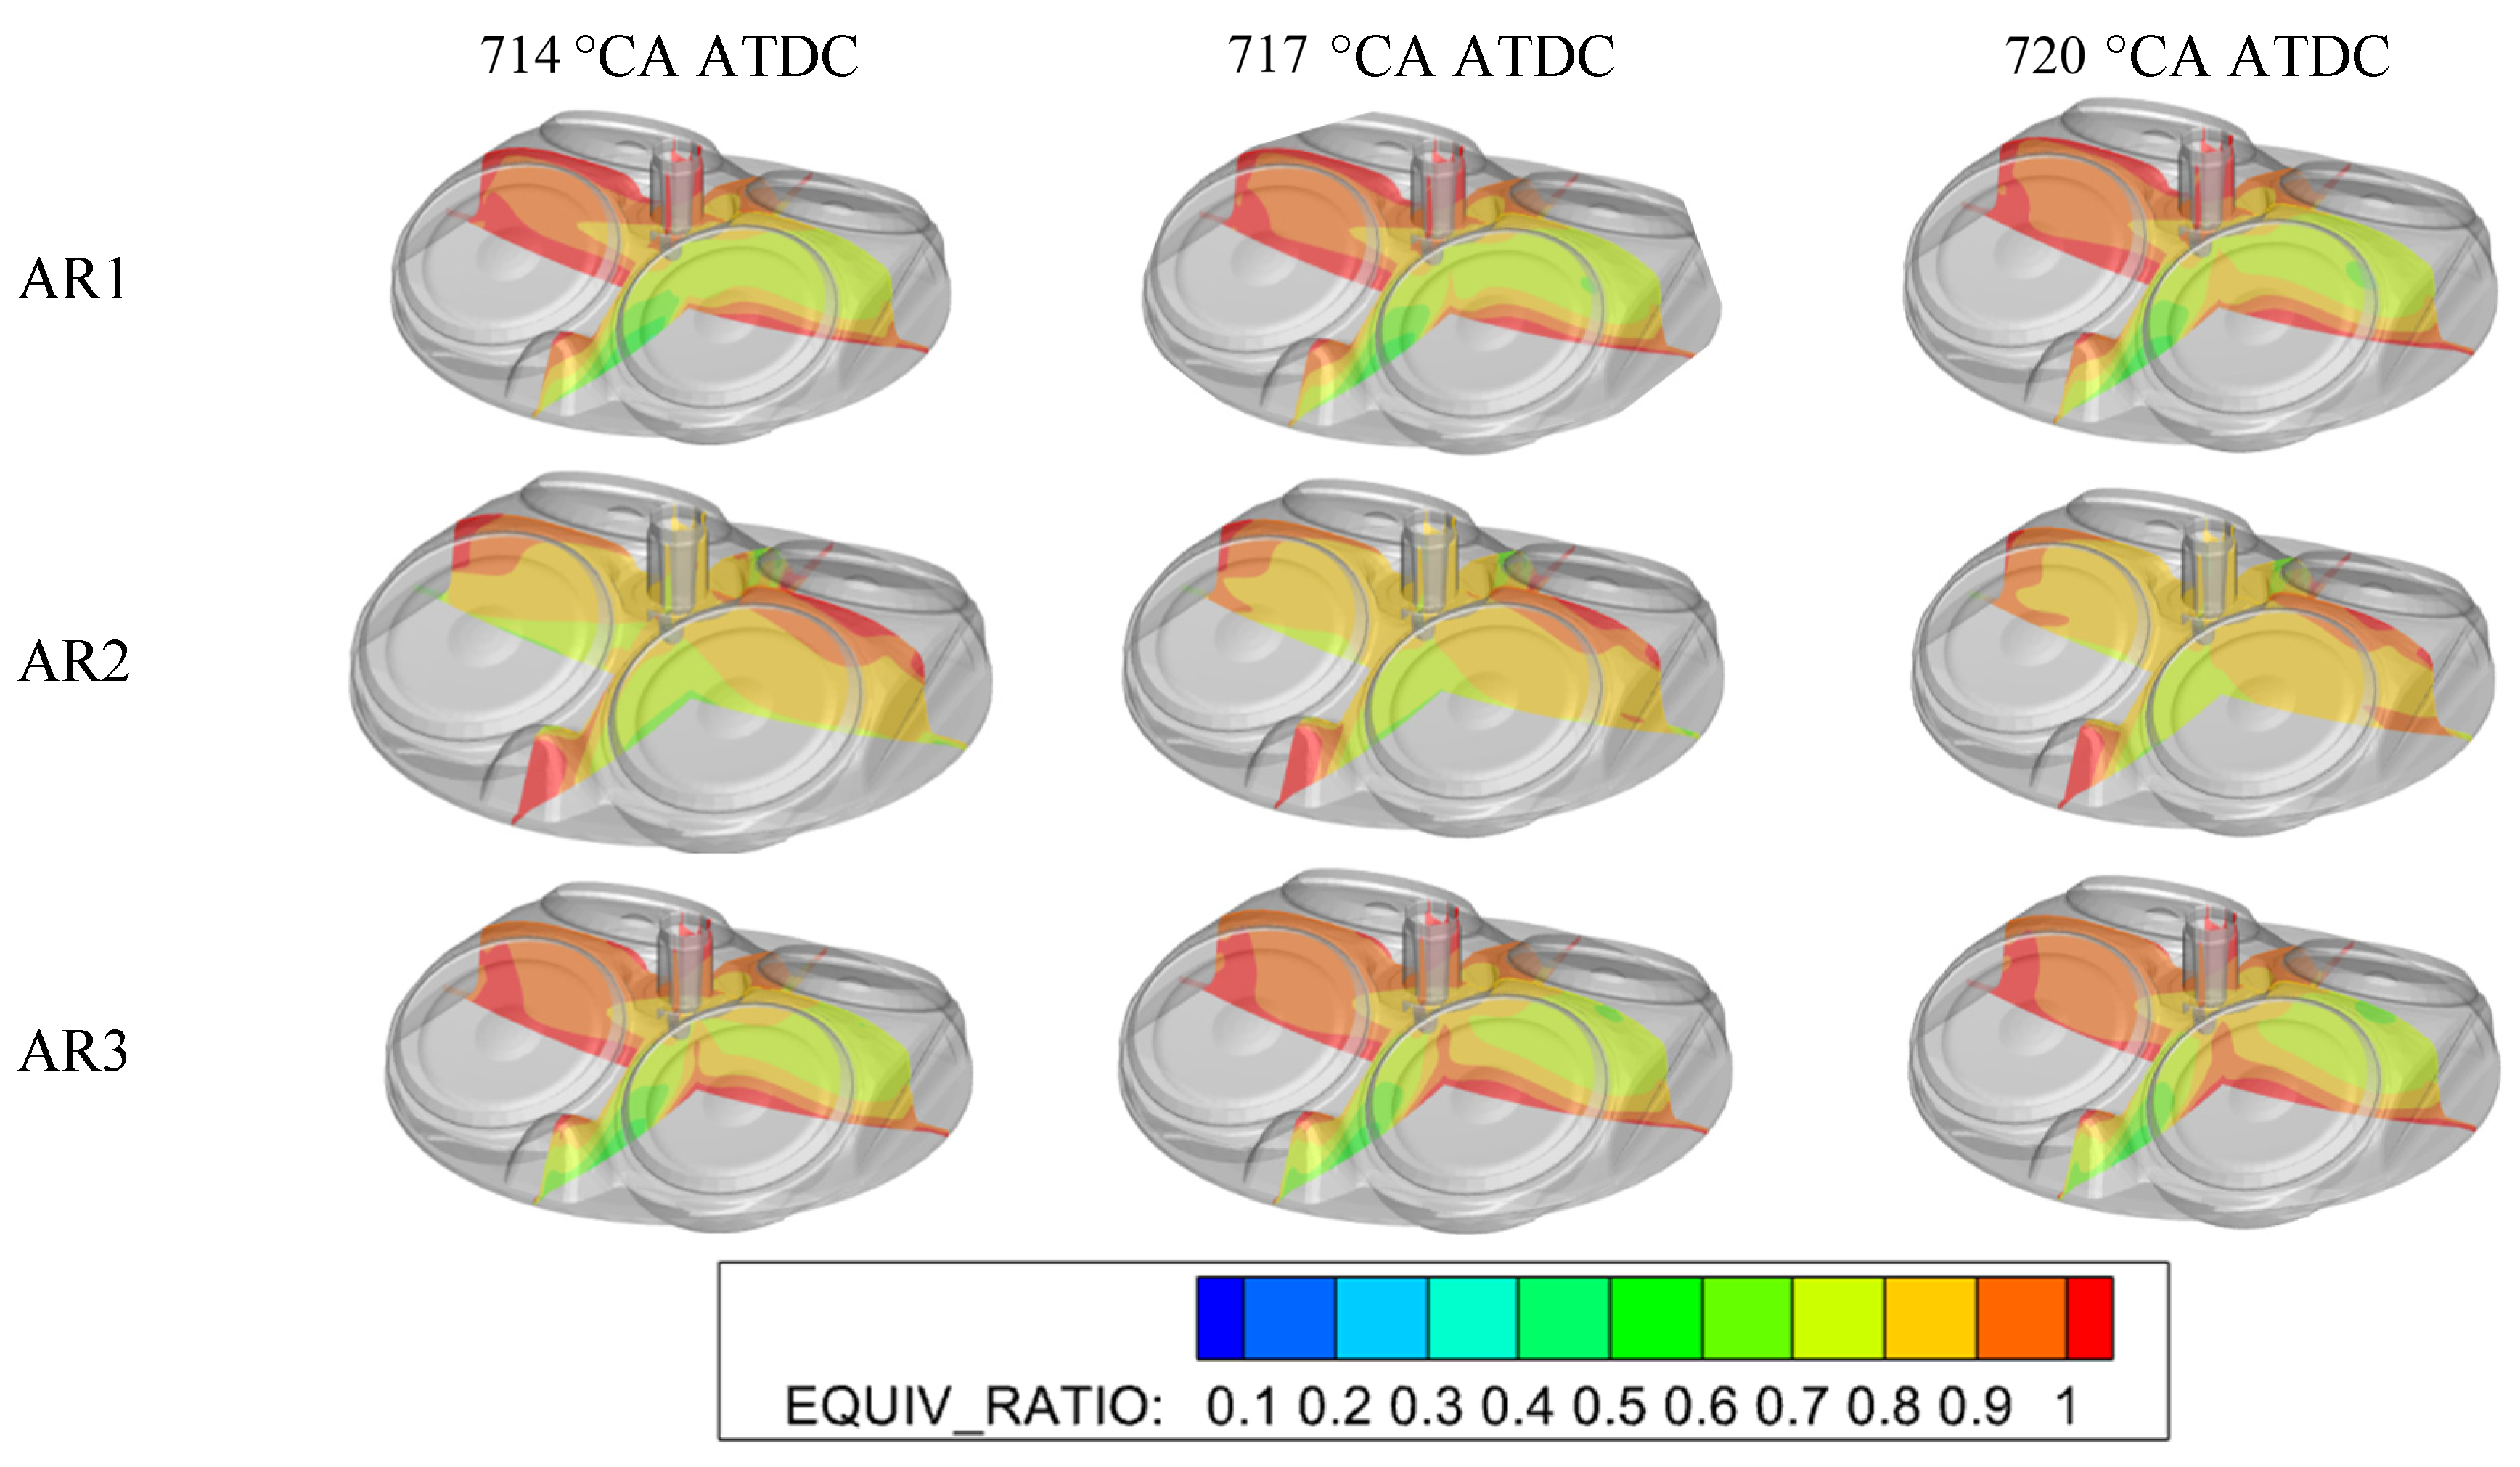
On the other hand, comparing AR1 and AR3 reveals that the target point designs of both lead to a significant asymmetric distribution of the equivalence ratio field around the spark plug. This spatial concentration gradient imbalance hinders the initial propagation of the flame front, causing the combustion rates of both to be slower, and their peak cylinder pressures to be lower and later than that of AR2. Between the two, however, the target points of holes 3 and 5 in AR3 are retracted inward compared to AR1, making the local mixture distribution around the spark plug in AR3 slightly more compact. This microstructural convergence makes the local flame propagation speed of AR3 slightly faster than that of the overly divergent AR1, thereby allowing AR3 to achieve a higher and slightly advanced peak cylinder pressure than AR1.
It should be noted that although the global pre-ignition cylinder pressure of AR2 is relatively lower, this macroscopic phenomenon does not adversely affect its ignition stability. As illustrated in the equivalence ratio distribution near the spark plug (Figure 7), the design of AR2 ensures sufficient vaporization in the local vicinity of the spark plug gap prior to ignition. This ideal local mixture stratification promotes the rapid formation and expansion of the early flame kernel. Consequently, as shown in the combustion phasing analysis (Section 3.3), AR2 achieves the earliest CA5 (726.1 °CA) among the three schemes, indicating that the early-stage flame propagation is enhanced rather than impeded by its specific spray distribution.
3.2. Effect of Nozzle Hole Arrangement on In-Cylinder Temperature
Figure 8 illustrates the variation of the mean in-cylinder temperature versus crank angle under the three different hole arrangements. The in-cylinder temperature is significantly influenced by the hole arrangement. The peak mean in-cylinder temperature of the AR2 scheme reaches 2394.7 K, which is notably higher than those of AR3 (2341.7 K) and AR1 (2332.9 K). This extremely high temperature peak reflects that AR2 possesses an exceptionally intense combustion rate during the main heat release phase. In contrast, the maximum temperatures of AR1 and AR3 are controlled at approximately 2340 K, indicating a more moderate combustion heat release process.
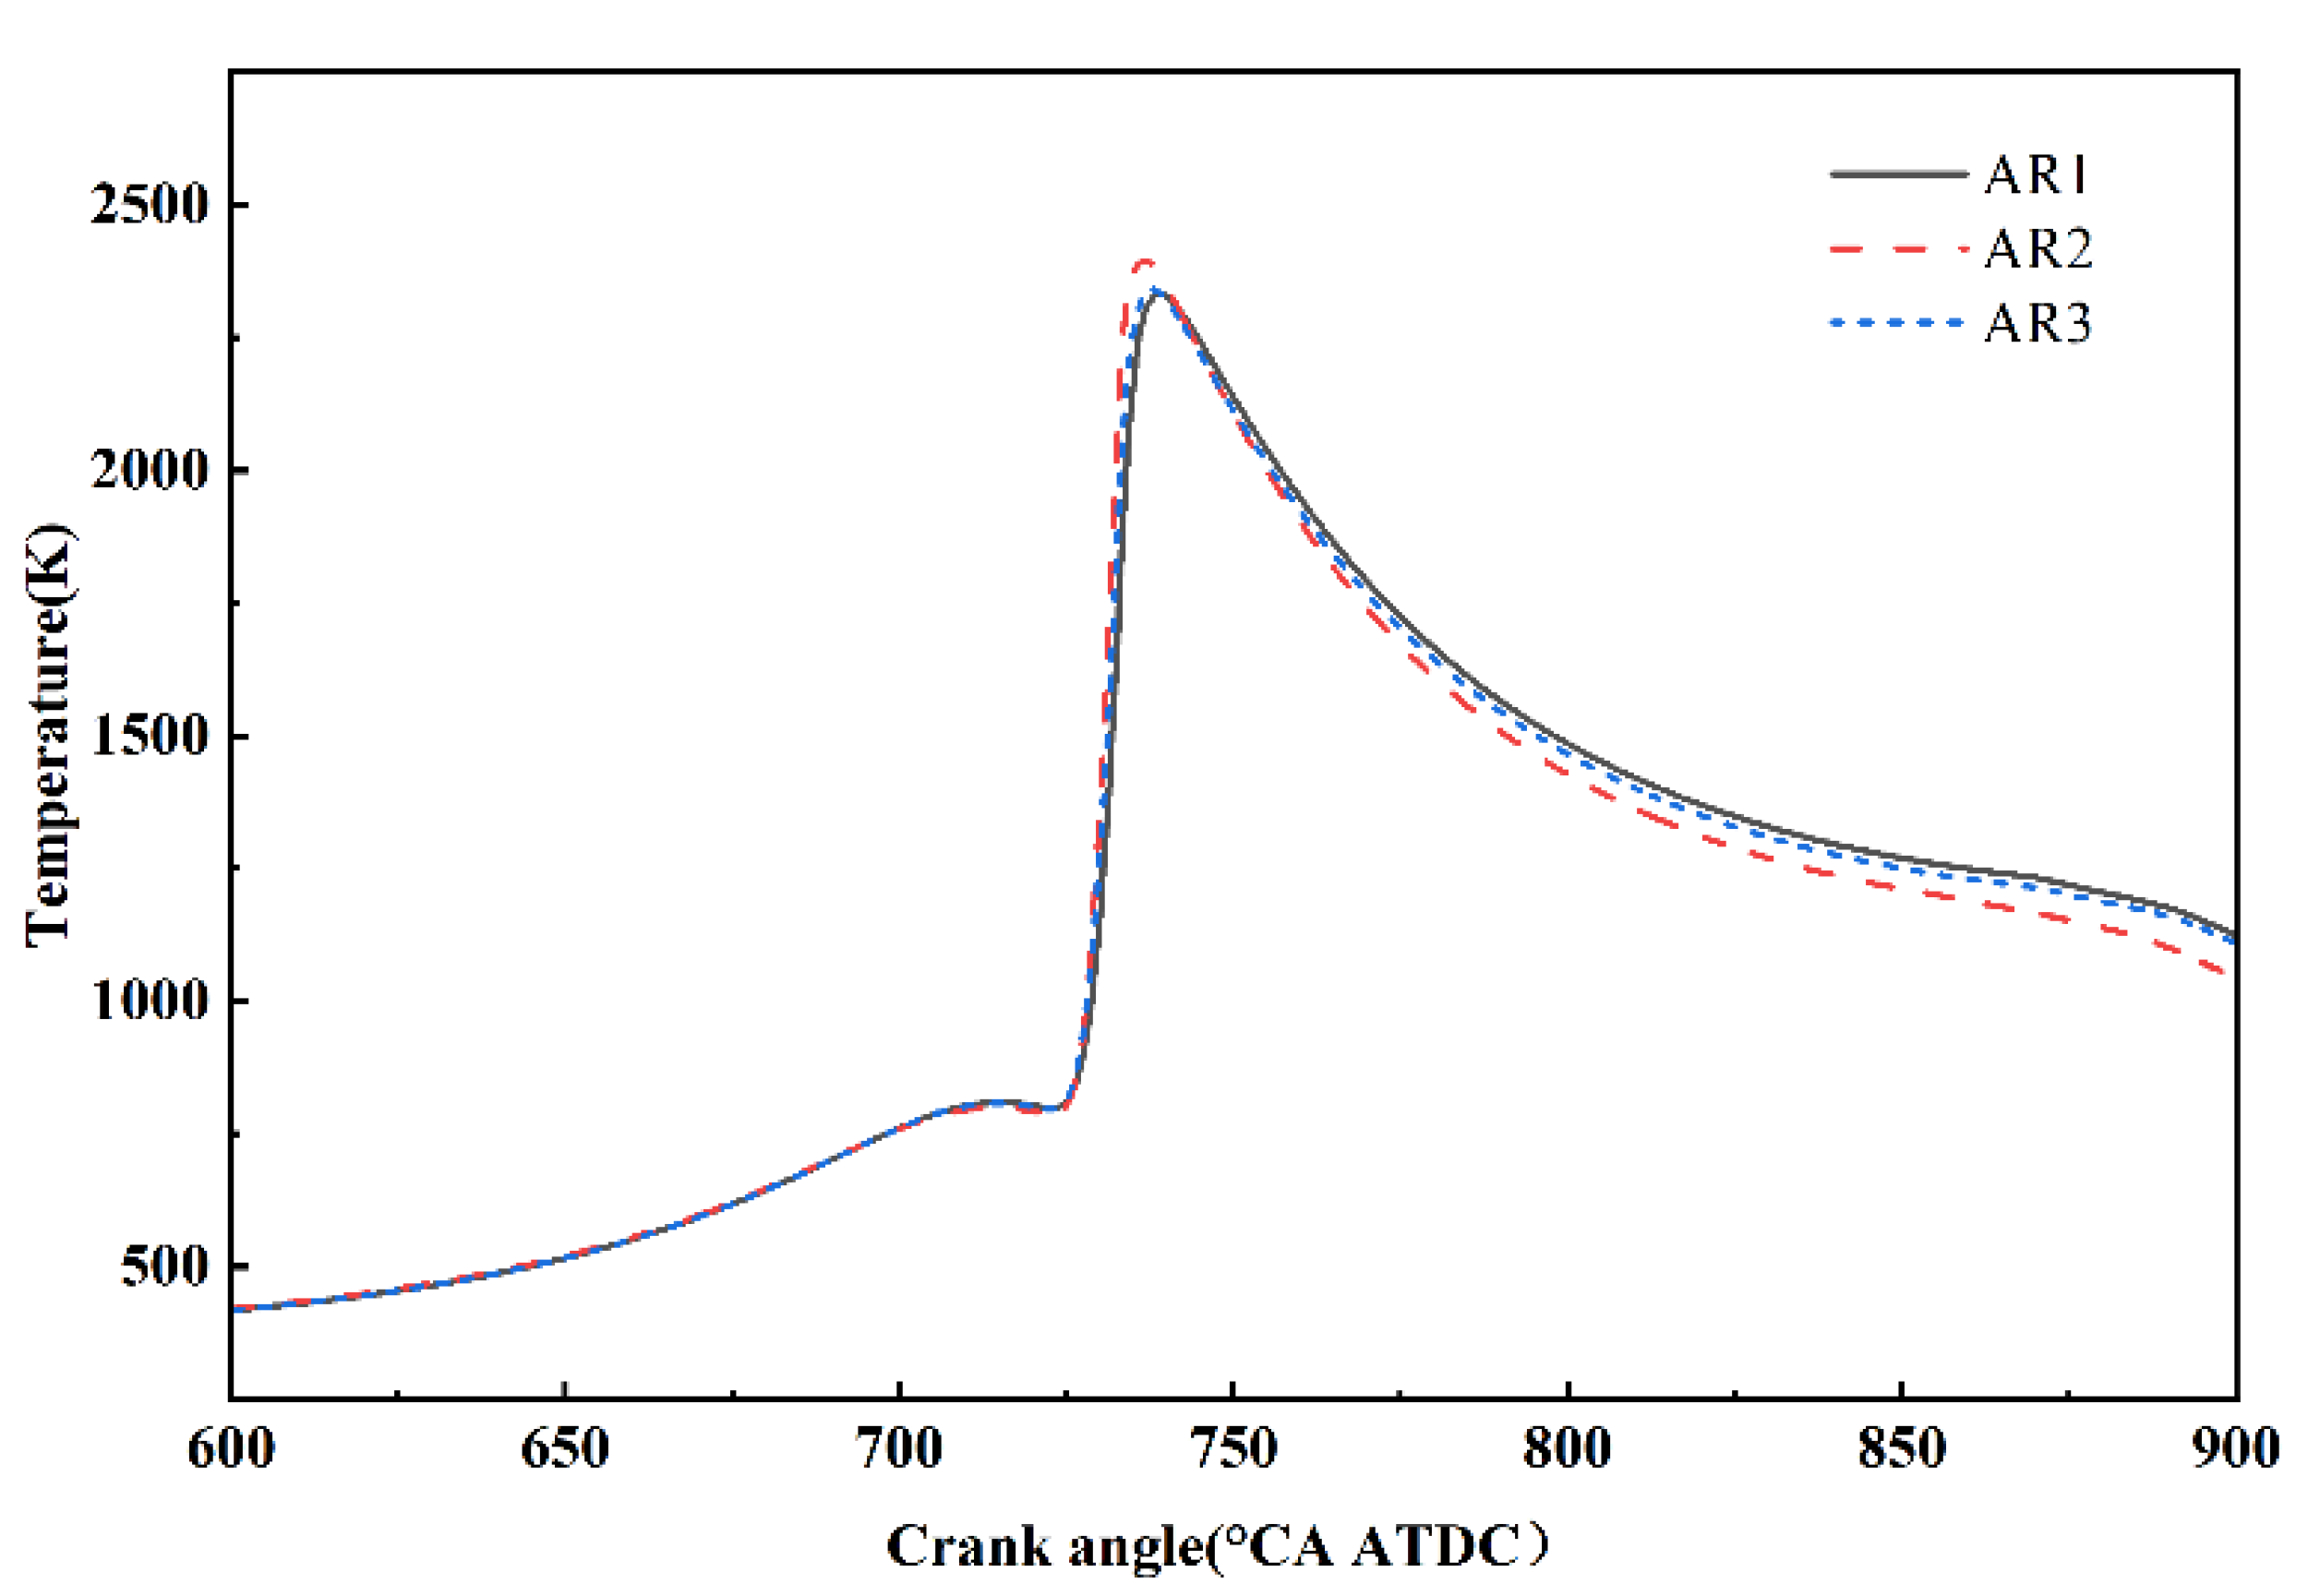
Figure 9 compares the flame evolution isosurfaces of the three schemes at the early post-ignition stages (723 °CA, 726 °CA, and 729 °CA). The spatial topological structure of the early flame directly determines the turbulent combustion rate and transient heat release rate. As can be seen from the figure, benefiting from the ideal and symmetrical equivalence ratio stratification around the spark plug at the ignition timing, the early flame kernel of AR2 can expand outward rapidly and uniformly after ignition. Its flame front is relatively thin, and under the coupling effect of the in-cylinder flow field, it exhibits a highly stretched spatial morphology, with the flame surface area expanding rapidly and sufficiently. This morphological feature represents an extremely high mass burning rate; a large amount of mixture is consumed within a short period to release heat, directly leading to the sharp rise in the in-cylinder temperature of AR2.
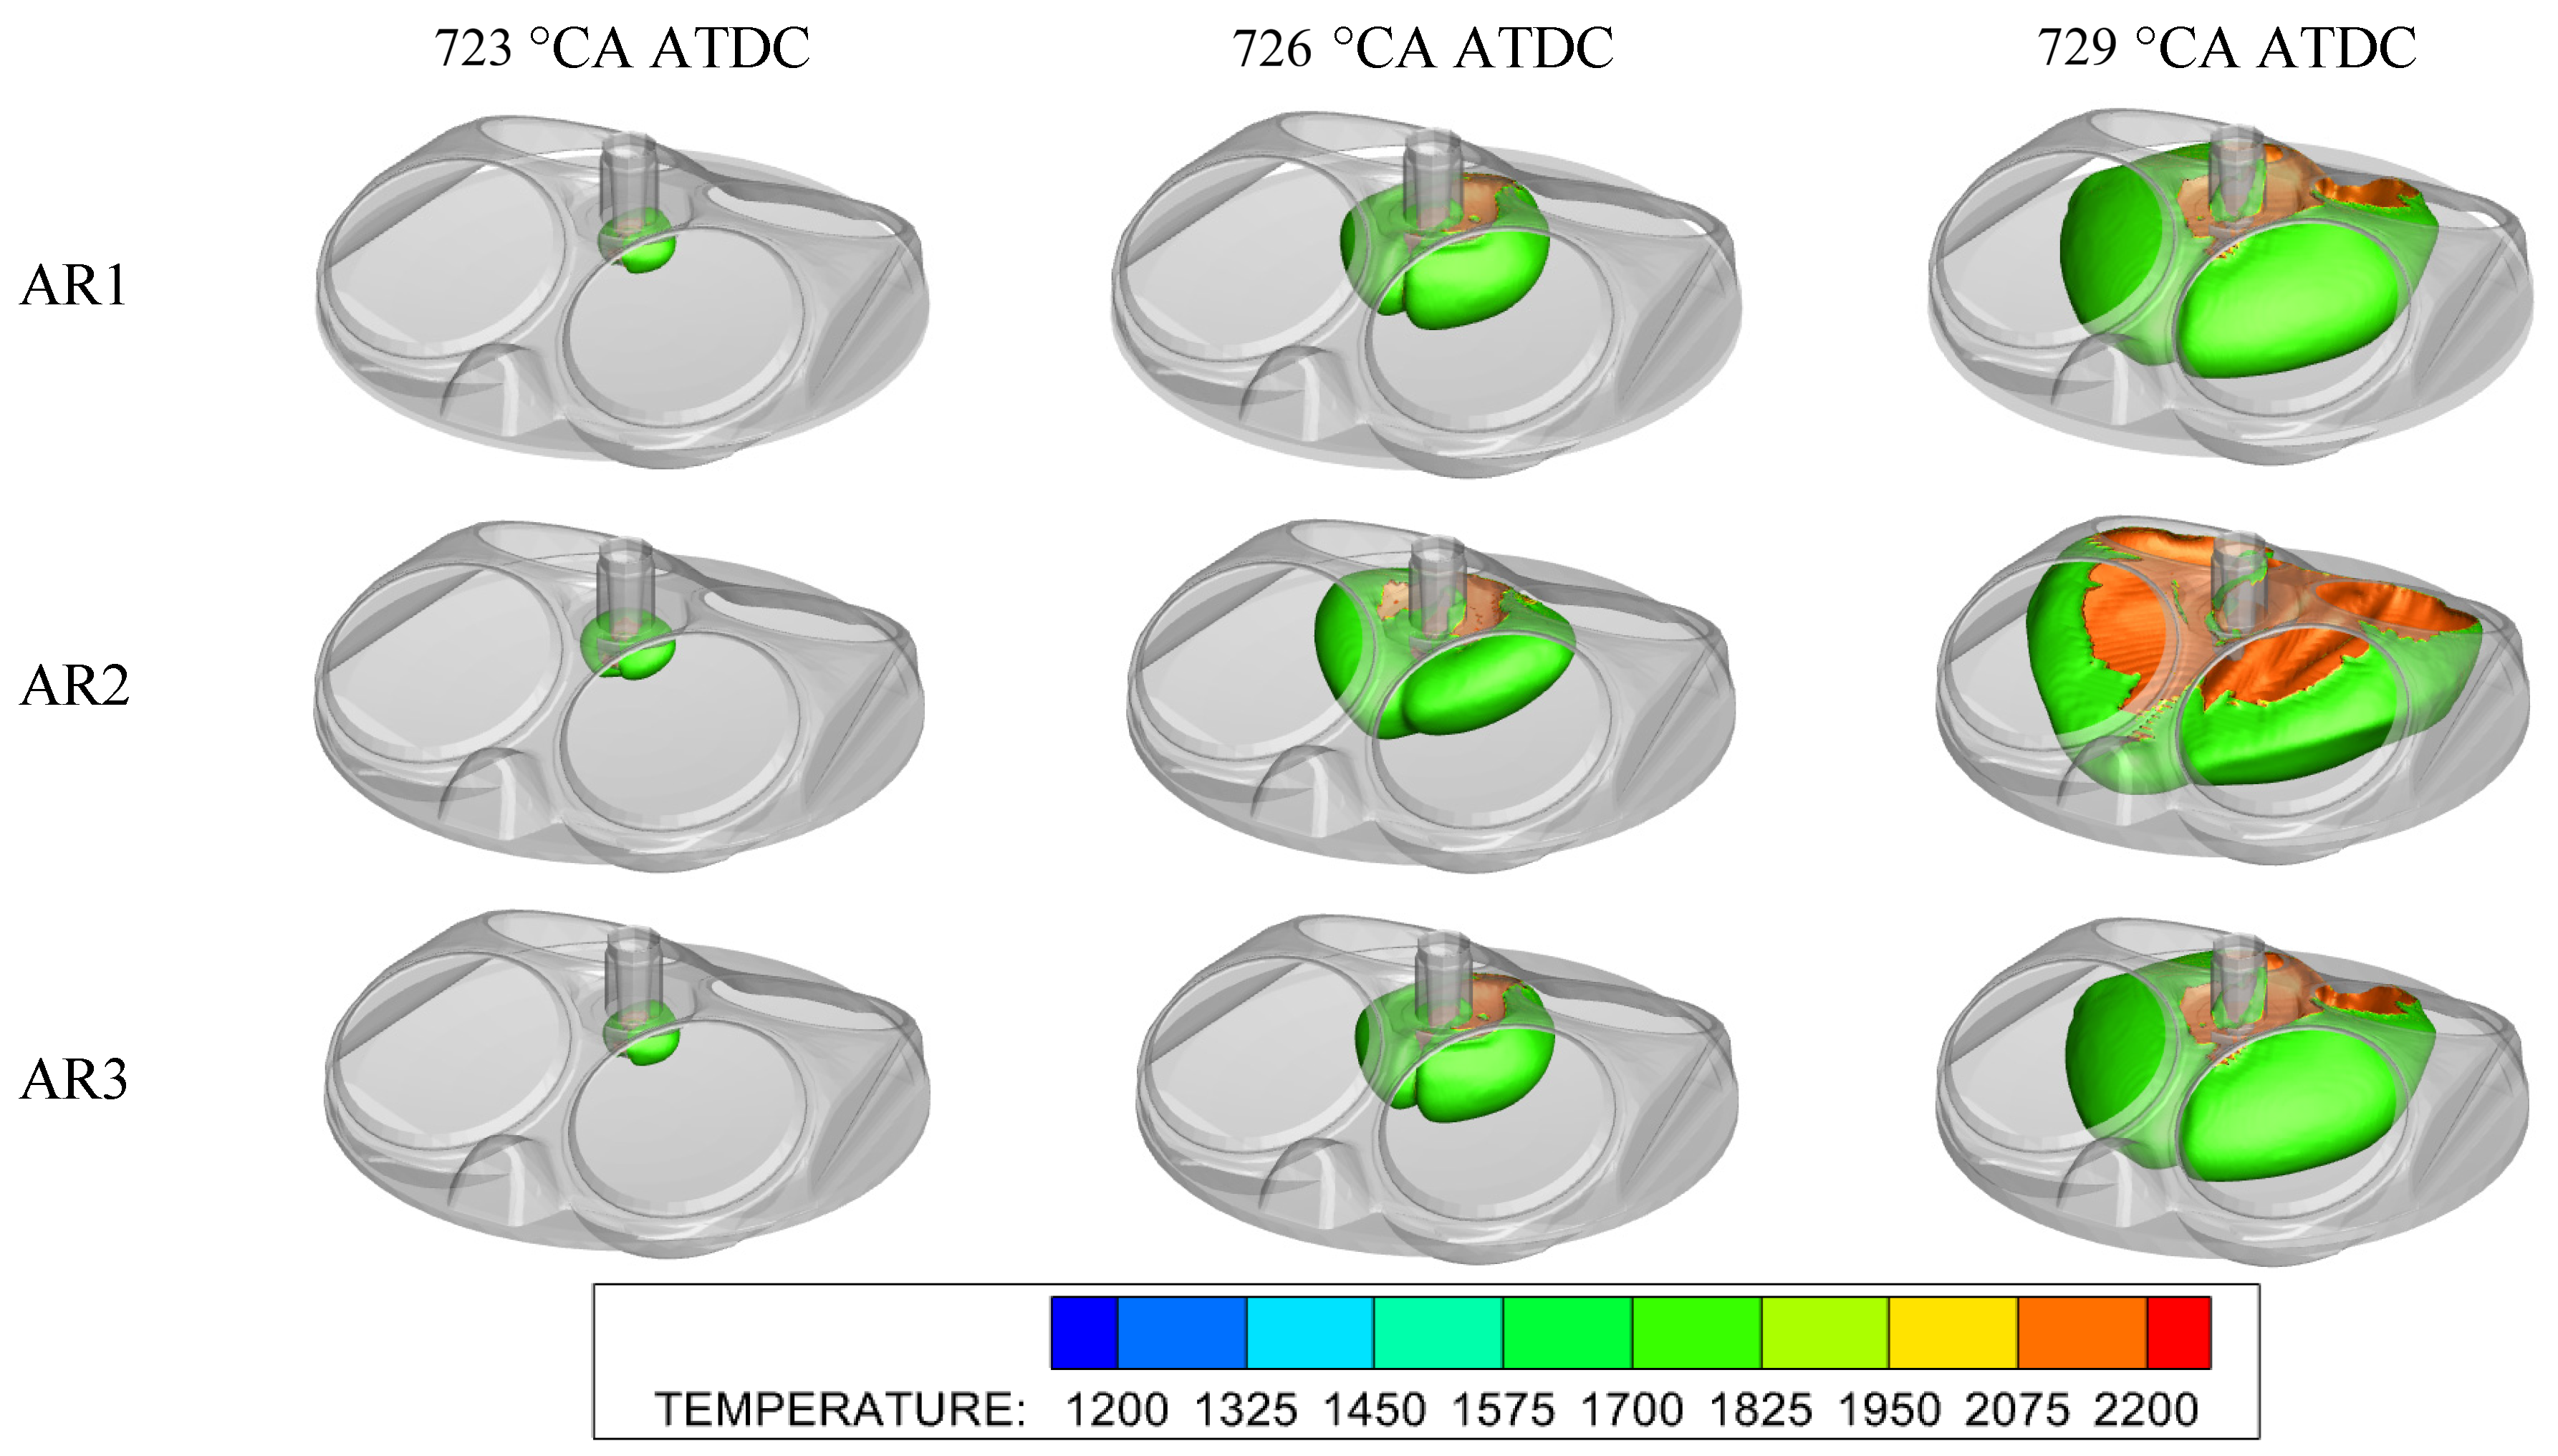
Conversely, because AR1 and AR3 encounter an asymmetric concentration field during the initial ignition stage, flame propagation toward overly rich or lean regions is hindered. Macroscopically, this manifests as a broadened reaction zone, a thicker flame front, and significantly restricted spatial stretch (i.e., the overall development of the flame surface area is inferior to that of AR2). This restricted flame topological structure results in a lower flame front propagation speed and a relatively sluggish combustion heat release process, thereby maintaining a lower in-cylinder temperature level. It should be noted that although AR2 achieves an extremely fast combustion rate, its peak in-cylinder temperature of nearly 2400 K will significantly increase the temperature gradient between the high-temperature combustion products and the cylinder wall, which will inevitably exacerbate wall heat transfer losses.
3.3. Effect of Nozzle Hole Arrangement on Combustion Phasing
Figure 10 compares the key combustion phasing distributions under the three different hole arrangement schemes (AR1, AR2, and AR3), including the ignition delay period (the crank angle from the ignition timing to 5% cumulative heat release, CA5), the main heat release period (50% cumulative heat release, CA50), and the end of combustion (90% cumulative heat release, CA90). As can be seen from the figure, the spatial arrangement of the spray target points plays a crucial regulating role in the global in-cylinder combustion rate, and the combustion phasing of the three schemes exhibits a clear cascading progression.
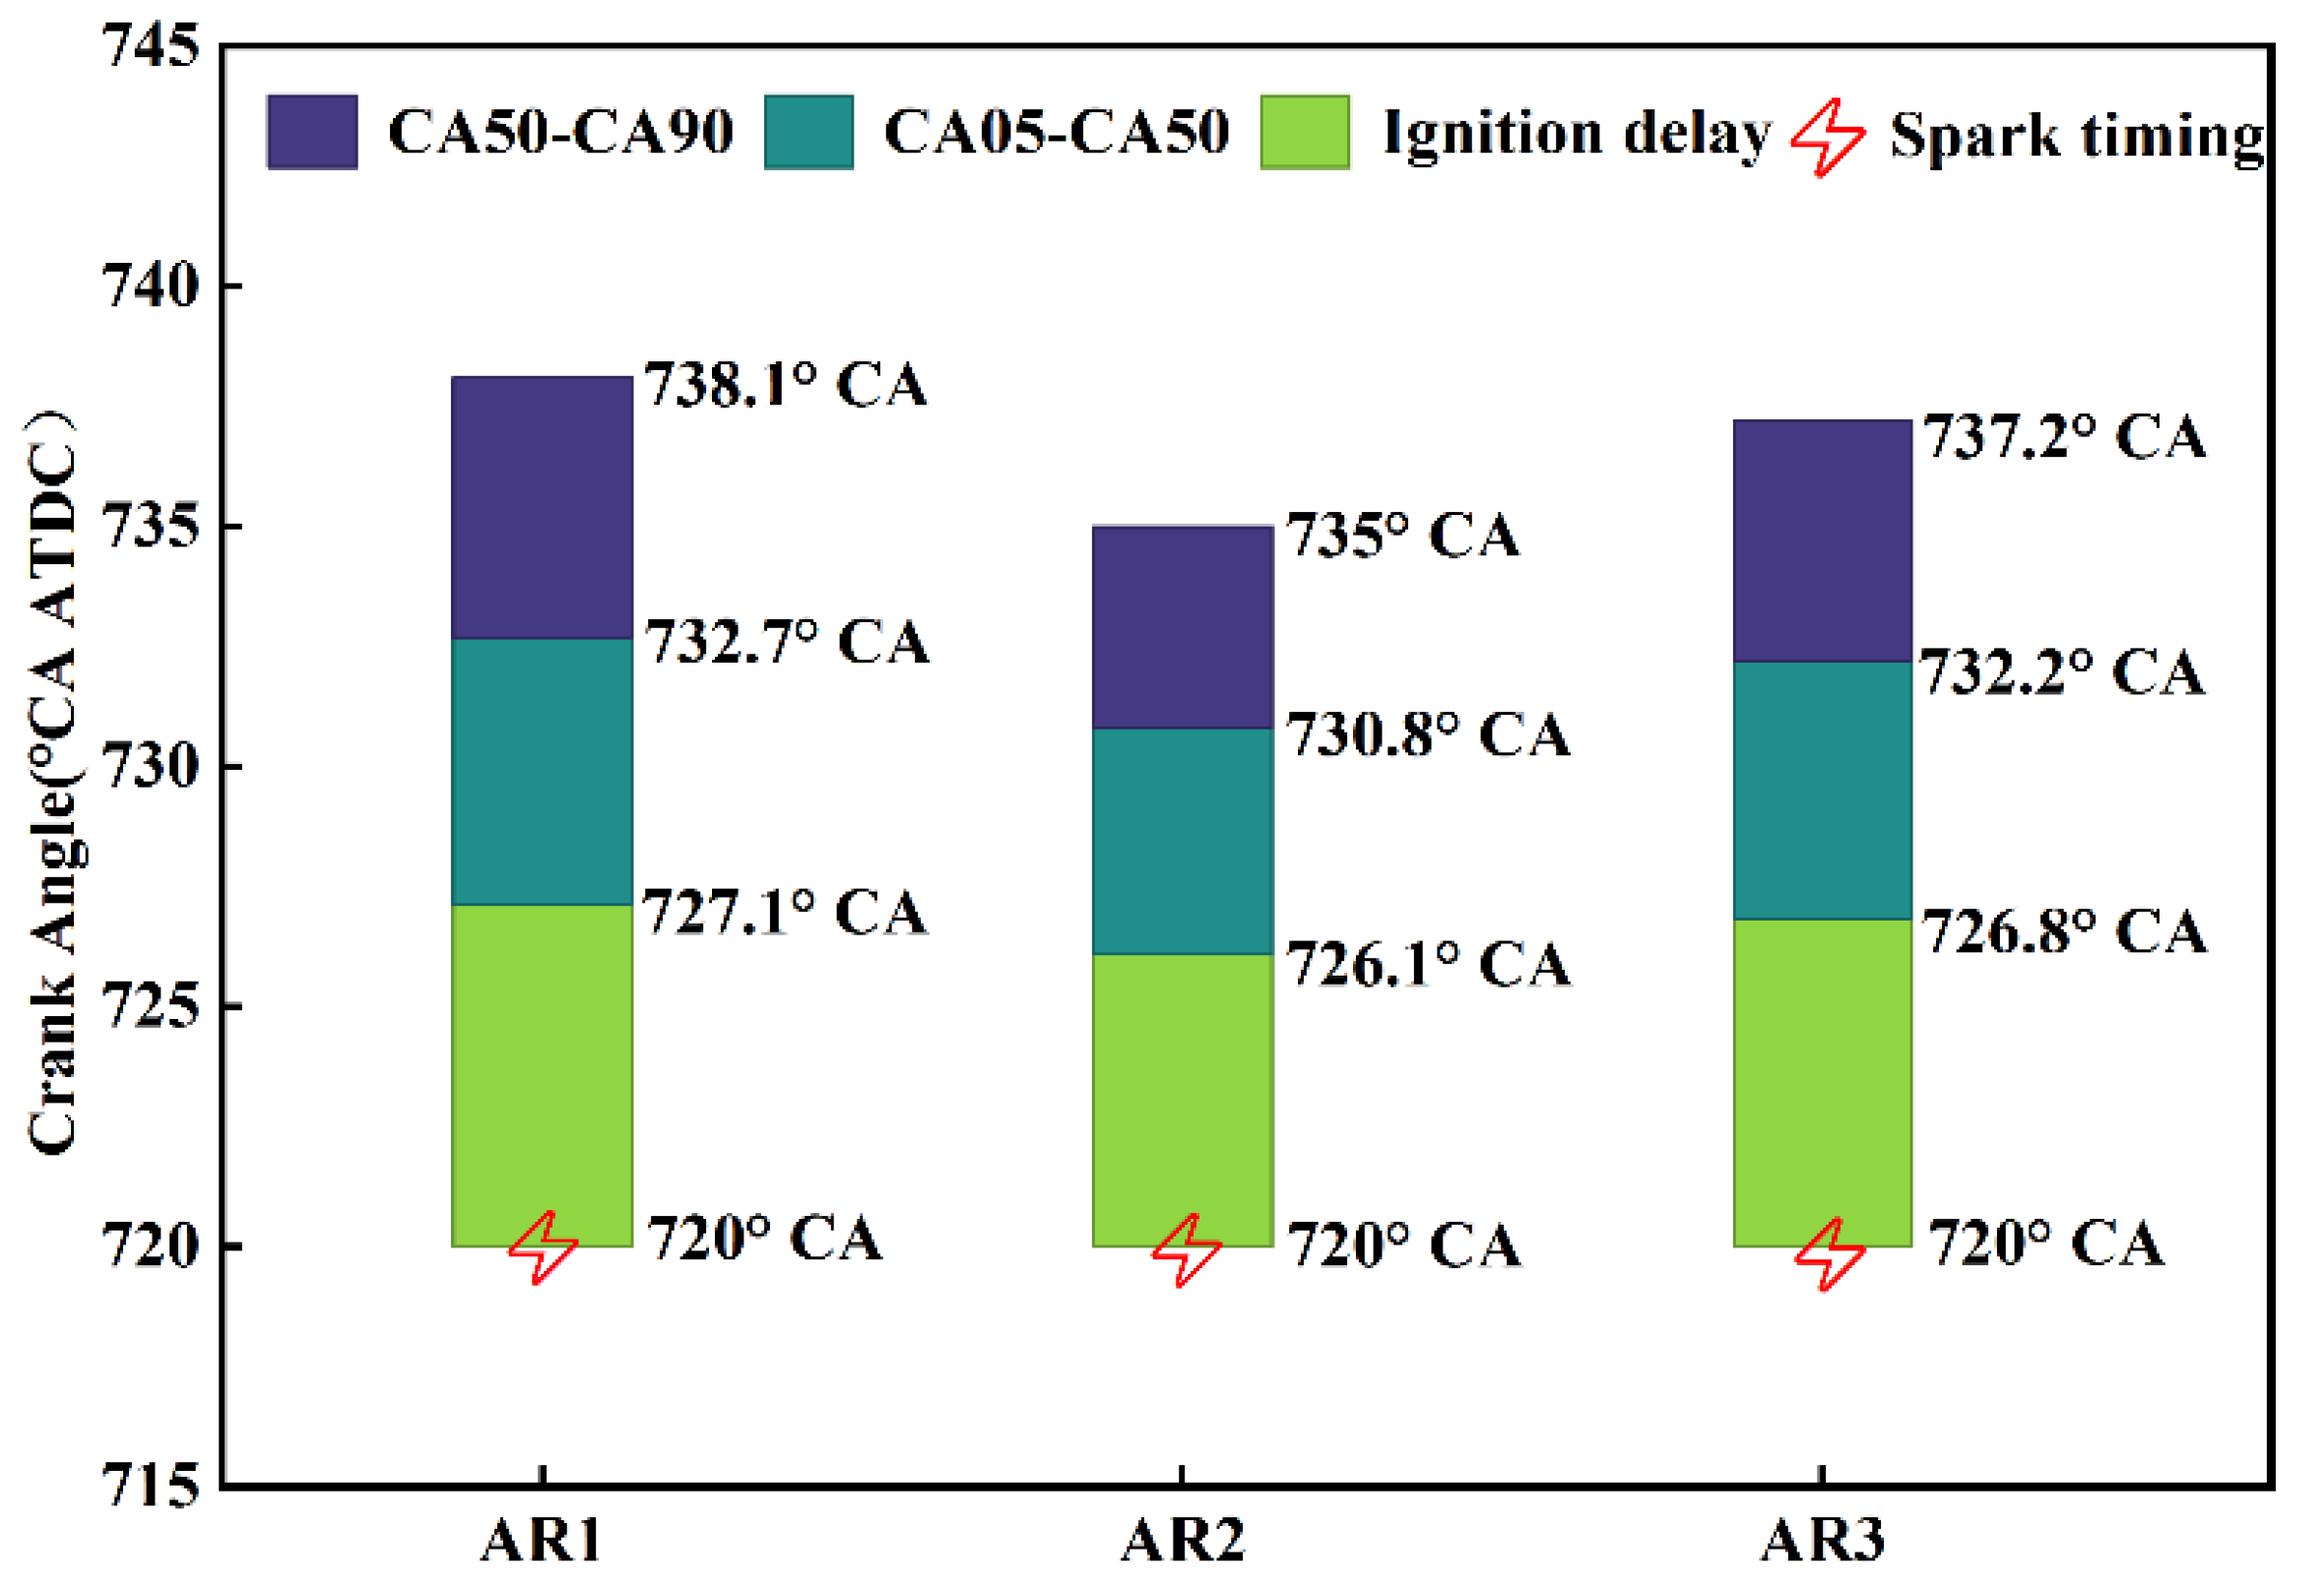
First, observing the CA5 phase, which represents the early flame kernel development rate, the CA5 of AR2 appears the earliest (726.1 °CA), significantly leading AR3 (726.8 °CA) and AR1 (727.1 °CA). Through the overall inward shift of the spray, AR2 constructs a symmetrical and appropriately concentrated local mixture environment around the spark plug. This highly ideal initial concentration stratification greatly shortens the ignition delay period, enabling the flame kernel to be rapidly established and expand outward. Between AR1 and AR3, because the target points of holes 3 and 5 in AR3 are slightly retracted inward, their local spatial mixture distribution during the initial ignition stage is more compact than that of AR1. Consequently, this results in a slightly faster early flame propagation speed for AR3, with its CA5 advancing by 0.3 °CA compared to the completely divergent AR1.
As combustion progresses, the differences in CA50 are further amplified. The CA50 of AR2 is significantly advanced to 730.8 °CA, exhibiting extremely rapid main heat release characteristics compared to AR3 (732.2 °CA) and AR1 (732.7 °CA). The significant advancement of CA50 indicates that AR2 possesses an extremely high mass burning rate during the main heat release phase, and the flame front undergoes rapid turbulent consumption within the symmetrical fuel-rich region. This is the fundamental reason why AR2 was previously observed to achieve the highest peak cylinder pressure and peak cylinder temperature. However, an excessively early CA50 also brings negative thermodynamic effects; namely, the high-temperature and high-pressure combustion gas resides in the cylinder for an extended period, which exacerbates the heat transfer tendency to the cylinder wall.
Finally, regarding CA90, which represents the total combustion duration, AR2 similarly completes 90% of the fuel consumption in the shortest time (735.0 °CA), whereas AR3 and AR1 are delayed to 737.2 °CA and 738.1 °CA, respectively. The latest CA90 of AR1 indicates that its combustion process is the most gradual and continuous. Because the spray target points of AR1 are the most dispersed, the fuel forms a widely distributed homogeneous mixture in the cylinder. The flame front must sweep across a broader cylinder volume to consume the fuel scattered at the distal ends, thus significantly prolonging its overall combustion duration.
3.4. Effect of Nozzle Hole Arrangement on Energy Distribution
Figure 11 presents the total fuel energy distribution of the engine under the three different hole arrangement schemes (AR1, AR2, and AR3), primarily including indicated thermal efficiency (ITE), exhaust loss, and heat transfer loss. The energy distribution is not only the final settlement of the engine’s thermodynamic closed loop but also the most intuitive indicator for evaluating the comprehensive performance of different injection strategies. As shown in the figure, although AR2 exhibited the fastest combustion rate and the highest peak cylinder pressure in the preceding text, its indicated thermal efficiency is the lowest (37.3%). In contrast, AR1 achieves the highest thermal efficiency (38.6%), while AR3 is in the middle (38.3%).
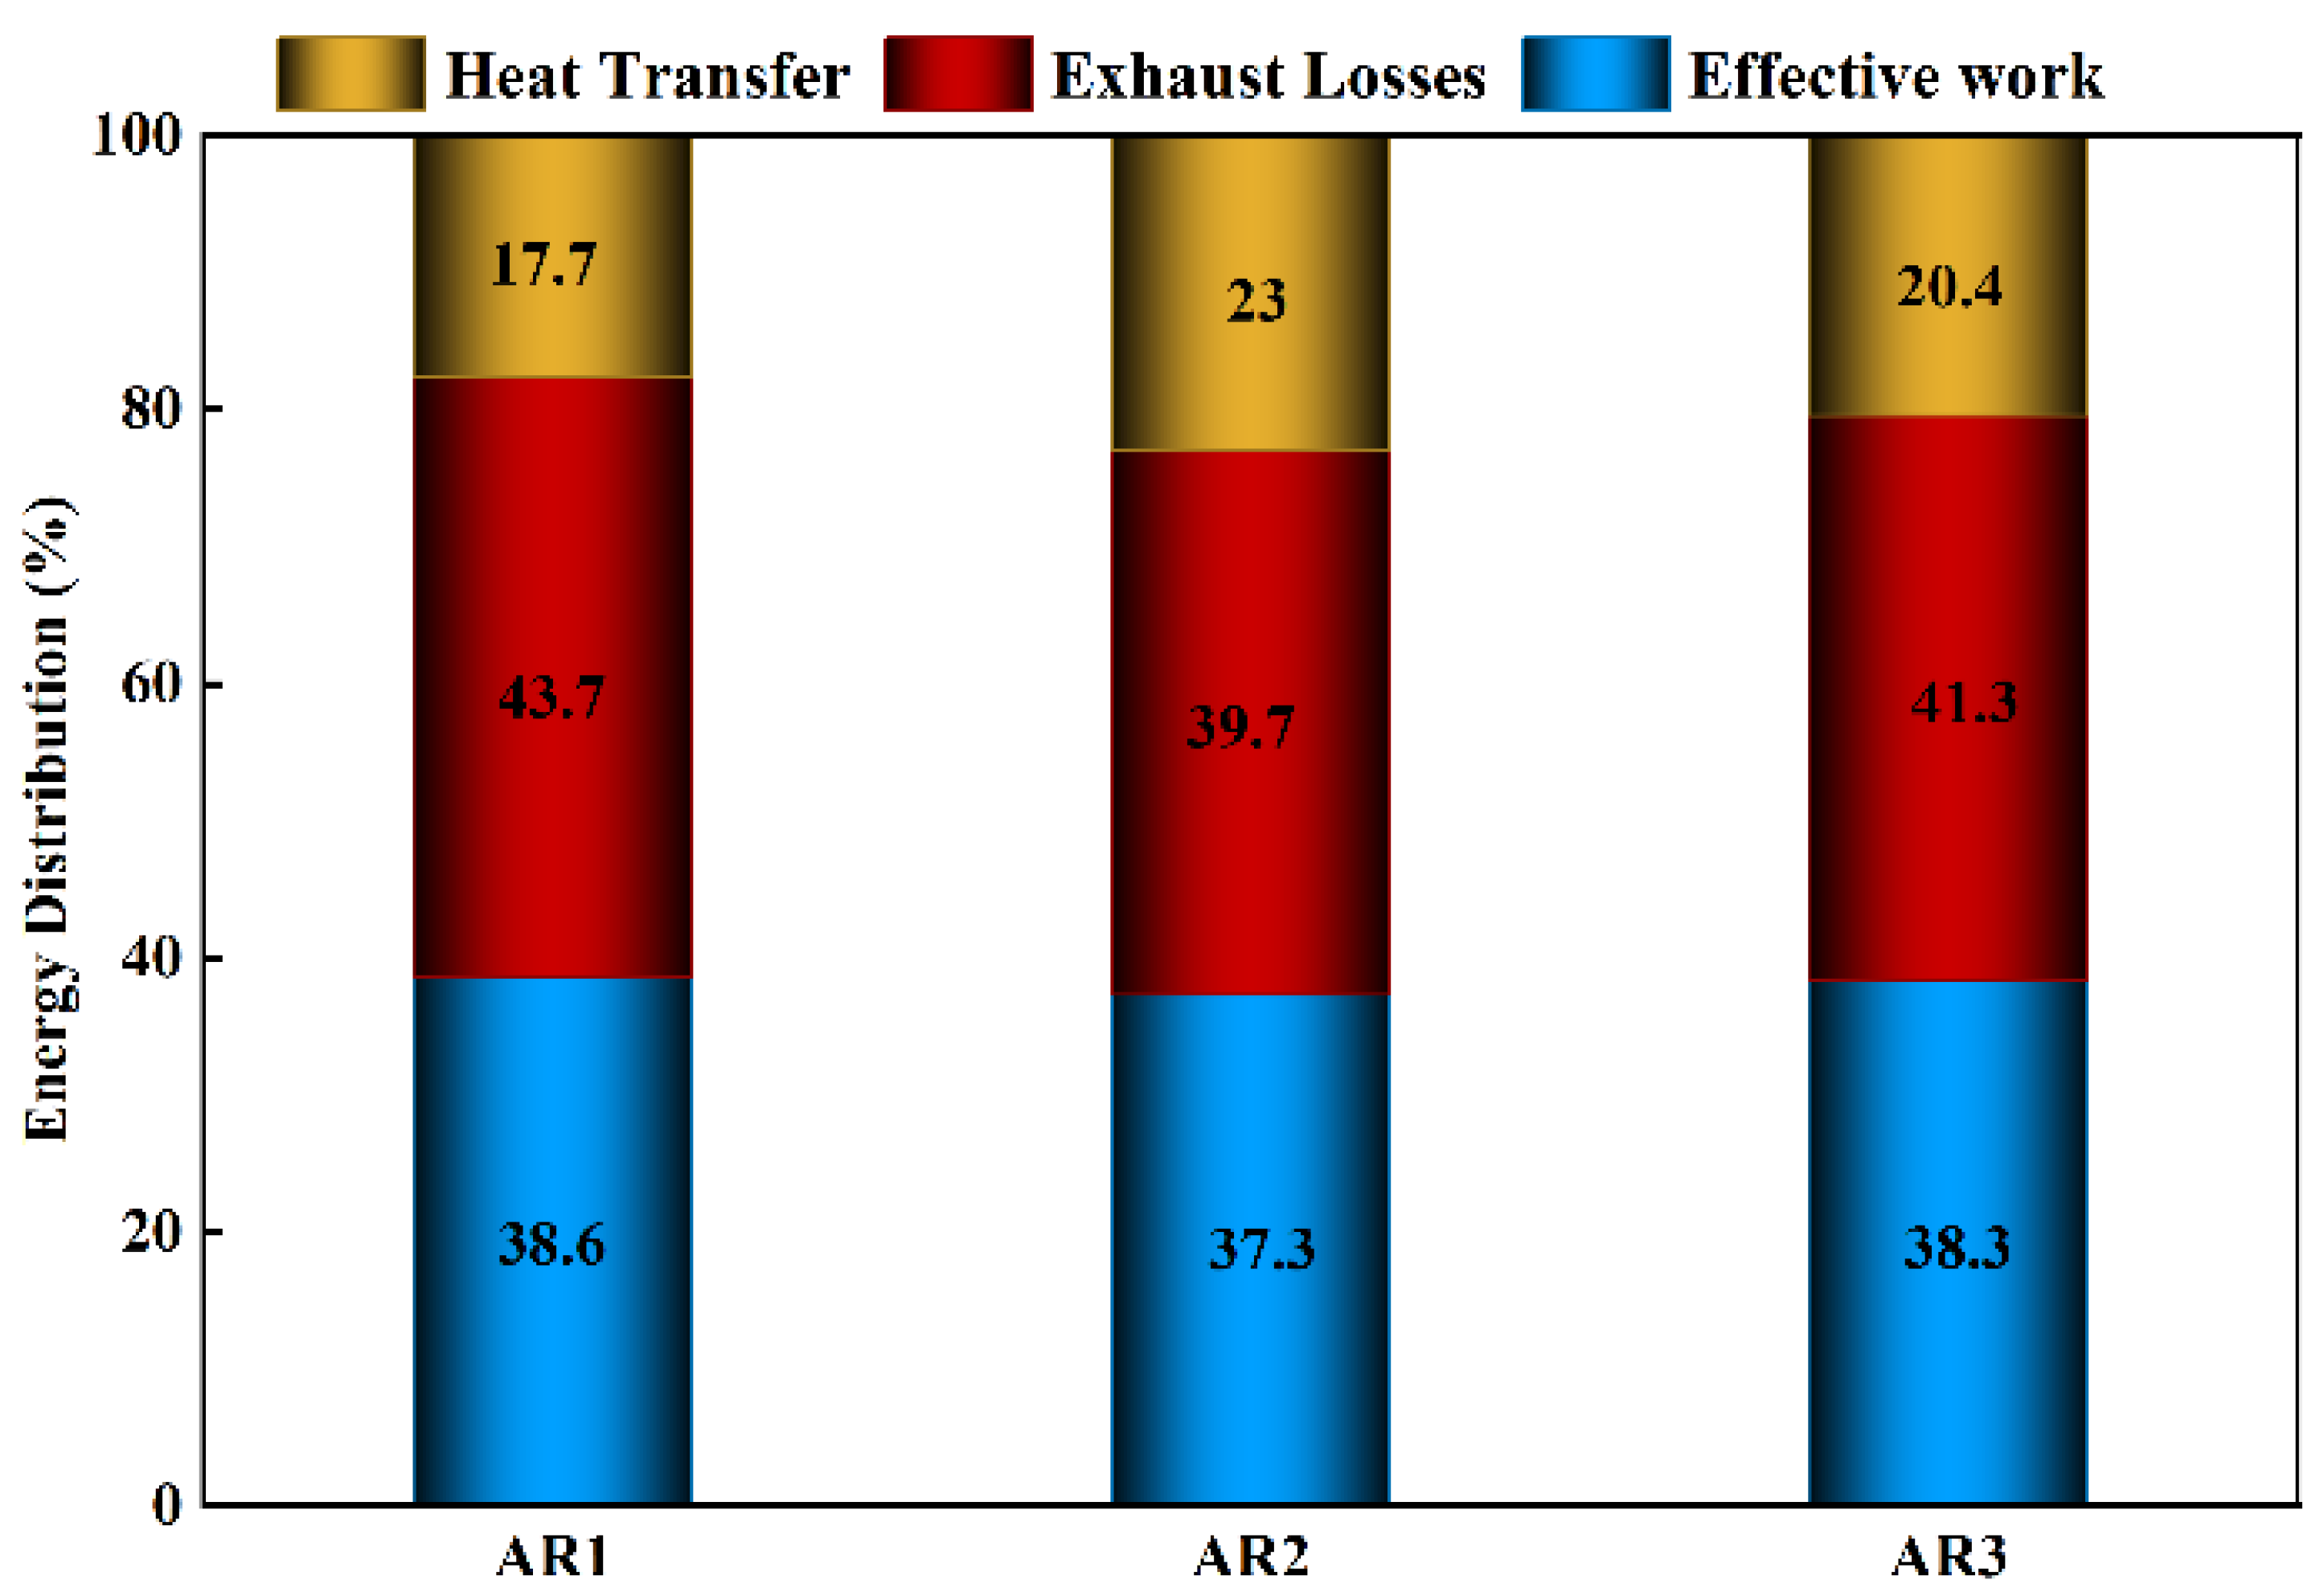
An in-depth analysis of the energy boundary conditions reveals that the drastic variation in heat transfer loss is the core driving factor leading to the reversal of thermal efficiency. The heat transfer loss of AR2 reaches 23.0%, which is significantly higher than that of AR3 (20.4%) and AR1 (17.7%). This heat dissipation mainly originates from two physical mechanisms: First, from a global thermodynamic perspective, the peak in-cylinder temperature of AR2 approaches 2400 K. The extremely high gas temperature substantially increases the heat transfer temperature difference between the in-cylinder working fluid and the cylinder walls (cylinder head, piston, and cylinder liner), thereby greatly enhancing the heat transfer loss. Secondly, from the perspective of microscopic near-wall reaction dynamics, the nozzle hole design of AR2 causes a larger amount of methanol fuel to adhere to the relatively lower-temperature cylinder liner surface. As revealed by Sun et al. [28], such slowly evaporating wall-attached liquid films are highly prone to inducing the “pool fire” phenomenon—a typical near-wall diffusion combustion originating from fuel films on cold surfaces. Under the operating conditions of this study, these liquid films, adhering near the cooling water jacket and being difficult to vaporize rapidly, form pool fires upon ignition. This near-wall combustion destroys the low-temperature thermal boundary layer that originally served as thermal insulation, causing more combustion heat to dissipate outward through the cylinder liner. This becomes the primary reason for the substantial reduction in the indicated thermal efficiency of AR2.
On the other hand, the trend of exhaust loss is completely opposite to that of heat transfer loss, exhibiting a pattern of AR1 (43.7%) > AR3 (41.3%) > AR2 (39.7%). The magnitude of the exhaust enthalpy is directly controlled by the combustion phasing (especially the late heat release history). Because the spray of AR1 is the most divergent, forming the most extensive homogeneous mixture, its combustion duration (CA90) is the longest, and its CA50 is relatively delayed. This means that more fuel heat is released during the middle and late stages of the expansion stroke. At this time, the piston has already moved down substantially, and this portion of “late” heat cannot be effectively converted into expansion work; instead, it remains in the cylinder in the form of exhaust internal energy and is eventually discharged out of the cylinder when the exhaust valve opens. In contrast, for AR2, because its main combustion period is extremely short and occurs very early, the fuel heat is almost completely released near the compression top dead center. The gas undergoes relatively sufficient expansion cooling in the subsequent expansion stroke, and therefore, the proportion of heat carried away by its exhaust is the lowest.
4. Conclusions
This study focused on a direct-injection methanol engine. It investigated three spatial nozzle hole arrangements (AR1, AR2, and AR3). We compared their effects on in-cylinder mixture formation, combustion evolution, and fuel energy distribution. The main conclusions are as follows:
(1) The spatial arrangement of spray target points dictates early flame kernel development and global combustion rates. It alters the local equivalence ratio around the spark plug during ignition. In the AR2 scheme, the spray plumes shift inward. This creates a highly symmetrical and optimal concentration stratification at the spark plug gap. Consequently, AR2 achieves the shortest ignition delay and significantly advances CA50. This yields the highest peak cylinder pressure (6.06 MPa) and peak temperature (2394.7 K).
(2) Extremely high-quality local mixing and fast combustion do not guarantee improved overall thermodynamic performance. AR2 demonstrates the optimal in-cylinder combustion effect. However, the wall-attached liquid film on the cylinder liner leads to a substantial increase in the heat transfer loss for AR2 (23.0%), which ultimately results in the lowest indicated thermal efficiency (37.3%).
(3) Optimizing the hole arrangement is essentially a trade-off between spatial mixture homogeneity and wall heat interaction. The AR1 scheme sacrifices some constant-volume combustion degree and increases exhaust energy loss. However, its divergent target point design fully utilizes the high-temperature piston crown. This promotes sufficient fuel gasification and significantly suppresses near-wall heat transfer to the cylinder liner. Ultimately, AR1 achieves the optimal indicated thermal efficiency (38.6%). It also records the lowest heat transfer loss (17.7%) alongside extremely high combustion efficiency. This provides an ideal benchmark for optimizing methanol engine injection strategies.
It should be further clarified that the target DISI methanol engine in this study is specifically developed for range extender applications. Range extenders typically operate at a fixed, highly optimized steady-state condition to achieve ideal thermal efficiency and provide stable power output. Therefore, the current study focused on the optimization of the nozzle hole arrangement under this primary operating condition. In future research, we plan to conduct a comprehensive sensitivity analysis over a broader range of engine loads and injection pressures to further verify the robustness of the nozzle design for more diverse engine applications.
Author Contributions
Y.L.: writing—original draft, methodology; L.L.: writing—review and editing, methodology; X.G.: 3D modeling, validation, visualization; K.L.: 3D modeling, data curation, formal analysis; H.L.: supervision, project administration, funding acquisition. All authors have read and agreed to the published version of the manuscript.
Funding
This study was funded by the Heilongjiang Provincial Key R&D Program (2024ZX03B07) and the Fundamental Research funds for the Central Universities (3072025CFJ0703 & 30720205GH0301).
Institutional Review Board Statement
Not applicable.
Informed Consent Statement
Not applicable.
Data Availability Statement
Data will be made available on request.
Conflicts of Interest
The authors declare no conflict of interest.
Use of AI and AI-Assisted Technologies
No AI tools were utilized for this paper.
References
- 1.
Chang, Y.; Liu, D.; Chang, F.; Zhai, C.; Liu, L.; Luo, H.; Yu, M.; Ge, J.; Nishida, K. Marine lifecycle carbon footprint toward carbon neutrality: Recent progress and prospects. Processes 2025, 13, 3997.
- 2.
Hafis, M.; Balaji, K.; Tamilarasan, N.; Senthilkumar, D.; Sakthivel, R. A review on alternative fuels: Spray characteristics, engine performance and emissions effect. Sustain. Futures 2025, 9, 100456.
- 3.
Yang, Z.; Wei, H.; He, X.; Wei, L.; Li, J.; Liu, H. Applicability study of biodiesel on marine diesel engines. J. Harbin Eng. Univ. 2016, 37, 71–75. (In Chinese)
- 4.
Li, L.; Wang, Z.; Li, M.; Chen, L.; Xu, G. Calculation and analysis of premixed flame combustion process of ethanol and dimethyl ether. J. Jiangsu Univ. 2012, 33, 396–401. (In Chinese)
- 5.
Ni, P.; Wang, Z.; Yuan, Y.; Mao, G. Simulation of homogeneous charge compression ignition combustion characteristics of pure methanol engine. J. Jiangsu Univ. 2010, 31, 656–659. (In Chinese)
- 6.
Xu, J.; Song, A.; Hong, J.; Li, Y.; Liu, M.; Zhang, G. Current status and prospect of hydrogen application under low-carbon background. Energy Environ. Prot. 2023, 37, 65–73. (In Chinese)
- 7.
Zhang, Y.; Zhao, Y.; Zeng, G.; Zhang, W.; Zhang, L.; Sun, S. A review of the research progress of ammonia combustion enhancement technology. Energy Environ. Prot. 2023, 37, 129–144. (In Chinese)
- 8.
Luo, H.; Ma, J.; Lu, F.; Liu, L.; Yu, M. Combustion sensitivity analysis of hydrogen direct-injection natural gas engines. J. Harbin Eng. Univ. 2026, 47, 365–378. (In Chinese)
- 9.
IRENA. A Pathway to Decarbonise the Shipping Sector by 2050. Available online: https://www.irena.org/publications/2021/Oct/A-Pathway-to-Decarbonise-the-Shipping-Sector-by-2050 (accessed on 8 April 2026).
- 10.
Wang, D.; Li, J.; Meng, W.; Liao, Z.; Yang, S.; Hong, X.; Zhou, H.; Yang, Y.; Li, G. A near-zero carbon emission methanol production through CO2 hydrogenation integrated with renewable hydrogen: Process analysis, modification and evaluation. J. Clean. Prod. 2023, 412, 137388.
- 11.
de Fournas, N.; Wei, M. Techno-economic assessment of renewable methanol from biomass gasification and PEM electrolysis for decarbonization of the maritime sector in California. Energy Convers. Manag. 2022, 257, 115440.
- 12.
Gong, Y.; Han, L.; Zhang, L.; Qian, D.; Li, X.; Xie, F. Effect of different injectors on the performance of methanol direct injection engines. Fuel 2026, 405, 136625.
- 13.
Guo, X.; Luo, H.; Liu, L.; Liu, K.; Ge, J.; Nishida, K. Towards green marine engines: A review of methanol fueled internal combustion engine. Green Energy Resour. 2026, 4, 1, 100168.
- 14.
Yin, X.; Xu, L.; Duan, H.; Wang, Y.; Wang, X.; Zeng, K.; Wang, Y. In-depth comparison of methanol port and direct injection strategies in a methanol/diesel dual fuel engine. Fuel Process. Technol. 2023, 241, 107607.
- 15.
Duan, Q.; Yin, X.; Wang, X.; Kou, H.; Zeng, K. Experimental study of knock combustion and direct injection on knock suppression in a high compression ratio methanol engine. Fuel 2022, 311, 122505.
- 16.
Yang, K.; Wang, Z.; Chen, Y.; Li, M.; Wang, Y.; Yang, L.; Wang, D.; Du, Y. Effects of injector structural parameters coupled with injection pressure on the combustion and emission performance of commercial HPDI natural gas engine. Fuel 2026, 413, 138211.
- 17.
Kang, S.; Lee, S.; Hong, D.; Bae, C. Effects of nozzle orifice diameter and hole number on diesel combustion and engine performance. Int. J. Automot. Technol. 2022, 23, 481–494.
- 18.
Kim, H.J.; Park, S.H.; Lee, C.S. Light intensity and image visualization of GDI injector sprays according to nozzle hole arrangements. Optik 2014, 125, 2763–2767.
- 19.
Chang, M.; Park, J.; Kim, H.I.; Park, S. Comparison of spray evaporation characteristics of five-hole GDI injectors with different hole arrangements under flash boiling conditions. Int. J. Heat Mass Transf. 2021, 181, 121841.
- 20.
Jiang, M.; Sun, W.; Guo, L.; Zhang, H.; Jia, Z.; Qin, Z.; Zhu, G.; Yu, C.; Zhang, J. Numerical optimization of injector hole arrangement for marine methanol/diesel direct dual fuel stratification engines. Appl. Therm. Eng. 2024, 257, 124456.
- 21.
Han, Z.; Reitz, R.D. Turbulence modeling of internal combustion engines using RNG κ-ε models. Combust. Sci. Technol. 1995, 106, 267–295.
- 22.
O’Rourke, P.J.; Amsden, A.A. The TAB Method for Numerical Calculation of Spray Droplet Breakup. In Proceedings of the 1987 SAE International Fall Fuels and Lubricants Meeting and Exhibition, Toronto, ON, Canada, 2–5 November 1987.
- 23.
O’Rourke, P.J.; Amsden, A.A. A Spray/Wall Interaction Submodel for the KIVA-3 Wall Film Model. In Proceedings of the SAE 2000 World Congress, Detroit, MI, USA, 6–9 March 2000.
- 24.
Nazemi, M.; Shahbakhti, M. Modeling and analysis of fuel injection parameters for combustion and performance of an RCCI engine. Appl. Energy 2016, 165, 135–150.
- 25.
Ren, Y.; Li, X. Assessment and validation of liquid breakup models for high-pressure dense diesel sprays. Front. Energy 2016, 10, 164–175.
- 26.
Senecal, P.K.; Pomraning, E.; Richards, K.J.; Briggs, T.E.; Choi, C.Y.; McDavid, R.M.; Patterson, M.A. Multi-Dimensional Modeling of Direct-Injection Diesel Spray Liquid Length and Flame Lift-Off Length Using CFD and Parallel Detailed Chemistry. In Proceedings of the SAE 2003 World Congress & Exhibition, Detroit, MI, USA, 3–7 March 2003.
- 27.
Lindstedt, R.P.; Meyer, M.P. A dimensionally reduced reaction mechanism for methanol oxidation. Proc. Combust. Inst. 2002, 29, 1395–1402.
- 28.
Sun, Z.; Cui, M.; Nour, M.; Li, X.; Hung, D.; Xu, M. Differences in pool-fire induced soot production between subcooled spray and flash boiling spray in a DISI engine. Fuel 2021, 287, 119453.


This work is licensed under a Creative Commons Attribution 4.0 International License.
 Suite 4002 Level 4, 447 Collins Street, Melbourne, Victoria 3000, Australia
 General Inquiries: info@sciltp.com