In the new on-board SCR (Selective Catalytic Reduction) system, it is of great significance to realize the real-time prediction of system performance and early diagnosis of system faults through data driving. This research aims to develop a machine learning model that can analyze and integrate historical simulation and experimental data, explore correlations among the data, and enable rapid prediction of system performance. Based on the experimental test results and CFD flow field characteristics of the SCR system, the key indicators affecting system performance were analyzed. Based on the multimodal simulation data and experimental data, the machine learning model was trained to accurately predict the NOx conversion efficiency and accelerate the development process of the SCR system. Finally, the performance of the model was tested using the test set, and the average percentage error was below 1%, with all residual errors falling within the 3σ confidence interval.
- Open Access
- Article
Research on Performance Evaluation Model of Diesel Engine SCR System Based on CFD Flow Field Characteristics and Machine Learning
- Chuyao Zhang 1,
- Fulin Shi 2,
- Chao Gao 2,
- Huimeng Liu 1,*
Author Information
Received: 14 Apr 2026 | Revised: 09 May 2026 | Accepted: 19 May 2026 | Published: 16 Jun 2026
Abstract
Keywords
on-board SCR system | machine learning model | multimodal fusion | CFD flow field characteristics
1. Introduction
Against the backdrop of the double carbon strategy and the full implementation of the national six emission regulations, the number of commercial vehicles in China has exceeded 40 million, of which the NOx emissions of diesel vehicles account for more than 87% of the vehicle emissions. The research on the on-board SCR (Selective Catalytic Reduction) system has important strategic significance [1]. The national six emission regulations will tighten the NOx limit by 77% and introduce the requirements of the actual driving emission (RDE) test. In order to meet the new assessment requirements, the conversion efficiency of the SCR system under steady-state conditions generally needs to reach 97%, the uniformity coefficient in CFD analysis needs to reach 0.95, and the maximum thickness of the liquid film formed on the wall does not exceed 8 µm [2].
Stricter emission regulations have promoted the innovation of SCR technology. The main challenge faced by current Urea-SCR systems stems from the low exhaust temperature during engine low-load operation. The rate of ammonia production through urea pyrolysis at low temperatures is relatively low, and the SCR catalyst does not reach its high-efficiency temperature range, accompanied by the risk of crystallization. Relevant research focuses on the design of high-efficiency mixers, the development of low-temperature active catalysts, and intelligent control strategies [3,4,5,6,7] to solve engineering problems such as insufficient low-temperature conversion efficiency under urban conditions, urea crystallization blockage, and reliability of on-board diagnosis systems. The application of machine learning in the on-board SCR system can significantly improve the intelligence level of the system. By modeling and optimizing the operation data of the SCR system, accurate control of urea injection volume, real-time prediction of catalytic efficiency, and early diagnosis of abnormal faults can be achieved [8,9]. This paper studies the CFD flow field characteristics of the SCR system, analyzes the key indicators in the experiment and simulation, and, combined with the multimodal fusion machine learning model, through the collected data optimization model, realizes the accurate prediction of NOx conversion efficiency of the SCR system.
2. Models and Methods
2.1. Performance Evaluation Index of SCR Mixer
The SCR mixer is responsible for fully mixing the urea spray and exhaust gas to ensure that the ammonia generated by pyrolysis is evenly distributed when entering the catalyst carrier and fully reacts with NOx. The core evaluation indexes of its performance include back pressure, uniformity, crystallization risk assessment, etc. These indicators directly affect the NOx conversion efficiency, durability, and reliability of the SCR system, and are the key basis for mixer design.
Back pressure refers to the additional flow resistance caused by the mixer to the exhaust system, which is usually expressed as pressure drop. While the mixer promotes mixing, it will also increase the pressure loss of the aftertreatment system. Too high back pressure will increase the engine exhaust resistance and reduce fuel economy, so it is necessary to optimize the balance between mixing effect and back pressure. The back pressure Δp is calculated from the pressure difference between the inlet section and the outlet section of the mixer section:
The uniformity of the field variables (velocity, ammonia concentration) at the SCR inlet section is one of the important factors affecting the conversion efficiency of the catalyst carrier. Under certain other conditions, the more uniform the field variables are, the more sufficient the reductant reacts with NOx, and the higher the conversion efficiency of the SCR system. In order to quantify the distribution uniformity of variables at the inlet of the catalyst support, the uniformity index (UI) is usually used to evaluate. The UI is calculated as follows:
In addition, swirl intensity (i.e., swirl number) is also an important factor affecting mixing performance. For a section perpendicular to the rotation axis (x-axis) in the mixer, the swirl intensity is defined as follows [10]:
In the formula, R is the characteristic radius of the section, is the angular momentum flux, and is the axial momentum flux. The two fluxes are obtained by integration:
2.2. Machine Learning Method
Machine learning refers to learning the characteristics of existing data through algorithms and models, and making predictions under new data input. A neural network is an important branch of machine learning. It simulates the connection between human brain neurons and fits the implicit mapping from input to output. A multi-layer perceptron (MLP) is the most widely used neural network model. Its input layer nodes accept multiple scalar inputs, which are transferred to the output layer nodes through the multi-layer neuron fitting of the hidden layer, and the output results are obtained. A convolutional neural network (CNN) is a deep learning model specially used for processing multidimensional grid data, which maps the original input multidimensional data to the lower-dimensional feature space through convolution, pooling, and other operations. In this study, because the flow field can be expressed as 3D grid data, and the data of each spatial point is composed of the velocity component, the flow field characteristics can also be used as the input of CNN.
2.3. Multimodal Fusion Model
The multimodal fusion model can process and integrate multiple modal data at the same time. Compared with the traditional machine learning model, it can integrate the information and data of different modes, capture the correlation between different modes, and understand the complex scene more comprehensively. In this study, the multimodal model input is processed by early fusion and intermediate fusion. This paper constructs a multimodal fusion neural network model for predicting the performance of the SCR system. The overall structure is shown in Figure 1.
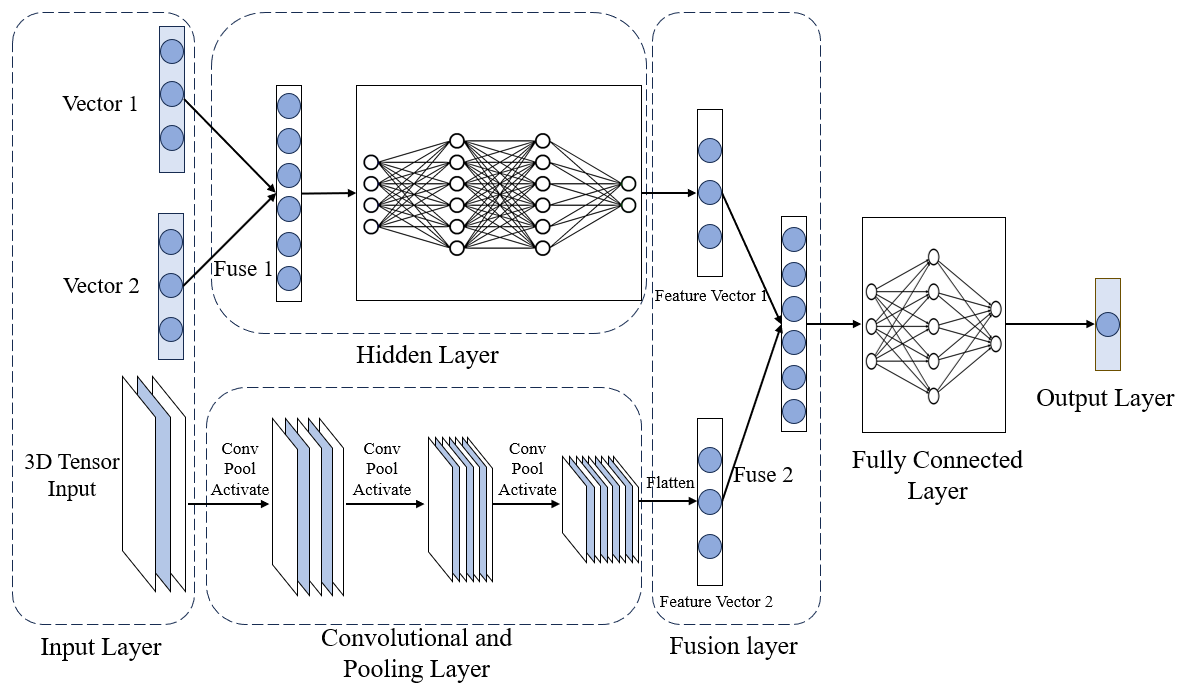
The model accepts multimodal inputs and mainly consists of three parts, as shown in Table 1. Because the input dimensions of experimental parameters and statistical indicators are the same, the model uses the early fusion method to splice the two features directly in the input layer. The multi-layer perceptron of the hidden layer processes the vector input after splicing, and the convolution and pooling layer processes the 3D flow field data input, and outputs two feature vectors respectively. The two feature vectors are spliced by the model in the fusion layer. The fused vectors pass through the full connection layer and get the predictive output at the output layer.
Summary of model input characteristics.
| Input Type | Specific Parameters |
|---|---|
| Experimental parameters | Engine speed, torque, fuel consumption, intake air flow, inlet temperature, original NOx concentration, urea injection rate |
| Flow field statistical indicators | Velocity uniformity, ammonia uniformity, pressure loss, average velocity of inlet section, maximum velocity of fluid domain, swirl intensity |
| 3D flow field data | Velocity component of each point in the characteristic section in the x, y, z directions |
3. Analysis of Flow Field Characteristics
3.1. Experimental and Simulation Parameters
In this study, various types of on-board SCR post processors are taken as the research object. The system is composed of an inlet pipe, a swirl mixing pipe, a spoiler, a catalyst carrier, an outlet silencing pipe, and other parts. In the experimental test, the aftertreatment system is connected to the diesel engine, recording the parameter input on the control instrument and the sensor reading after stabilization. Taking a compact postprocessor as an example, the effects of working conditions and structure adjustment on the flow field characteristics in the mixer were studied. Table 2 records the setting of working conditions in the bench test. From working condition 1 to working condition 3, the engine load gradually increases, and the exhaust temperature gradually increases. The urea injection volume is converted according to the intake air flow and the inlet NOx concentration. In the experimental test, it is set to 0.6~0.9 of the theoretical value at the time of complete reaction (i.e., ANR (Ammonia-to-NOx Ratio)), and the value is taken several times in this interval for the experiment.
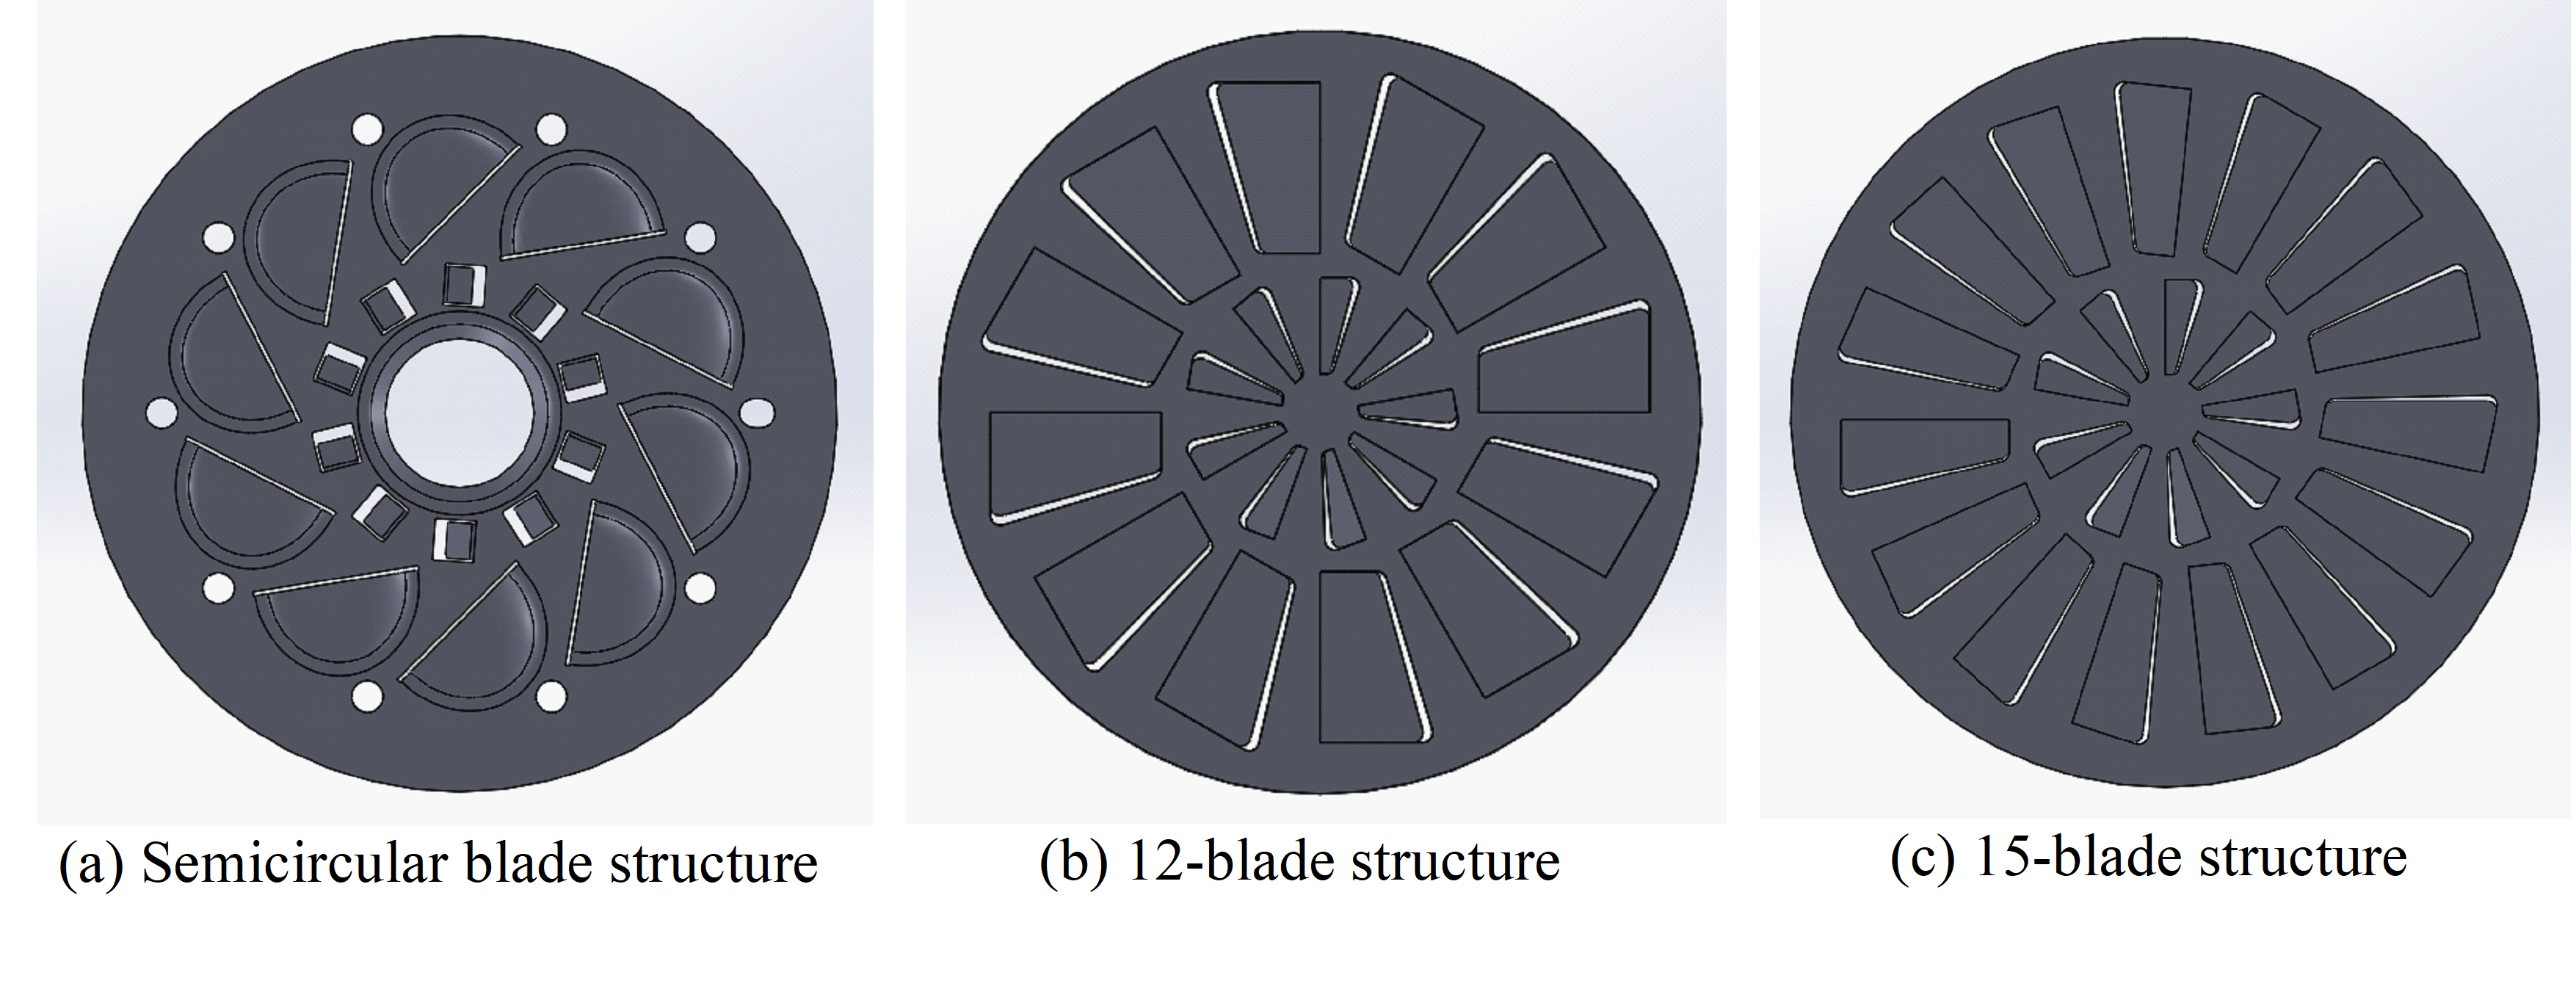
The structural adjustment of the compact postprocessor is mainly reflected in the change of the spoiler shape, as shown in Figure 2. The data obtained from the experimental test include the seven experimental parameters in Table 1 and the NOx concentration at the outlet. The NOx conversion efficiency is further calculated as the predictive variable of the model.
Experimental working conditions.
| Intake Air Flow (kg/h) | Inlet Temperature (℃) | Injection Quantity (ml/h) | Variation Interval of ANR | |
|---|---|---|---|---|
| Case 1 | 600 | 285 | 2370 | 0.6~0.9 |
| Case 2 | 1120 | 328 | 4098 | 0.6~0.9 |
| Case 3 | 1030 | 375 | 5046 | 0.6~0.9 |
Other flow field characteristics required by the model input are difficult to obtain through bench tests, so CFD simulation is used to obtain them. Model the fluid domain and simplify the geometric model. The polyhedral grid is used to divide the convective domain. The basic size is 6 mm, and the local densification size is 2 mm. The total number of grids is about 2 million. The steady-state flow in the fluid domain of three different post-processors is simulated, and the initial and boundary conditions of the calculation model are set according to the actual parameters of each working condition with a pressure-based solver.
3.2. Characteristic Statistics of Flow Field
The mixing efficiency between urea spray and fluid is determined by the flow field characteristics of the mixer, which is an important factor affecting the NOx conversion efficiency. Due to the particularity of the flow field characteristics, different from the conventional input parameters, it includes the distribution of multiple field variables, such as velocity, temperature, and pressure in the fluid domain, which cannot be directly quantified. Therefore, it is necessary to obtain multiple statistical indicators in the flow field as the input of the multimodal model. Six statistics, namely, the pressure difference between the inlet and outlet, the average velocity of the inlet section, the maximum velocity in the fluid domain, the swirl intensity of the mixer, the velocity uniformity at the inlet of the carrier, and the ammonia uniformity at the inlet of the carrier, are selected as the evaluation indicators of the flow field characteristics of the mixer. The specific analysis of these indicators is shown in Table 3.
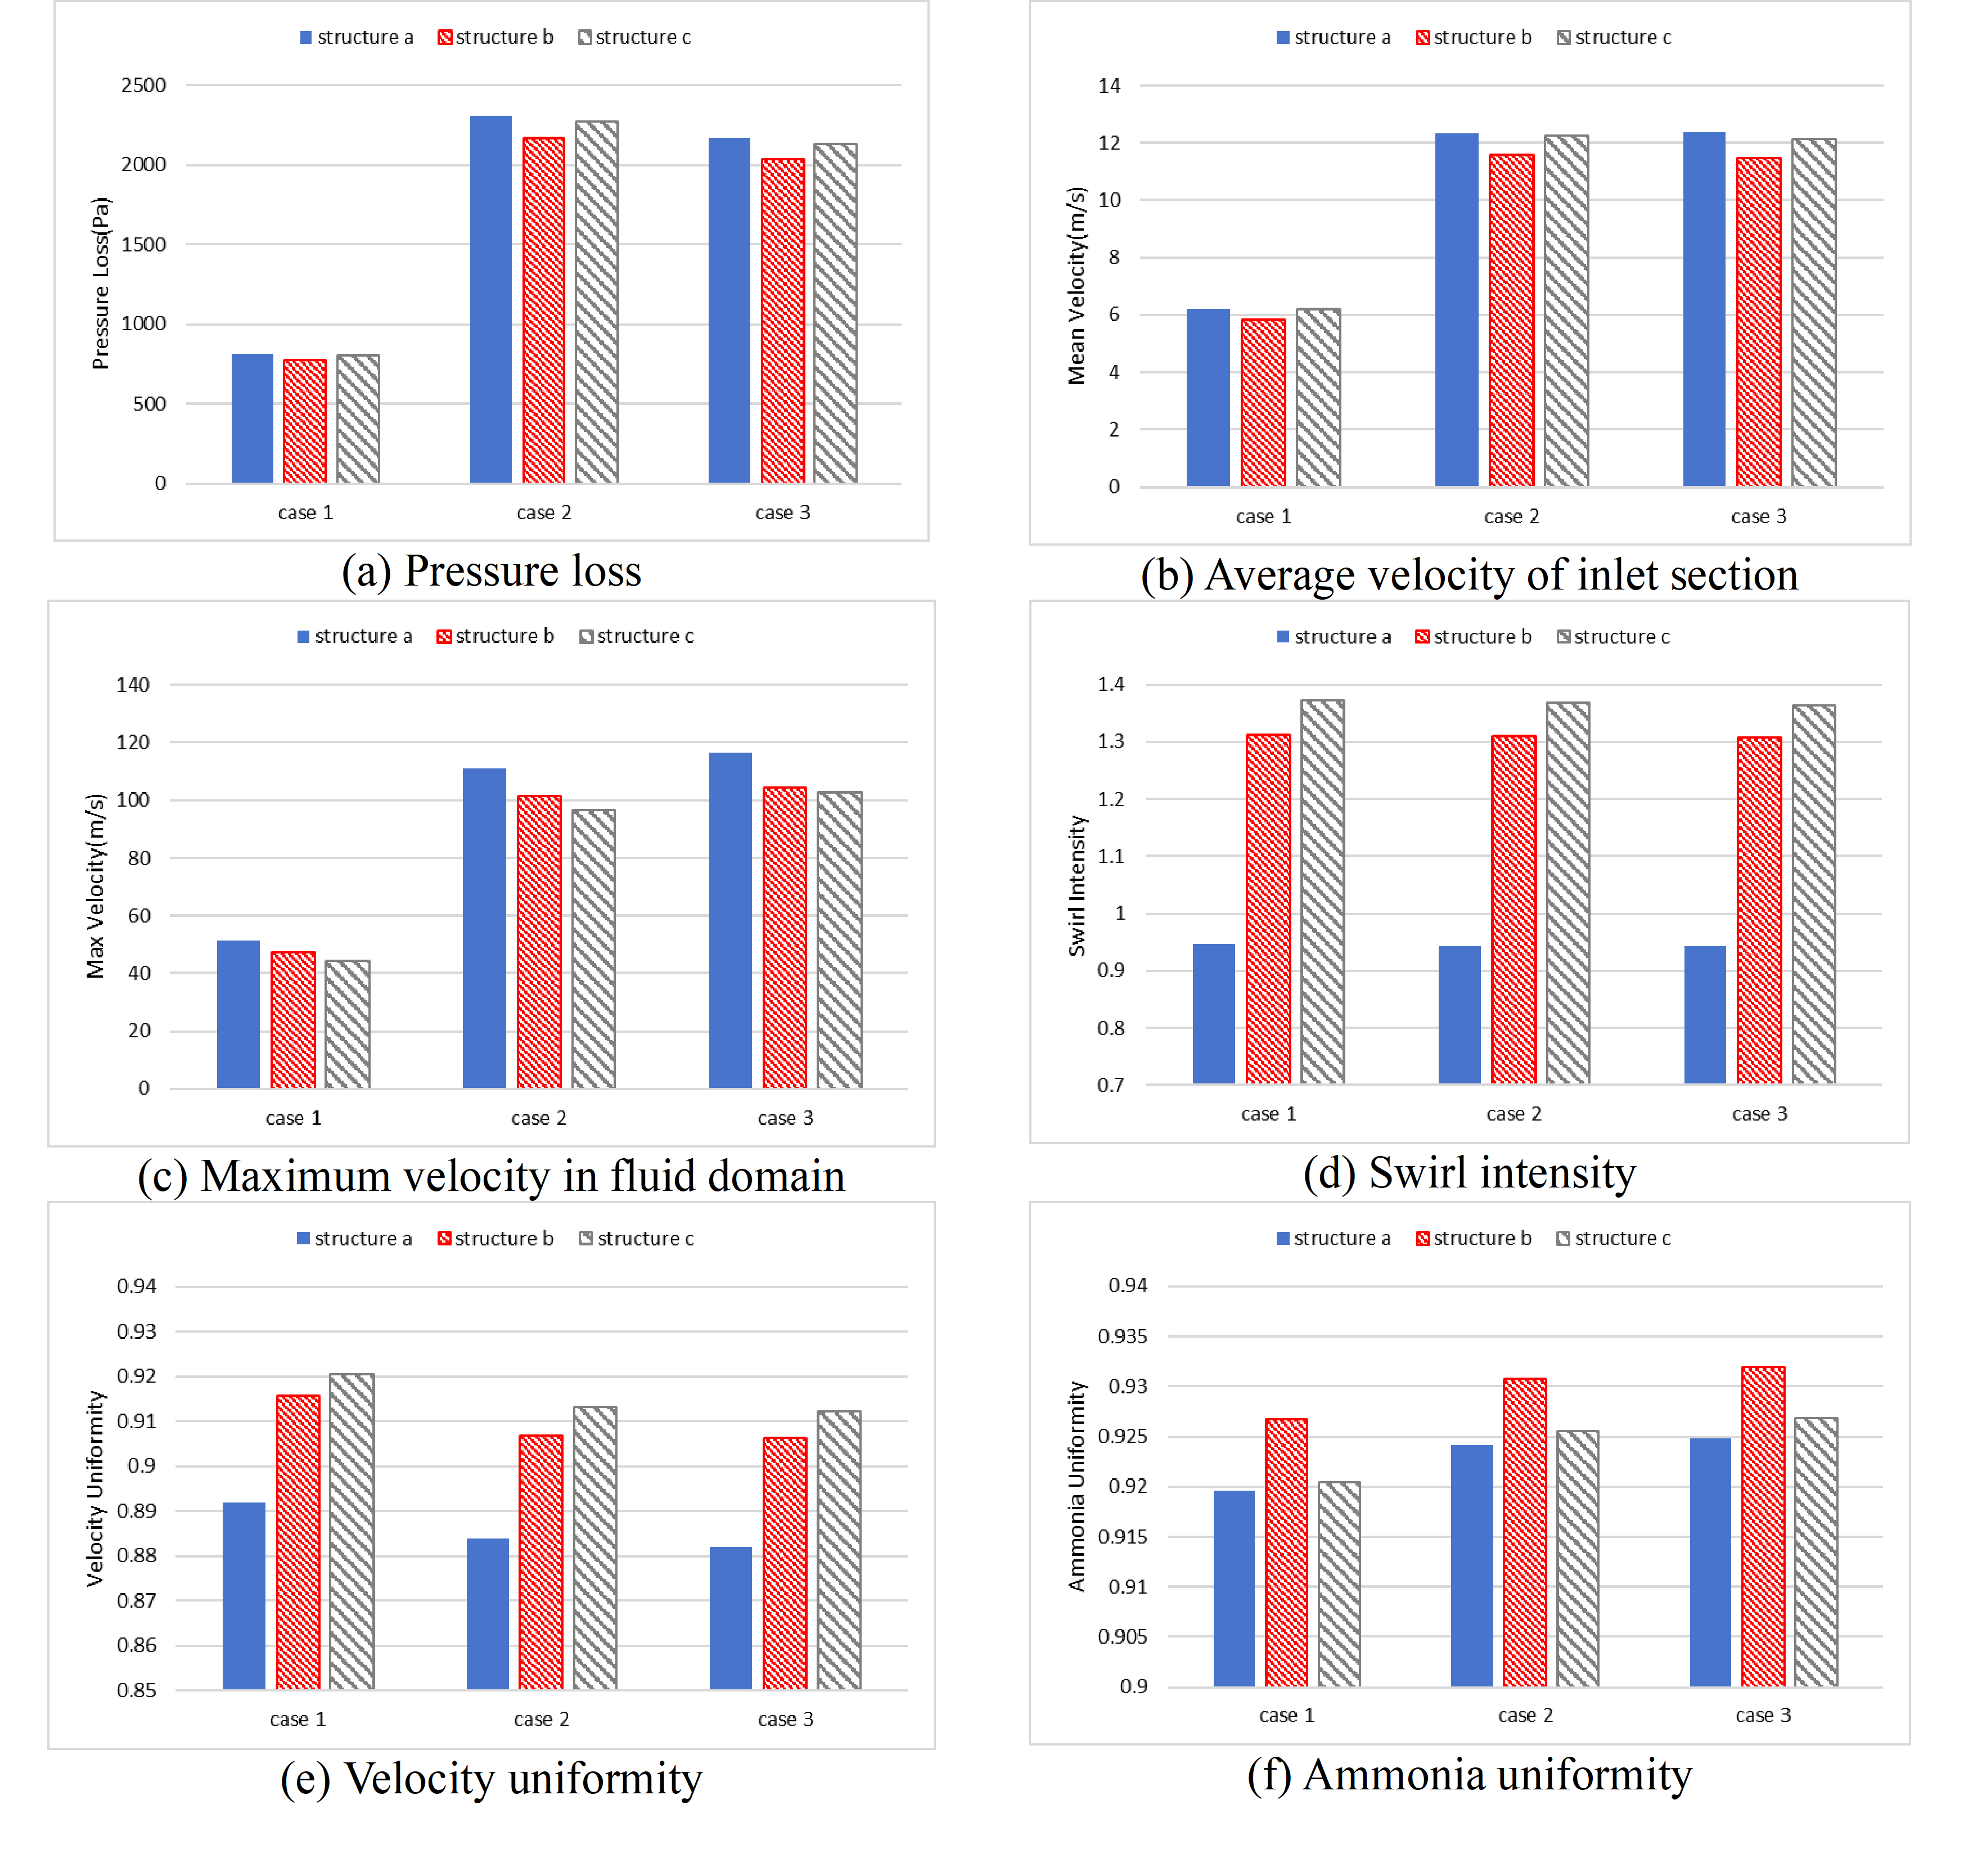
CFD simulation was carried out on three SCR mixers with different spoiler structures. The working conditions were consistent with the three experimental conditions, and the statistical results of six flow field characteristic indexes were obtained, as shown in Figure 3. Comparing the results of the first two groups, under the same working condition, the inlet and outlet pressure differences and the average velocity of the inlet section corresponding to the three spoiler structures have little difference, and the pressure difference and average velocity under the 12-blade structure are slightly lower than those of the other two structures. This is because, under the same working conditions, the flow at the inlet of the post-processor is constant, the flow resistance of the three structures has no obvious difference, and the air volume passing through the inlet section of the carrier per unit time will not change significantly. The maximum velocity in the fluid domain reflects the local flow intensity in the mixer, which is significantly affected by the mixer structure and operating conditions, and is positively correlated with the inlet flow. This index of the two-blade structures is lower than that of structure A, but the uniformity index is higher, which indicates that the appropriate local high velocity is conducive to the formation of swirling flow and the strengthening of aerosol mixing, which can promote the uniformity of the inlet. For the three indicators of inlet and outlet pressure difference, average cross-section velocity, and maximum velocity in the fluid domain, the impact caused by the change of working conditions is more obvious. When the exhaust flow and temperature increase, these three indicators increase significantly, and the increase of working conditions 2 and 3 relative to working condition 1 is more than 100%. For the swirl intensity, velocity uniformity, and ammonia uniformity, the influence of spoiler structure change is stronger than that of working condition. The swirl intensity in the mixer under the three structures is more than 0.6, so the air flow behind the spoiler is a strong swirl, and the swirl intensity of the two-blade structures is higher than that of the semi-circular blade structure, reaching more than 1.3. When the exhaust flow and temperature increase, the angular momentum flux and axial momentum flux will increase in equal proportion, so the change of working conditions has little effect on the swirl intensity. The velocity uniformity of the two-blade structures fluctuated around 0.91, while the uniformity of the semi-circular blade structure reached 0.89 only under the conditions of minimum exhaust flow and minimum temperature, and only about 0.88 under the conditions of high load. Further analysis shows that when the working load increases, the velocity uniformity at the carrier inlet will slowly decrease, and the uniformity difference between different mixer structures will be more significant. In terms of ammonia uniformity, the 12-blade structure was significantly higher than the other two structures, reaching 0.93, and the aerosol mixing effect was the best. With the increase in working load, the ammonia uniformity under the three structures increases slowly.
Analysis of key statistical indicators of flow field characteristics.
| Statistical Indicators | Functions and Analysis |
|---|---|
| Pressure loss | It reflects the flow resistance characteristics of the internal structure of the mixer. High resistance structures will significantly increase the pressure drop. |
| Average velocity of the inlet section | It directly determines the residence time of the mixed exhaust gas in the catalyst carrier section, affects the Reynolds number, and determines the flow state and mixing efficiency in the carrier. |
| Maximum velocity in the fluid domain | The high velocity region is often accompanied by high shear force and turbulent kinetic energy, which is the characterization of local flow intensity and corresponds to the energy loss concentration region. |
| Swirl intensity | It is a dimensionless parameter to characterize the rotation intensity of the flow field, and reflects the intensity of gas mixing in the front of the carrier. |
| Velocity uniformity | It reflects the design effect of the internal guide structure of the mixer, and quantifies the uniformity of the airflow velocity near the catalyst carrier and the contact efficiency between SCR reactants. |
| Ammonia uniformity | It reflects the uniformity of ammonia distribution in front of the carrier, determines the reductant concentration in contact with the carrier, and is the core parameter to ensure a high NOx conversion rate. |
3.3. Analysis of 3D Flow Field Data
CFD simulation is an important means to visualize the flow field characteristics of the post-processor. The 3D data of the flow field characteristics can be obtained by CFD calculation in the fluid domain, which can be used for the input of the multimodal model. In this section, taking condition 1 as an example, the velocity flow field distribution in the fluid domain under three kinds of spoiler structures is calculated, respectively, and the flow field data are visualized through cloud images.
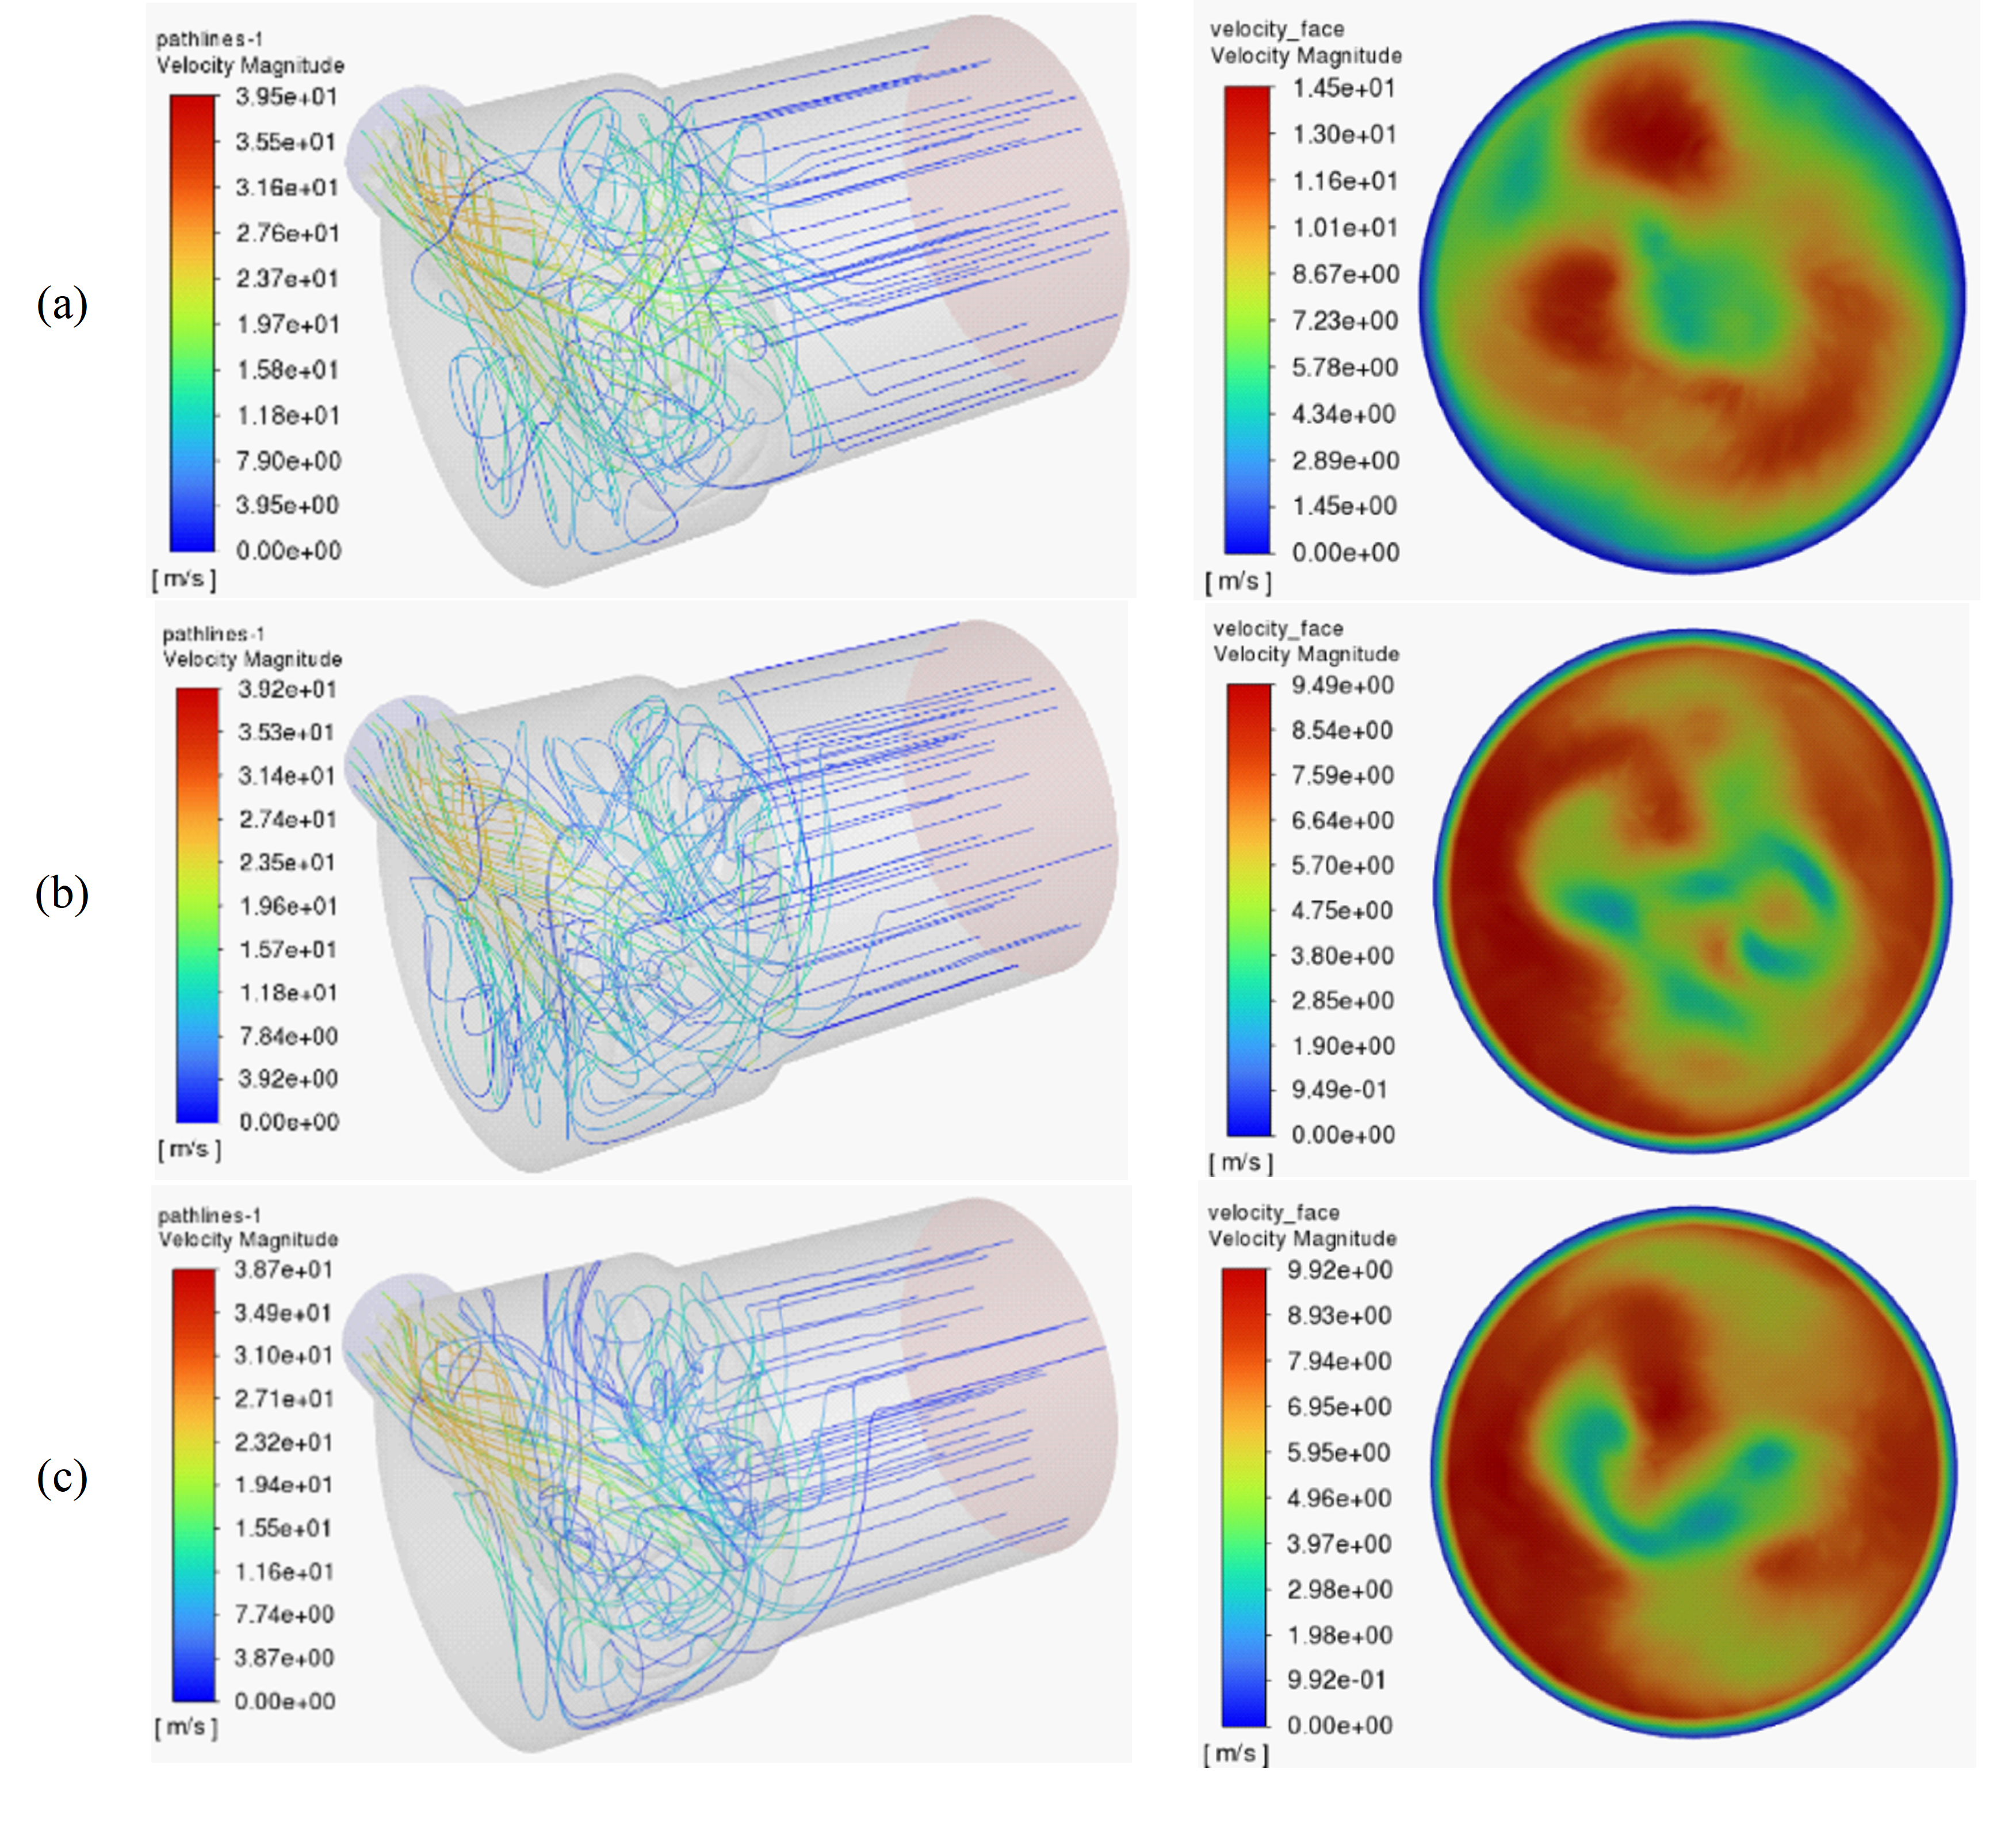
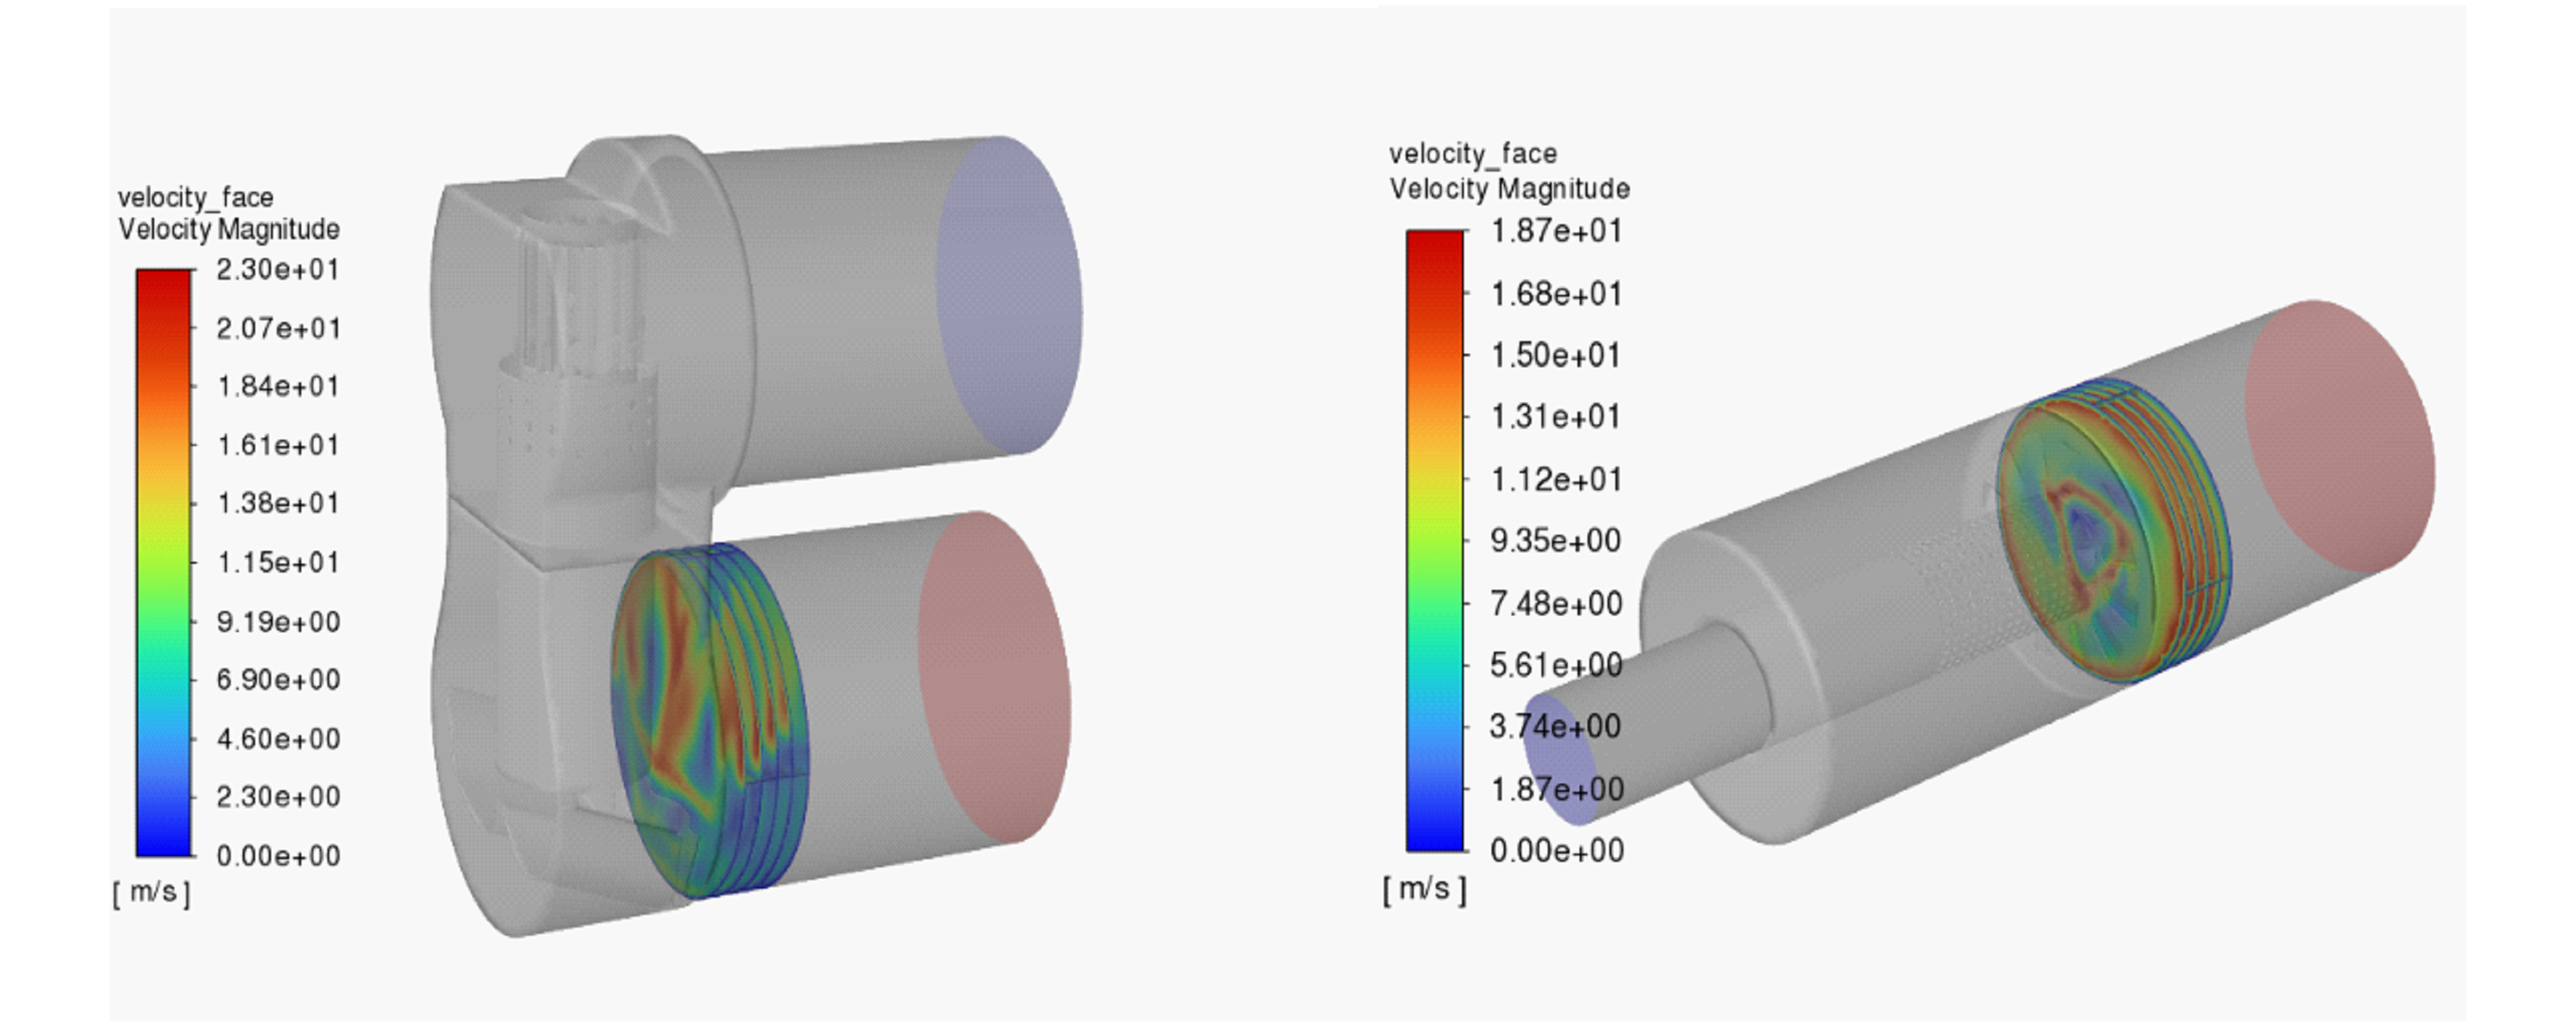
Figure 4 shows the velocity streamline diagram and the velocity distribution at the carrier inlet under three kinds of spoiler structures, and the streamline diagrams of the three are relatively similar. After passing through the annular guide vanes, the air flow at the inlet forms a preliminary swirl in the inlet pipe, and then leaves the swirl mixing pipe from the rows of holes at the end of the pipe, enters the main cylinder, and forms two obvious swirl at the upper and lower sides of the front end of the cylinder to strengthen the mixing again; After that, through the spoiler structure, the vortex is formed again under the action of the spoiler and enters the two-stage catalyst carrier area in turn; In the carrier region, due to the effect of porous media, the flow resistance in the X direction and Z direction increases significantly, while the flow resistance in the Y direction is small, so the streamline is almost parallel to the Y direction; After the air flow leaves the carrier area, it leaves the post processor from the outlet pipe.
The velocity distribution section at the entrance of the carrier can explain the distribution of fluid velocity at the section. The redder it is, the greater the velocity is. The color near the cylinder wall is blue, indicating that the flow velocity near the wall is close to 0. Comparing the three circular cross-sections, it can be seen that the velocity in the peripheral and central areas of structure A is small, while the velocity in the annular area between them is large. The annular area is consistent with the position of the semicircular bulge on the spoiler. There is obvious color stratification between the inner and outer areas, and the velocity uniformity is poor; The Red areas in the cross-section of the other two structures are more widely distributed. Except for the boundary layer near the wall, the color difference between the inner and outer areas is not obvious. Only a small number of low-speed green areas appear in the area with dense swirling flow in the middle, and the rest are red or yellow, with high uniformity. It can be concluded that the straight blade structure has a better turbulence effect than the semicircular convex structure, and can significantly improve the velocity uniformity of the carrier inlet section.
The velocity field in the fluid domain can be expressed as 3D grid data, and the data of each spatial point is composed of the velocity components
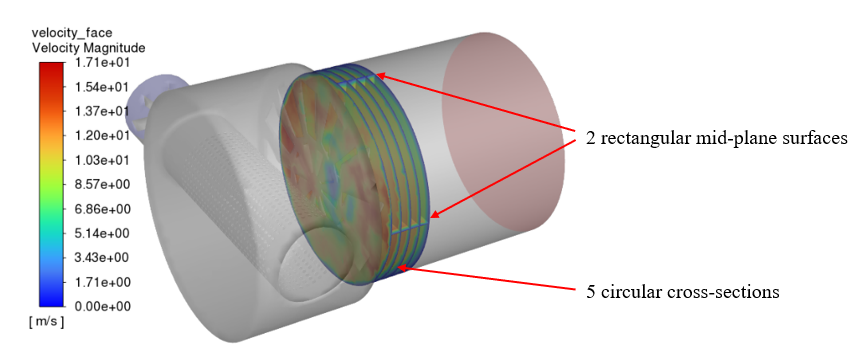
in three directions, which are used as the input of the model convolution. Due to the large number of grids in the fluid domain, if the velocity component of each point in the space is exported as input, it will lead to a huge amount of calculation for model training, and the amount of data is too large to store and read. On the other hand, when a whole space flow field is directly input, the model is difficult to accurately capture the key characteristics of the flow field, resulting in low computational efficiency. In order to balance the model accuracy and calculation cost, multiple characteristic sections were selected from the cylindrical mixing region in front of the SCR carrier, and multiple 2D slices were used to replace the velocity field in the whole 3D space. The selection of sections is shown in Figure 5, including two rectangular sections perpendicular to each other at the central axis and five circular sections perpendicular to the central axis. The original velocity field data at the characteristic section is derived, and the 3D tensor data is obtained by interpolation fitting, and the velocity field data is encapsulated as the input of the multimodal model convolution layer.
The airflow velocity distribution in this mixing space directly determines the mixing quality of ammonia and exhaust gas, and affects the overall performance of the SCR system. The airflow forms high-intensity swirls in the cylindrical fluid domain behind the spoiler, which further promotes the mixing of aerosol and the pyrolysis of urea, and finally forms a stable concentration field and velocity field at the entrance of the carrier, providing fully mixed reactants for the carrier section. If the velocity distribution of the flow field in this area is seriously uneven, the ammonia produced by urea pyrolysis will form a concentration difference with the gas flow, resulting in a decrease in ammonia uniformity at the inlet of the carrier. On the other hand, the uneven velocity field will further affect the flow and reaction process inside the SCR carrier. In order to improve the versatility of the model, learn the flow field characteristics in more complex scenes, and predict the NOx conversion efficiency of the post-processor, post-processors with other structures are also added to the model training, as shown in Figure 6. Their bench test data, statistical indicators of flow field characteristics, and 3D velocity flow field in the mixed space at the front of the carrier are added to the training data set.
4. Analysis of Multimodal Model Results
4.1. Input Feature Selection
In the task of data analysis and machine learning, data feature selection is particularly important. It can select the most informative features from the original data, reduce the dimension of the feature space, and retain the important information in the data as much as possible. Feature selection has a positive impact on simplifying the model, improving the generalization ability of the model, and reducing the training time, so as to improve the comprehensive performance of the model. As a feature selection method based on information theory, mutual information (MI) can effectively identify the nonlinear relationship by quantifying the statistical dependence between features and target variables. Its core idea is to calculate the amount of information shared between features and targets. The greater the amount of information, the greater the contribution of features to the prediction target. The calculation method of mutual information between two variables is as follows:
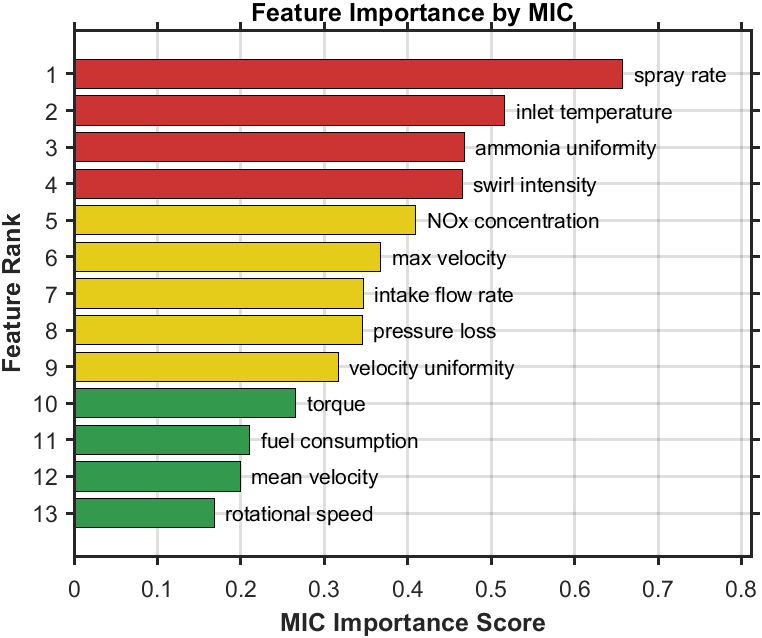
After obtaining the experimental and simulation data, the correlation analysis between the post-processor experimental parameters, feature variables, and conversion efficiency is carried out by the mutual information method, and the importance of MIC of each index and prediction result as a candidate feature is calculated. In this study, mutual information analysis was carried out for different input parameters obtained from experiment and simulation. The sorting results of MIC are shown in Figure 7. According to the MIC evaluation, among all input characteristics, the correlation between urea injection rate and NOx conversion efficiency is the strongest, which is significantly higher than other characteristics. This is because the urea injection rate directly determines the reductant concentration at the inlet of the catalyst carrier. The higher the reductant concentration, the more thorough the NOx conversion. The inlet temperature, ammonia uniformity, and swirl intensity also affect the distribution of reductant in the catalyst support, so the MIC of these three indicators is also high. However, the engine torque, speed, fuel consumption, and average speed of the carrier inlet section have little correlation with the prediction results, and the MIC is lower than 0.3. These features will be removed in the formal model training to reduce the amount of calculation in the training process. Finally, the input indexes of the model include four scalar inputs (urea injection rate, aftertreatment inlet temperature, original NOx concentration, and inlet flow) recorded from the bench experiment, five key statistics of flow field characteristics (ammonia uniformity, swirl intensity, maximum velocity in the fluid domain, inlet and outlet pressure difference, and velocity uniformity), and 3D velocity field data of the characteristic section of the flow field.
4.2. Model Training
Through extensive experiments and simulations in the early stages, a total of 300 sets of data corresponding to input features and output results were ultimately obtained. Before the model training, the experimental parameters, flow field statistics, and 3D flow field data were preprocessed. In this study, the Min-Max normalization algorithm is used to process the data, and the value range of each input index is scaled to [−1, 1]. The normalization formula is as follows:
Due to the variability of the velocity field, even in the steady state, the velocity and direction of the fluid will change slightly. To make the flow field input more appropriate to the actual situation and improve the robustness of the model, Gaussian noise with a standard deviation of 0.005 should be added to the 3D flow field data of all samples in the pre-processing. To test the performance of the model and prevent over-fitting, all sample data are divided into two parts, 85% for training the model, and 15% for testing the accuracy of the prediction results of the model after training. The mean square error (MSE) is used as the loss function to quantify the deviation between the predicted value and the real value. The gradient descent method is used to adjust the weight and bias of each connection layer, and the loss function is gradually minimized by combining the Adam optimizer and the learning rate attenuation strategy for iterative optimization. The process iterates repeatedly until the model converges, and finally, a prediction model with strong generalization ability is obtained.
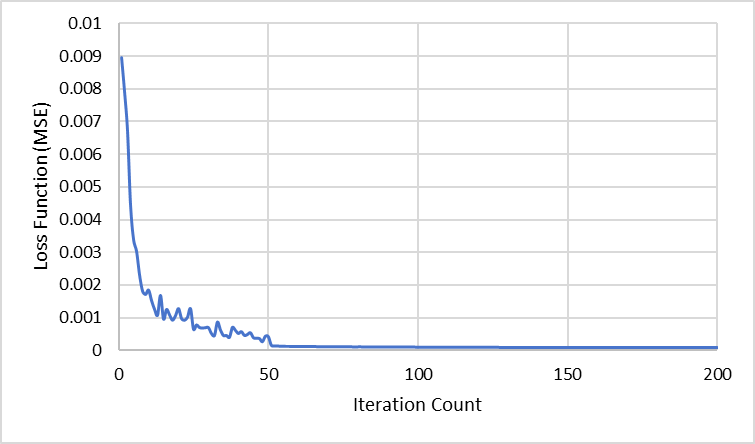
Key hyperparameters in neural network training include learning rate, number of epochs, and loss function. The loss function curve in the model training is shown in Figure 8. The training lasts for 200 rounds. Before the 15th iteration, the model starts from the weight of random initialization, quickly learns the salient features of the training set, the gradient direction is clear, and the training error decreases rapidly. After reaching the middle stage of training (15 to 50 rounds), the decline rate of training error slows down. The model changes from learning rough features to fine adjusting weights to fit the subtle differences under complex working conditions. At the same time, the learning rate in the training process is adaptively adjusted by the Adam optimizer to make the model jump out of the local optimum. Due to the randomness of the gradient descent method, the medium-term curve fluctuated slightly, but the overall trend gradually decreased. After 50 rounds of iteration, the model training entered the late stage, the curve gradually flattened and tended to converge, and the final loss function MSE was stable around 0.000086, and the fluctuation amplitude was less than 1%, and the model training was completed.
4.3. Model Prediction Results
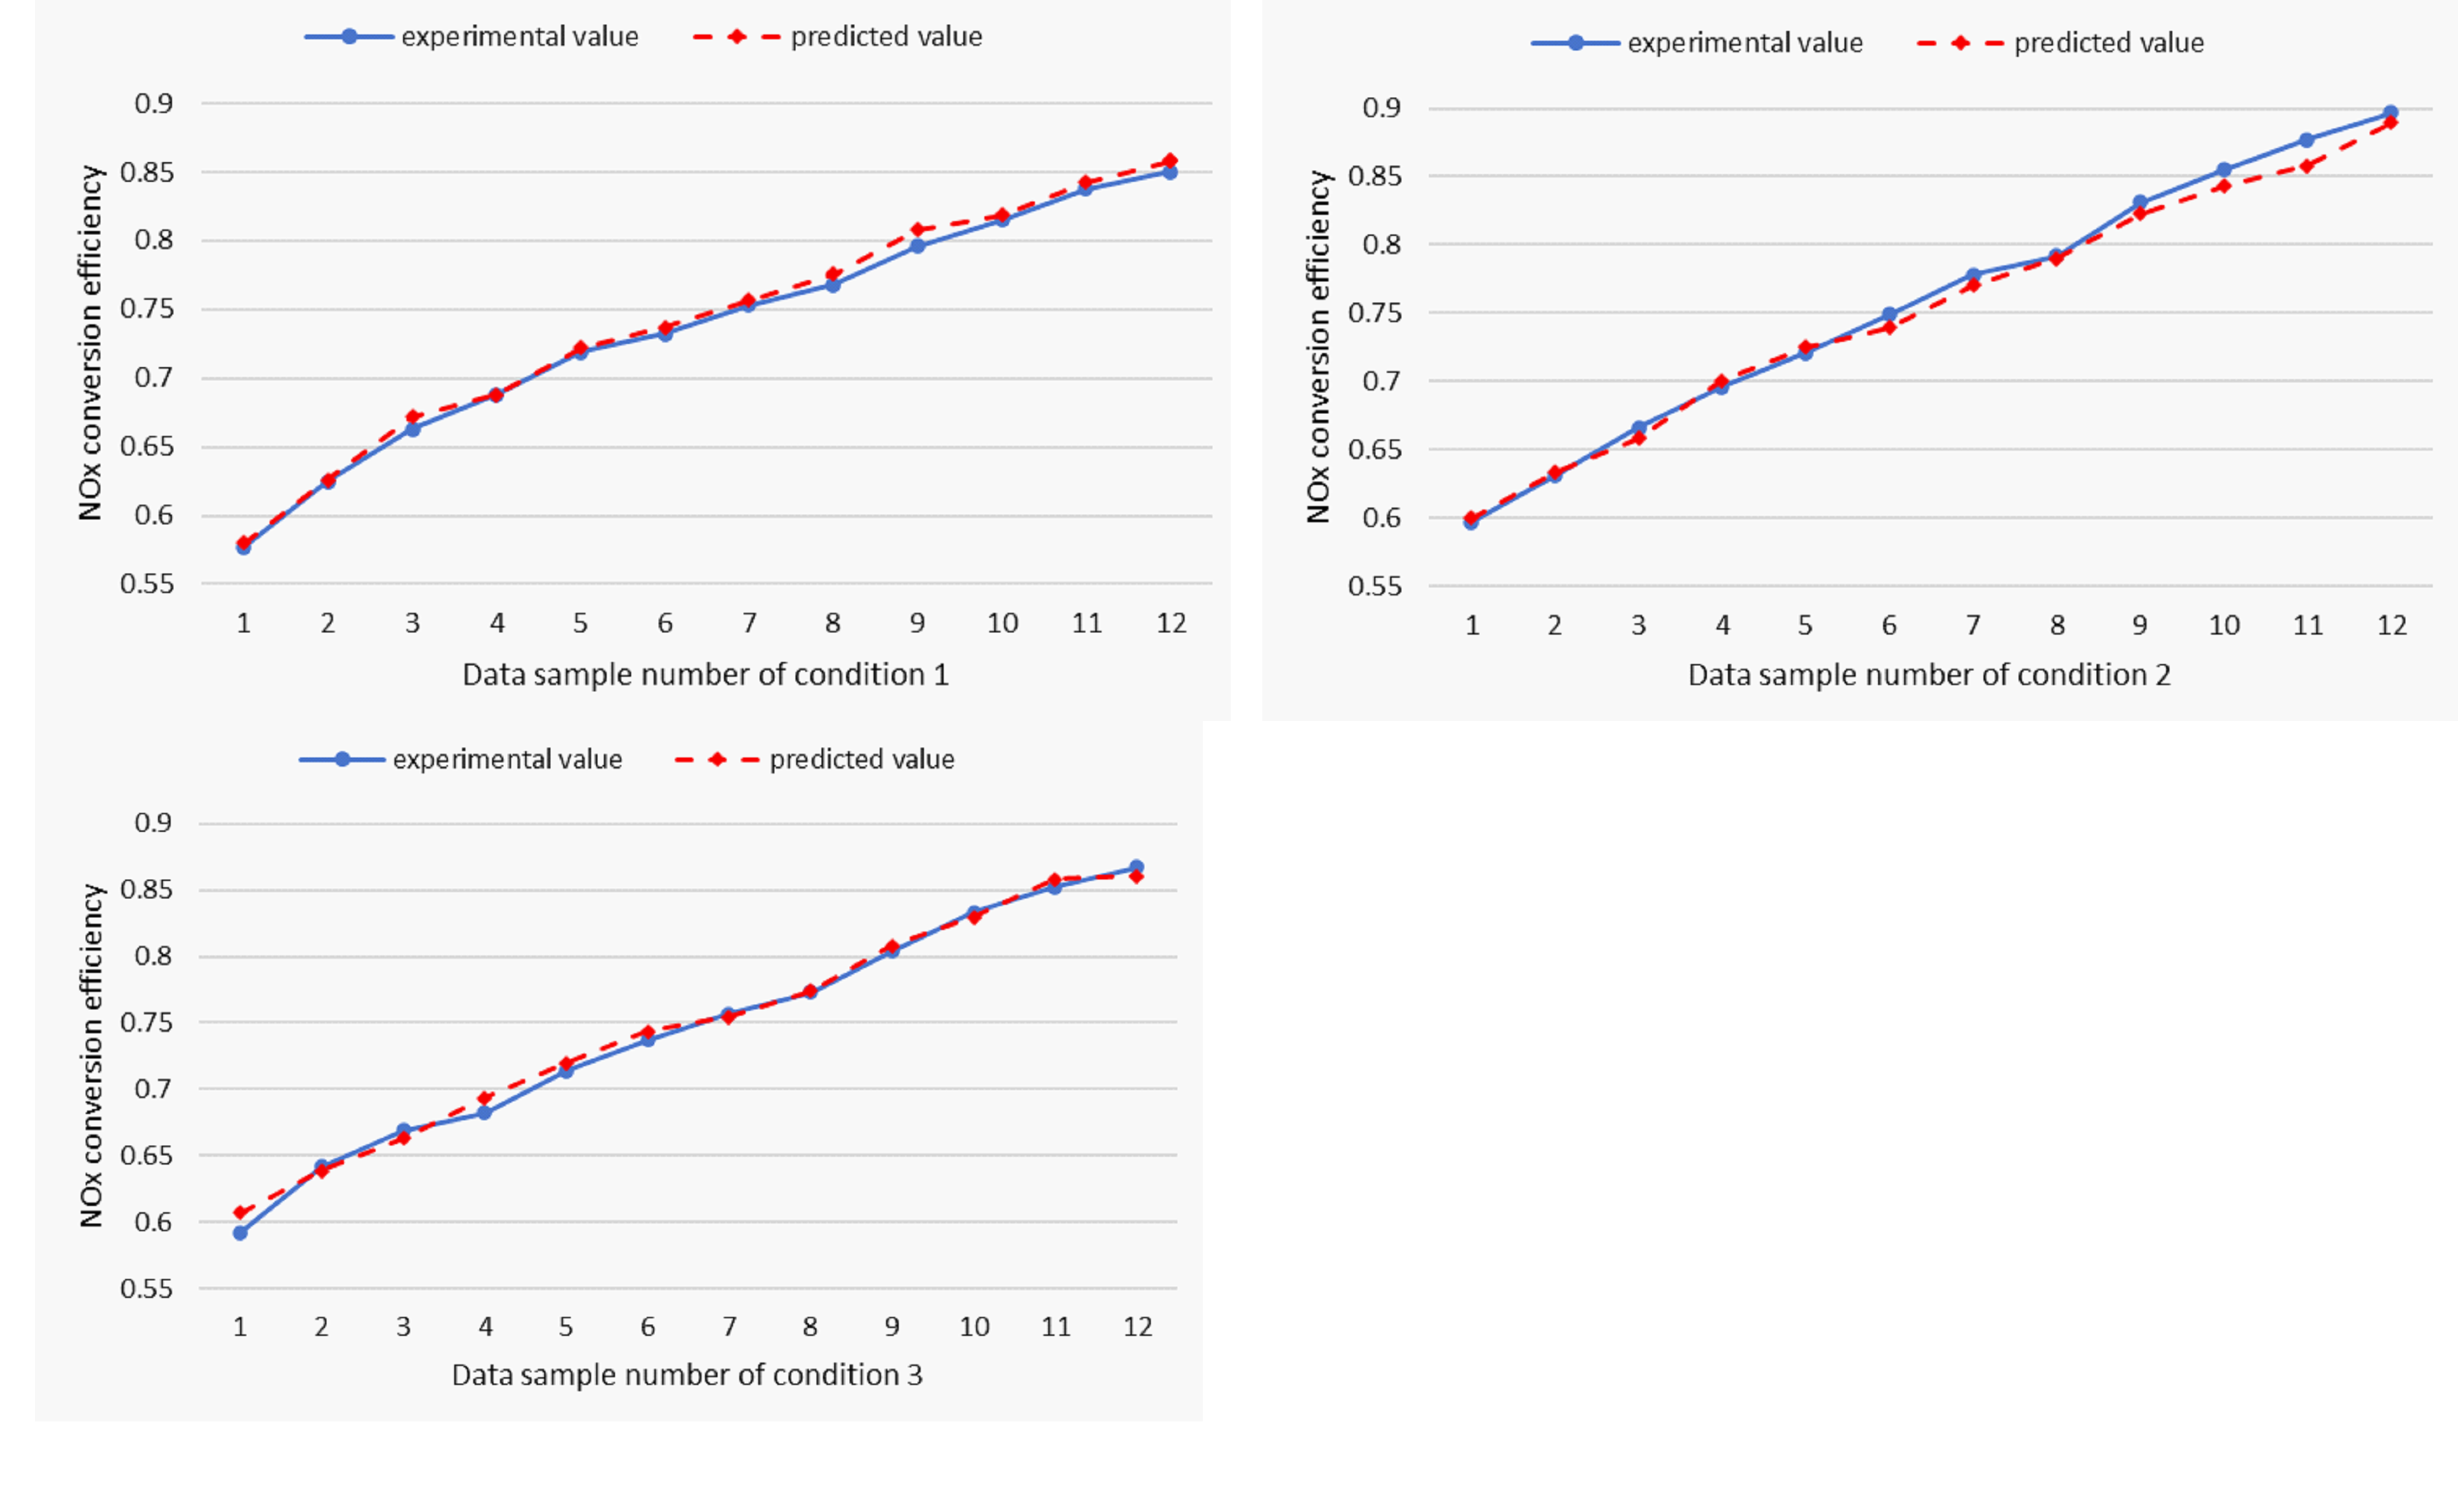
After the training of the multimodal model, the prediction performance of the model is tested through the test set. Under the structure of a 12-blade spoiler, the data set of SCR system conversion efficiency gradually changing with ANR in the range of [0.6, 0.9] is selected as the test set, and the working conditions of the test set are shown in Table 4. Figure 9 shows the comparison between the actual conversion efficiency of the test set and the predicted value of the model under three working conditions. Under the same working conditions, the larger the ANR, the larger the sample number. With the gradual increase of ANR, the actual efficiency and predicted efficiency showed an upward trend, but the upward gradient gradually slowed down. This proves that while the NOx conversion efficiency is improved, the conversion efficiency of urea is gradually reduced, and further improving the ANR may lead to excessive reductant, resulting in crystallization, ammonia leakage, and other risks. The similarity between the predicted value line and the experimental value line is high, and their change trends are consistent. The sample points fluctuate within a reasonable range on both sides, indicating that the model has comprehensively learned the input characteristics under different working conditions.
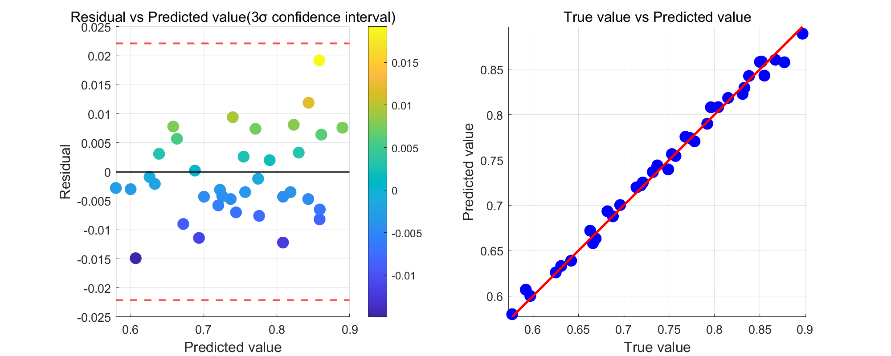
In this study, the average absolute percentage error (MAPE) was used to evaluate the prediction performance of the model. Under the three working conditions, the average error between the predicted value and the real value of NOx conversion efficiency were 0.67%, 0.92% and 0.85%, respectively, and the maximum values were 1.53%, 2.19%, and 2.52%, respectively, which were within a reasonable range. Further carry out residual analysis on the prediction results of the model, and the residual figure is shown in Figure 10. The residual points are randomly scattered below the reference line of 0 value, without obvious aggregation or interval pattern, and all residual points are within the 3σ confidence interval; The vertical width of the residual point distribution should be basically consistent in the whole range of the predicted value, and the fluctuation amplitude of the error does not change with the size of the predicted value; The sample points of true value predictive value are evenly distributed on both sides of the ideal line, and the change rule is consistent with the ideal line. To sum up, the test results did not produce a significant systematic deviation. The trained multimodal model can better learn the mode in the data, and effectively predict the SCR system conversion efficiency and outlet NOx concentration.
Experimental working conditions.
| Intake Air Flow (kg/h) | Inlet Temperature (℃) | Variation Interval of ANR | |
|---|---|---|---|
| Test case 1 | 610 | 290 | 0.6~0.9 |
| Test case 2 | 1169 | 327 | 0.6~0.9 |
| Test case 3 | 1068 | 377 | 0.6~0.9 |
Compared with the traditional repetitive experiment and CFD simulation method, this model can realize the rapid prediction of SCR system evaluation index, and the response time is significantly reduced. Originally, the development process of SCR system required a large number of simulation calculations for a variety of working conditions. The calculation of each working condition was more than 10 h (including chemical reaction mechanism), and the workstation performance requirements were high. Now it only takes a few hours to migrate and learn the trained model, which can realize the second level prediction of conversion efficiency, saving more than 70% of the time cost. On the other hand, the trained model can quickly optimize the optimal input parameters under changing conditions, and realize the precise control and adaptive adjustment of SCR system.
5. Conclusions
In this paper, combined with the CFD flow field characteristics of SCR system and the multimodal fusion machine learning model, the performance indicators of the post processor are evaluated and predicted.
The model accepts multimodal data input, including conventional experimental parameters, flow field characteristic evaluation index and 3D flow field data. The rationality of flow field characteristic index selection is proved by analyzing CFD results. Based on the mutual information method, the importance of each feature is evaluated, and the parameters with high correlation with the post processor conversion efficiency are selected as the input of the prediction model. On this basis, the neural network model is built. The back-propagation algorithm and Adam optimizer are used to optimize the model’s hyper parameters. After training, the performance of the model is verified by the test set data. The experimental results show that the fitting effect is good, the average error is less than 1%, and all residual points are within the 3 σ confidence interval. The model can accurately predict the NOx conversion efficiency, reduce the time and cost, and realize the rapid evaluation of the performance indicators of the on-board SCR system.
Author Contributions
C.Z. and C.G.: conceptualization, methodology, software; C.Z.: data curation, writing—original draft preparation; F.S.: visualization, investigation; H.L.: supervision, writing—reviewing and editing. All authors have read and agreed to the published version of the manuscript.
Funding
This research received no external funding.
Institutional Review Board Statement
Not applicable.
Informed Consent Statement
Not applicable.
Data Availability Statement
Data will be made available on request.
Conflicts of Interest
The authors declare no conflict of interest. Fulin Shi and Chao Gao were employed by the company Wanxiang Tongda Co., Ltd. The remaining authors declare that the research was conducted in the absence of any commercial or financial relationships that could be construed as a potential conflict of interest.
Use of AI and AI-Assisted Technologies
No AI tools were utilized for this paper.
References
- 1.
Liu, F. Development trends of commercial vehicles under carbon neutrality. Times Automob. 2024, 11, 22–24. (In Chinese)
- 2.
Liu, Y.; Ren, X.; Lu, X.; Wu, F.; Deng, J.; Gui, L.; Chen, C. Optimization analysis of urea mixer for China VI aftertreatment system. Mod. Veh. Power 2024, 3, 19–25. (In Chinese)
- 3.
Chen, Z.; Liu, H.; Yang, X.; Wang, T. Research progress on selective catalytic reduction technology for diesel engines. Energy Environ. Prot. 2023, 37, 68–75. (In Chinese)
- 4.
Yao, A.; Yao, C. Study of Diesel/Methanol Dual Fuel Combustion in CI Engines and Its Practice in China. Int. J. Automot. Manuf. Mater. 2023, 2, 2.
- 5.
Chen, S.; Wang, Z.; Liu, Z.; Yang, X.; Wang, H. Time-Dependent Vehicle Speed Variation Based Global Path Planning for Intelligent Connected Vehicles. Int. J. Automot. Manuf. Mater. 2023, 2, 5.
- 6.
Brosnan, P.; Tian, G.; Montanaro, U.; Cockerill, S. A Comprehensive Review of the Free Piston Engine Generator and Its Control. Int. J. Automot. Manuf. Mater. 2023, 2, 6.
- 7.
Wang, C.; Jin, S.; Deng, J.; Ding, W.; Tang, Y.; Li, L. Future High-Efficiency and Zero-Emission Argon Power Cycle Engines: A Review. Int. J. Automot. Manuf. Mater. 2023, 2, 2.
- 8.
Zhao, Z.; Liu, Z. Research on Cooperative Control Strategies for SCR Denitrification Systems Based on Deep Reinforcement Learning. J. Chin. Soc. Power Eng. 2024, 44, 802–809.
- 9.
Zhang, Z.; He, Z.; Wang, Y.; Jiang, F.; Zhong, W.; Zhang, B.; Ye, Y.; Yin, Z.; Tan, D. An artificial intelligence optimization of NOx conversion efficiency under dual catalytic mechanism reaction based on multi-objective gray wolf algorithm. Fuel Process. Technol. 2025, 268, 108182.
- 10.
Gulsevincler, E.; Usal, M.R.; Yilmaz, D. The effects of structural parameters on tangentially injected highly swirling turbulent tube air flow. SN Appl. Sci. 2019, 1, 835.


This work is licensed under a Creative Commons Attribution 4.0 International License.
 Suite 4002 Level 4, 447 Collins Street, Melbourne, Victoria 3000, Australia
 General Inquiries: info@sciltp.com