
Lean combustion improves thermal efficiency by increasing the specific heat ratio and reducing pumping and heat transfer losses. However, it is limited by the lean-burn limit. Among potential solutions, pre-chamber turbulent jet ignition (TJI) combines high-energy ignition and mixture stratification, offering large ignition energy and fast flame propagation. An active pre-chamber, equipped with a fuel injector to precisely control the mixture, is more complex than a passive one but significantly extends the lean-burn limit, thereby improving efficiency and reducing emissions. Using 3D Computational Fluid Dynamics (CFD) method with detailed chemical kinetics, this study investigates the effects and underlying mechanisms of pre-chamber injection pressure, timing, and spark plug position on combustion in a hybrid dedicated gasoline engine. Injection pressure governs mixture formation: low pressure causes poor atomization; high pressure reduces mixing efficiency due to small pre-chamber volume; moderate pressure provides a near-stoichiometric mixture at the spark plug. Injection timing trades off mixture homogeneity and combustion phasing: too early leaks mixture to the main-chamber; too late causes stratification; moderate timing achieves a well-mixed pre-chamber charge and symmetric rapid jet flames, yielding higher peak pressure and internal thermal efficiency. Changing spark plug position has two distinct effects. First, altered pre-chamber geometry affects fuel diffusion and mixture distribution. Second, shifted flame kernel location influences flame propagation and jet symmetry. However, when the mixture is highly non-uniform, the kernel location effect is masked. Thus, pre-chamber design must ensure a uniformly distributed, combustible mixture while minimizing fuel leakage to the main-chamber.
- Open Access
- Article
Investigation of the Influence of Active Pre-Chamber Fuel Injection Strategy Considering Flame Kernel Position on the In-Cylinder Combustion
- Shaotong Wang 1,2,
- Yang Lv 3,
- Tianyang Liu 4,
- Qiuyu Liu 1,2,
- Xikang Zhang 5,
- Jiayang Wang 1,2,
- Zhe Kang 1,2,*
Author Information
Received: 26 May 2026 | Revised: 12 Jun 2026 | Accepted: 16 Jun 2026 | Published: 02 Jul 2026
Abstract
Keywords
hybrid dedicated gasoline engine | lean combustion | active pre-chamber | indicated thermal efficiency
1. Introduction
In response to severe climate and emission issues, many countries are formulating and introducing stringent emission regulations. In this context, the growth of the market share of hybrid vehicles takes on significant practical significance. This technology optimizes the energy management strategy, effectively alleviating the fuel consumption and emission problems of traditional internal combustion engines (ICEs) [1,2]. The lean combustion technology enhances thermal efficiency of hybrid vehicles as a result of an elevated specific heat ratio, while also helping reduce energy losses [3]. However, it is limited by the lean combustion limit, making it difficult to optimize engine efficiency further. Currently, potential solutions are mainly classified into three categories: high-energy ignition [4], mixture stratification technology [5], and composite fuel [6]. Pre-chamber (PC) turbulent jet ignition (TJI) combines the first two methods, and due to its outstanding advantages such as large ignition energy and fast flame propagation speed, it has received extensive research [7,8,9,10].
There are two main types of small-volume PC ignition systems, namely passive and active. A passive PC contains only a spark plug and relies on mixture from the main-chamber (MC) during compression. It’s suitable for high-load, high-compression-ratio conditions but unable to further extend the lean-burn limit [11]. In contrast, an active PC adds an auxiliary fuel injector, which can create a richer mixture and enables more precise equivalence ratio control, thereby achieving more extreme lean combustion [12,13].
Zhang et al. [14] found that with the excess air ratio of 1.7, as the PC injection pressure gradually increased from 4 MPa to 10 MPa, ignition stability increased, combustion duration shortened, and gross thermal efficiency rose. However, excessive pressure would also lead to a significant fuel wet-wall effect, resulting in deteriorated emissions. Zhu et al. [15] conducted experiments under fuel injection pressures of 10 MPa and 17 MPa, and found that under early injection and homogeneous mixture conditions, the effect on PC combustion characteristics is limited. They also pointed out that when a stratified mixture is formed using a late injection strategy, the injection pressure may have a more significant influence on PC performance. Under an excess air ratio of 1.7, Wang et al. [16] experimentally demonstrated that higher fuel injection pressure improves mixture homogeneity in the PC, thereby enhancing lean combustion stability. They identified the mid-compression stroke as the optimal injection window. By injecting fuel at this point to leverage the upward airflow, a stratified mixture with a richer upper zone and a leaner lower zone is effectively formed within the PC.
Validi et al. [17] defined the TJI combustion process as comprising three main stages: the cold fuel jet, turbulent hot product jet, and reverse fuel-air/product jet. Hua et al. [18] recommended setting the PC fuel injection timing during the early compression stroke to both ensure proper mixture formation within the PC and prevent its diffusion into the MC. Kou et al. [19] investigated the effect of injection timing on the combustion of a passive PC engine. An injection timing of −210 crank angle degree (°CA) resulted in the optimal mixture concentration in the PC, the shortest ignition delay, and the highest peak cylinder pressure and heat release rate. In contrast, late injection (−120 °CA) and early injection (−270 °CA) led to slightly poorer combustion performance due to severe mixture stratification in the MC and an overly lean mixture in the PC, respectively. Bunce et al. [20] confirmed through computational fluid dynamics (CFD) simulation that early fuel injection leads to “excessive mixing” in the PC, which is caused by the increase in evaporation and mixing time. Consequently, an overly lean mixture may form near the spark plug, which elevates the misfire risk. Considering that the background pressure in the PC is lower during the early fuel injection, a large amount of auxiliary fuel may overflow the PC before the ignition. Therefore, the preference for late-compression stroke injection lies in its ability to create an ignitable mixture near the spark plug and maximize fuel concentration in the PC, which came at the cost of reduced time for fuel evaporation. This trade-off necessitates optimization of the injection timing based on key parameters, including injector location, injection volume, air-fuel ratio, and engine operating conditions.
In contrast to spark ignition (SI) engines, Sementa et al. [21] noted that asymmetric jets lead to more pronounced uneven combustion in the MC of engines using a PC. Chen et al. [22] found that weak asymmetric flame jets can elevate the knock risk. Rajasegar et al. [23] demonstrated that the spark plug position determines the starting point and path of flame propagation within the PC, and variations in local mixture concentration can amplify this effect. This leads to inconsistent exhaust timing among different orifices, resulting in asymmetric flame jets and consequently deteriorating combustion. Numerical simulations by Zhao et al. [24] on asymmetric jets in active PC revealed that employing a central spark plug, compared to an eccentric configuration, leads to a marked reduction in asymmetric jet velocity formation. Meanwhile, overall rapid flame propagation in the PC is promoted by the combined action of three factors: the adverse effects of eccentric spark plugs, the acceleration due to higher turbulent kinetic energy (TKE) from impacts, and the existing PC vortex flows.
Using optical diagnostics, Zhao et al. [25] observed methanol injection in an active PC. The spray undergoes three wall impingements, generating a tumbling motion that promotes mixing. High injection pressure causes fuel accumulation at the PC bottom, while long injection duration leads to spray interference. Flame propagation is irregular in the wide cone section but accelerates significantly through the convergent throat-to-duct geometry, reaching 323 m/s. Hot jet formation depends on the pressure difference with the MC and internal flame luminosity. Hu et al. [26] tested nozzle swirl angles (0–30°) in an active PC under ultra-lean conditions (λ = 2.5). A larger swirl angle reduces wall fuel film, accelerates mixing, and minimizes variations in turbulent kinetic energy and jet velocity among nozzles, improving jet flame uniformity. In contrast, a smaller swirl angle generates a weaker swirling flow, creating more locally rich zones and degrading ignition capability. Hua et al. [18] showed that increasing PC fuel supply enhances jet reactivity and ignition reliability, but excessive fuel causes incomplete combustion and reduces MC fuel, lowering IMEP and worsening fuel economy. Reducing PC volume lowers heat loss and improves efficiency, though it may reduce peak heat release rate. A single-hole nozzle produces a stronger jet and extends the lean-burn limit, but suffers from a more concentrated jet distribution.
Previous studies indicate that injection pressure affects mixture formation rate and spatial uniformity in the PC, thereby regulating flame development and jet characteristics. Mixture stratification evolves dynamically, and injection timing determines the mixture state at ignition, influencing kernel establishment and propagation stability. Spark plug position not only alters the initial flame kernel path but also changes the effective PC geometry, which in turn affects mixture distribution and jet symmetry. Although central placement is known to produce optimal symmetric jets, how the coupling of geometry change and mixture distribution—due to position offset—impacts jet quality remains unclear. Overall, the dominant physical mechanisms linking these operating parameters and their interactions to PC combustion, jet formation, and MC combustion have yet to be systematically elucidated. To address this gap, this parametric experimental study aims to reveal how injection pressure, injection timing, and spark plug position, through mixture distribution, flame development, and jet quality interact to regulate combustion in both chambers, thereby providing mechanism-based theoretical guidance for PC design.
2. Methodology
2.1. Baseline Engine
This investigation centers on a commercialized, hybrid-oriented gasoline engine featuring port fuel injection (PFI). In the subsequent research, an active PC was added to the engine, replacing the single spark plug for ignition. The main parameters of the engine are presented in Table 1. All subsequent research and analyses were performed using CONVERGE 3.0.
Main parameters of engine.
| Operating Parameter | Parameter |
|---|---|
| Bore × Stroke/mm | 72 × 92 |
| Length of connecting rod/mm | 143 |
| Displacement/L | 1.5 |
| Compression ratio | 15 |
| Speed/r·min−1 | 3000 |
2.2. 3D Numerical Model
The 3D geometry model is shown in Figure 1. The CFD simulation requirements dictate that the model be subdivided into 5 regions with 19 distinct boundaries. They are respectively the MC area (piston, cylinder wall, cylinder head, PC base, intake valve base and exhaust valve base), the intake A area (intake inlet, intake port A), the intake B area (intake port B, intake valve, etc.), the exhaust area (exhaust outlet, exhaust port, exhaust valve, etc.) and the PC area (spark plug, PC wall).
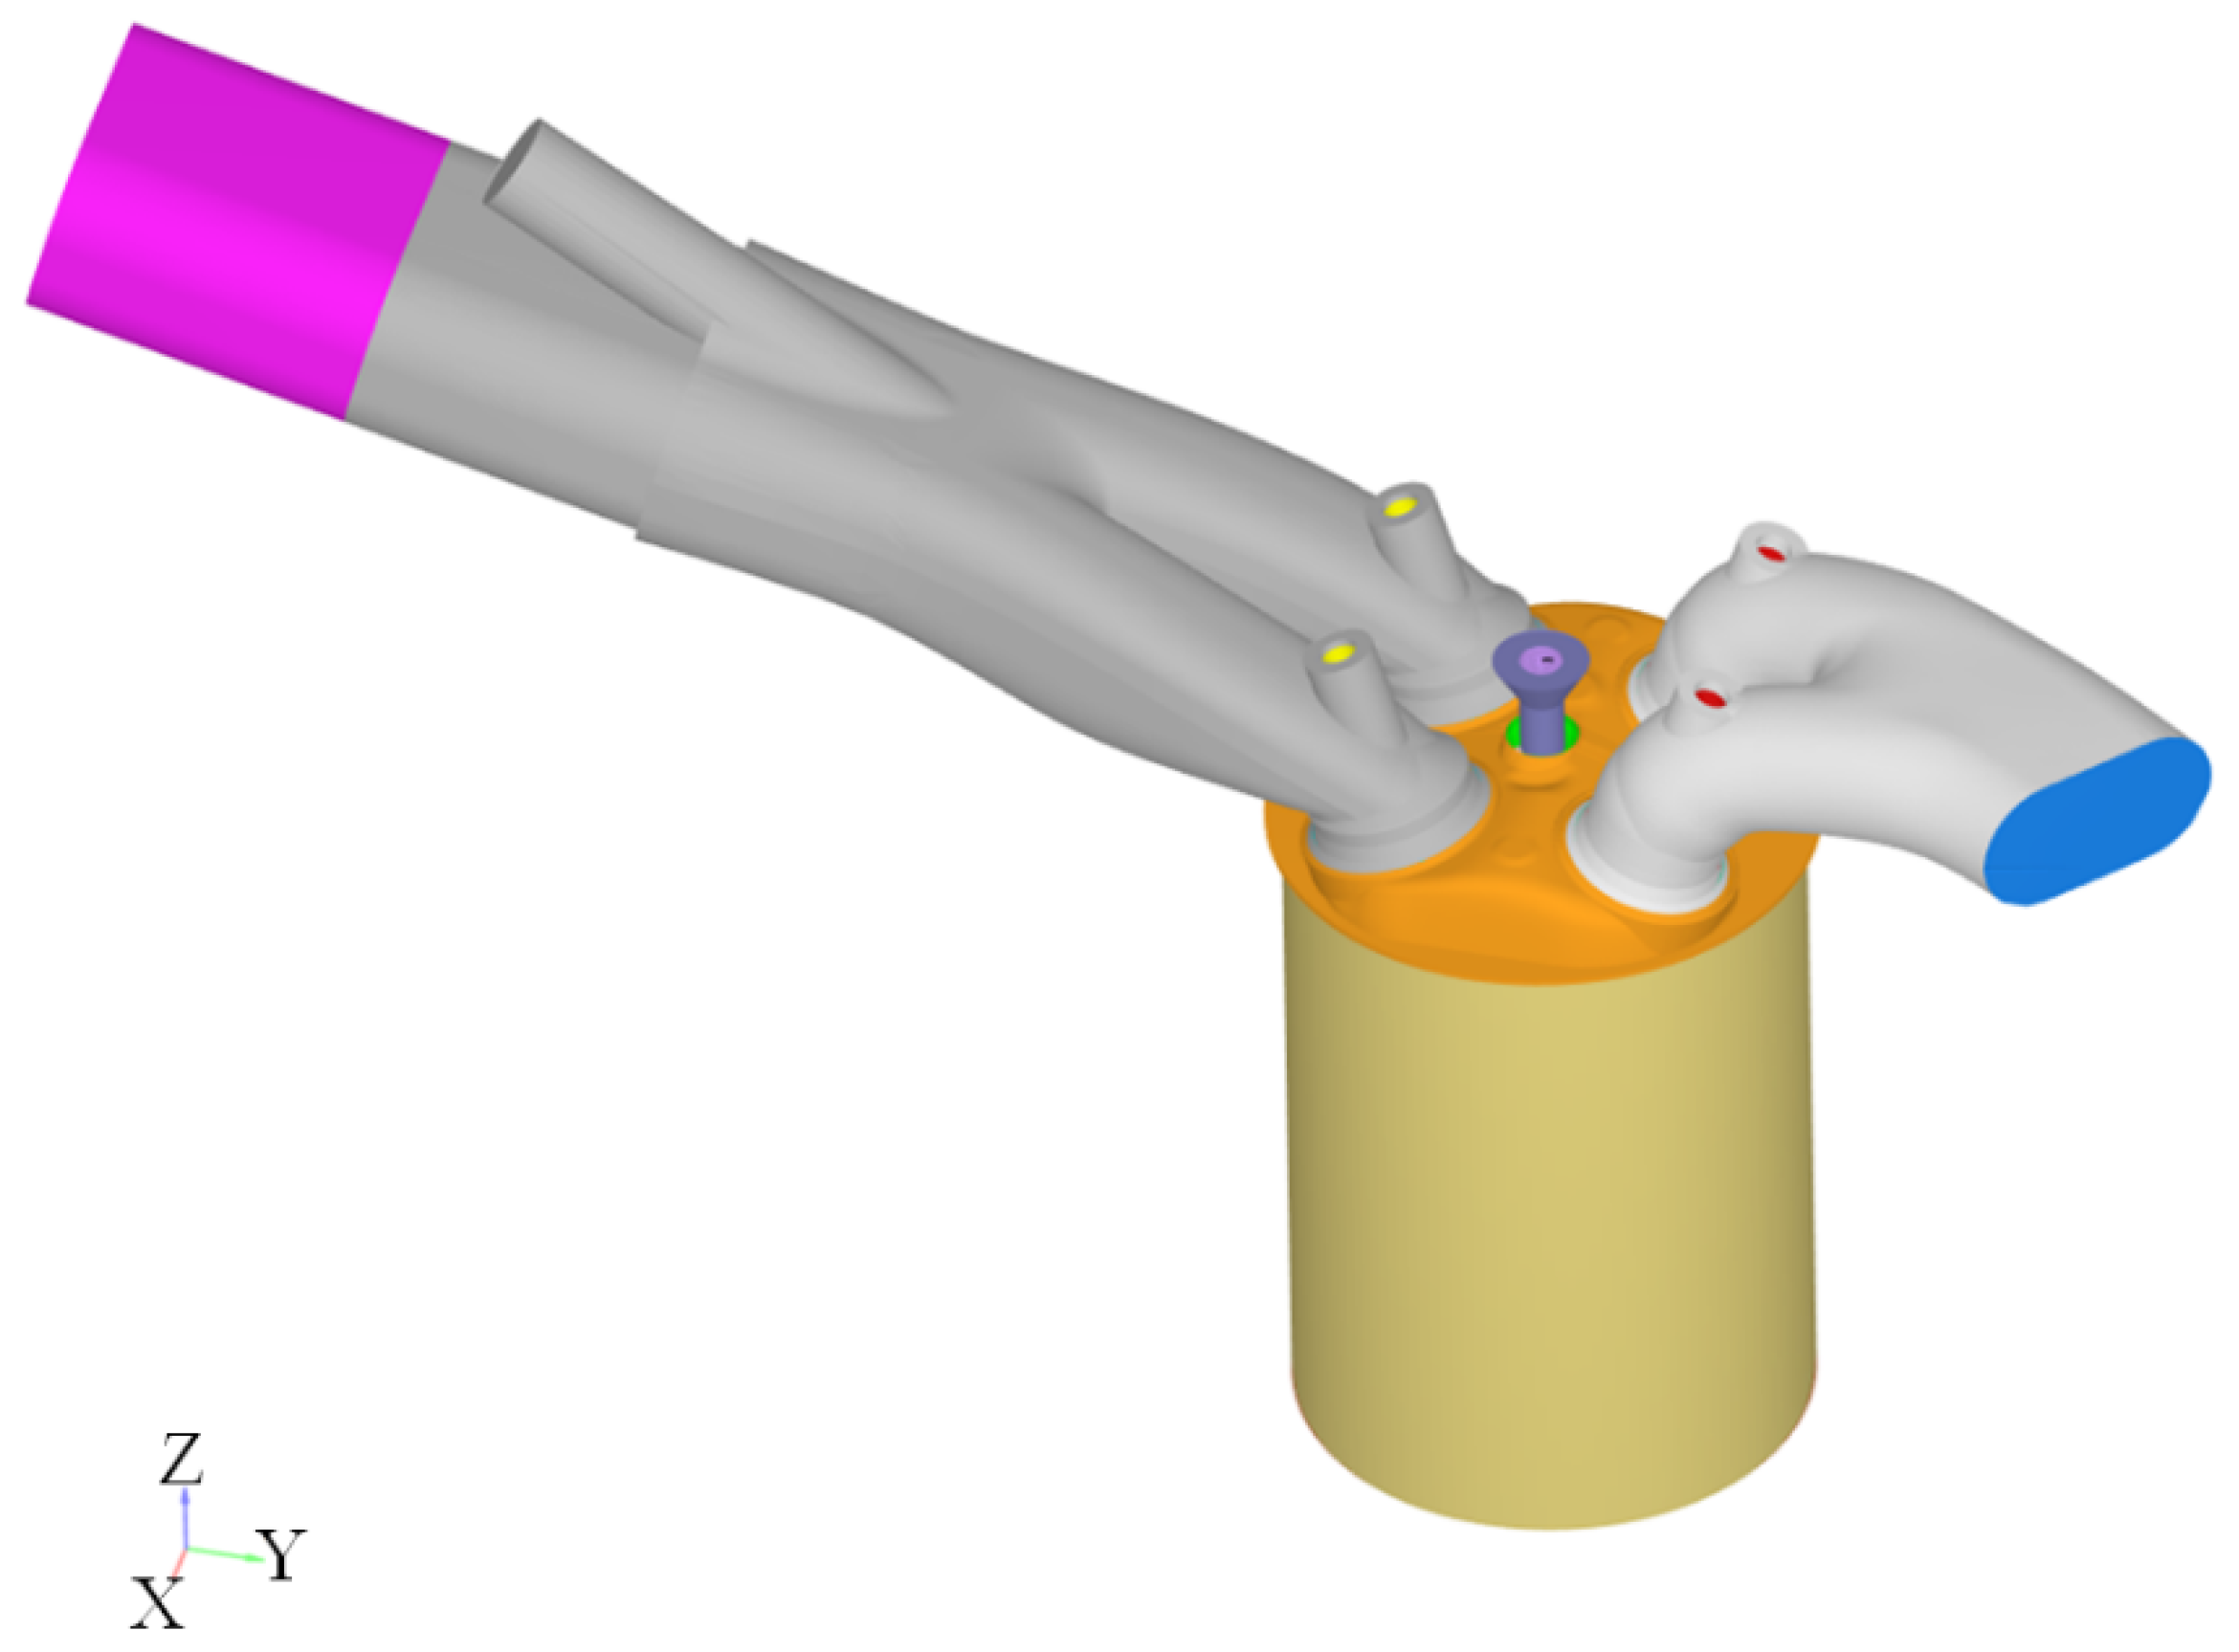
The primary focus of this simulation study is on turbulence, combustion, and spray. The selections for the models are showed in Table 2. This study selects the computationally efficient and widely used RNG k-ε turbulence model, coupled with the SAGE detailed chemistry kinetics model known for its excellent performance in complex combustion modes.
Selection of numerical model.
| Name | Model |
|---|---|
| Turbulence Model | RNG k-ε |
| Combustion Model | SAGE |
| Spray Fragmentation Model | KH-RT |
| Collision Model | NTC |
| Evaporation model | Frossling |
Based on the test bench data, this paper selects the compression top dead center as the initial time. The specific boundary conditions and initial parameters of the fluid domain, shown in Tables 3 and 4, are obtained from experiments and CFD model calibration on the same engine type.
Boundary condition setting.
| Parameter | Value |
|---|---|
| Piston temperature/K | 450 |
| Cylinder wall temperature/K | 400 |
| Cylinder head temperature/K | 450 |
| Spark plug temperature/K | 550 |
| Spark plug electrode temperature/K | 950 |
| Exhaust valve temperature/K | 525 |
| Exhaust port wall temperature/K | 500 |
| Intake valve temperature/K | 400 |
| Intake port wall temperature/K | 380 |
Fluid region initial condition settings.
| Parameter | Value (−720 °CA) |
|---|---|
| MC temperature/K | 2430 |
| MC pressure/MPa | 2.54 |
| MC components | 8.9%H2O, 71.9%N2 and 19.2%CO2 |
| PC components | 8.9%H2O, 71.9%N2 and 19.2%CO2 |
| Intake air temperature/K | 346 |
| Exhaust/K | 967 |
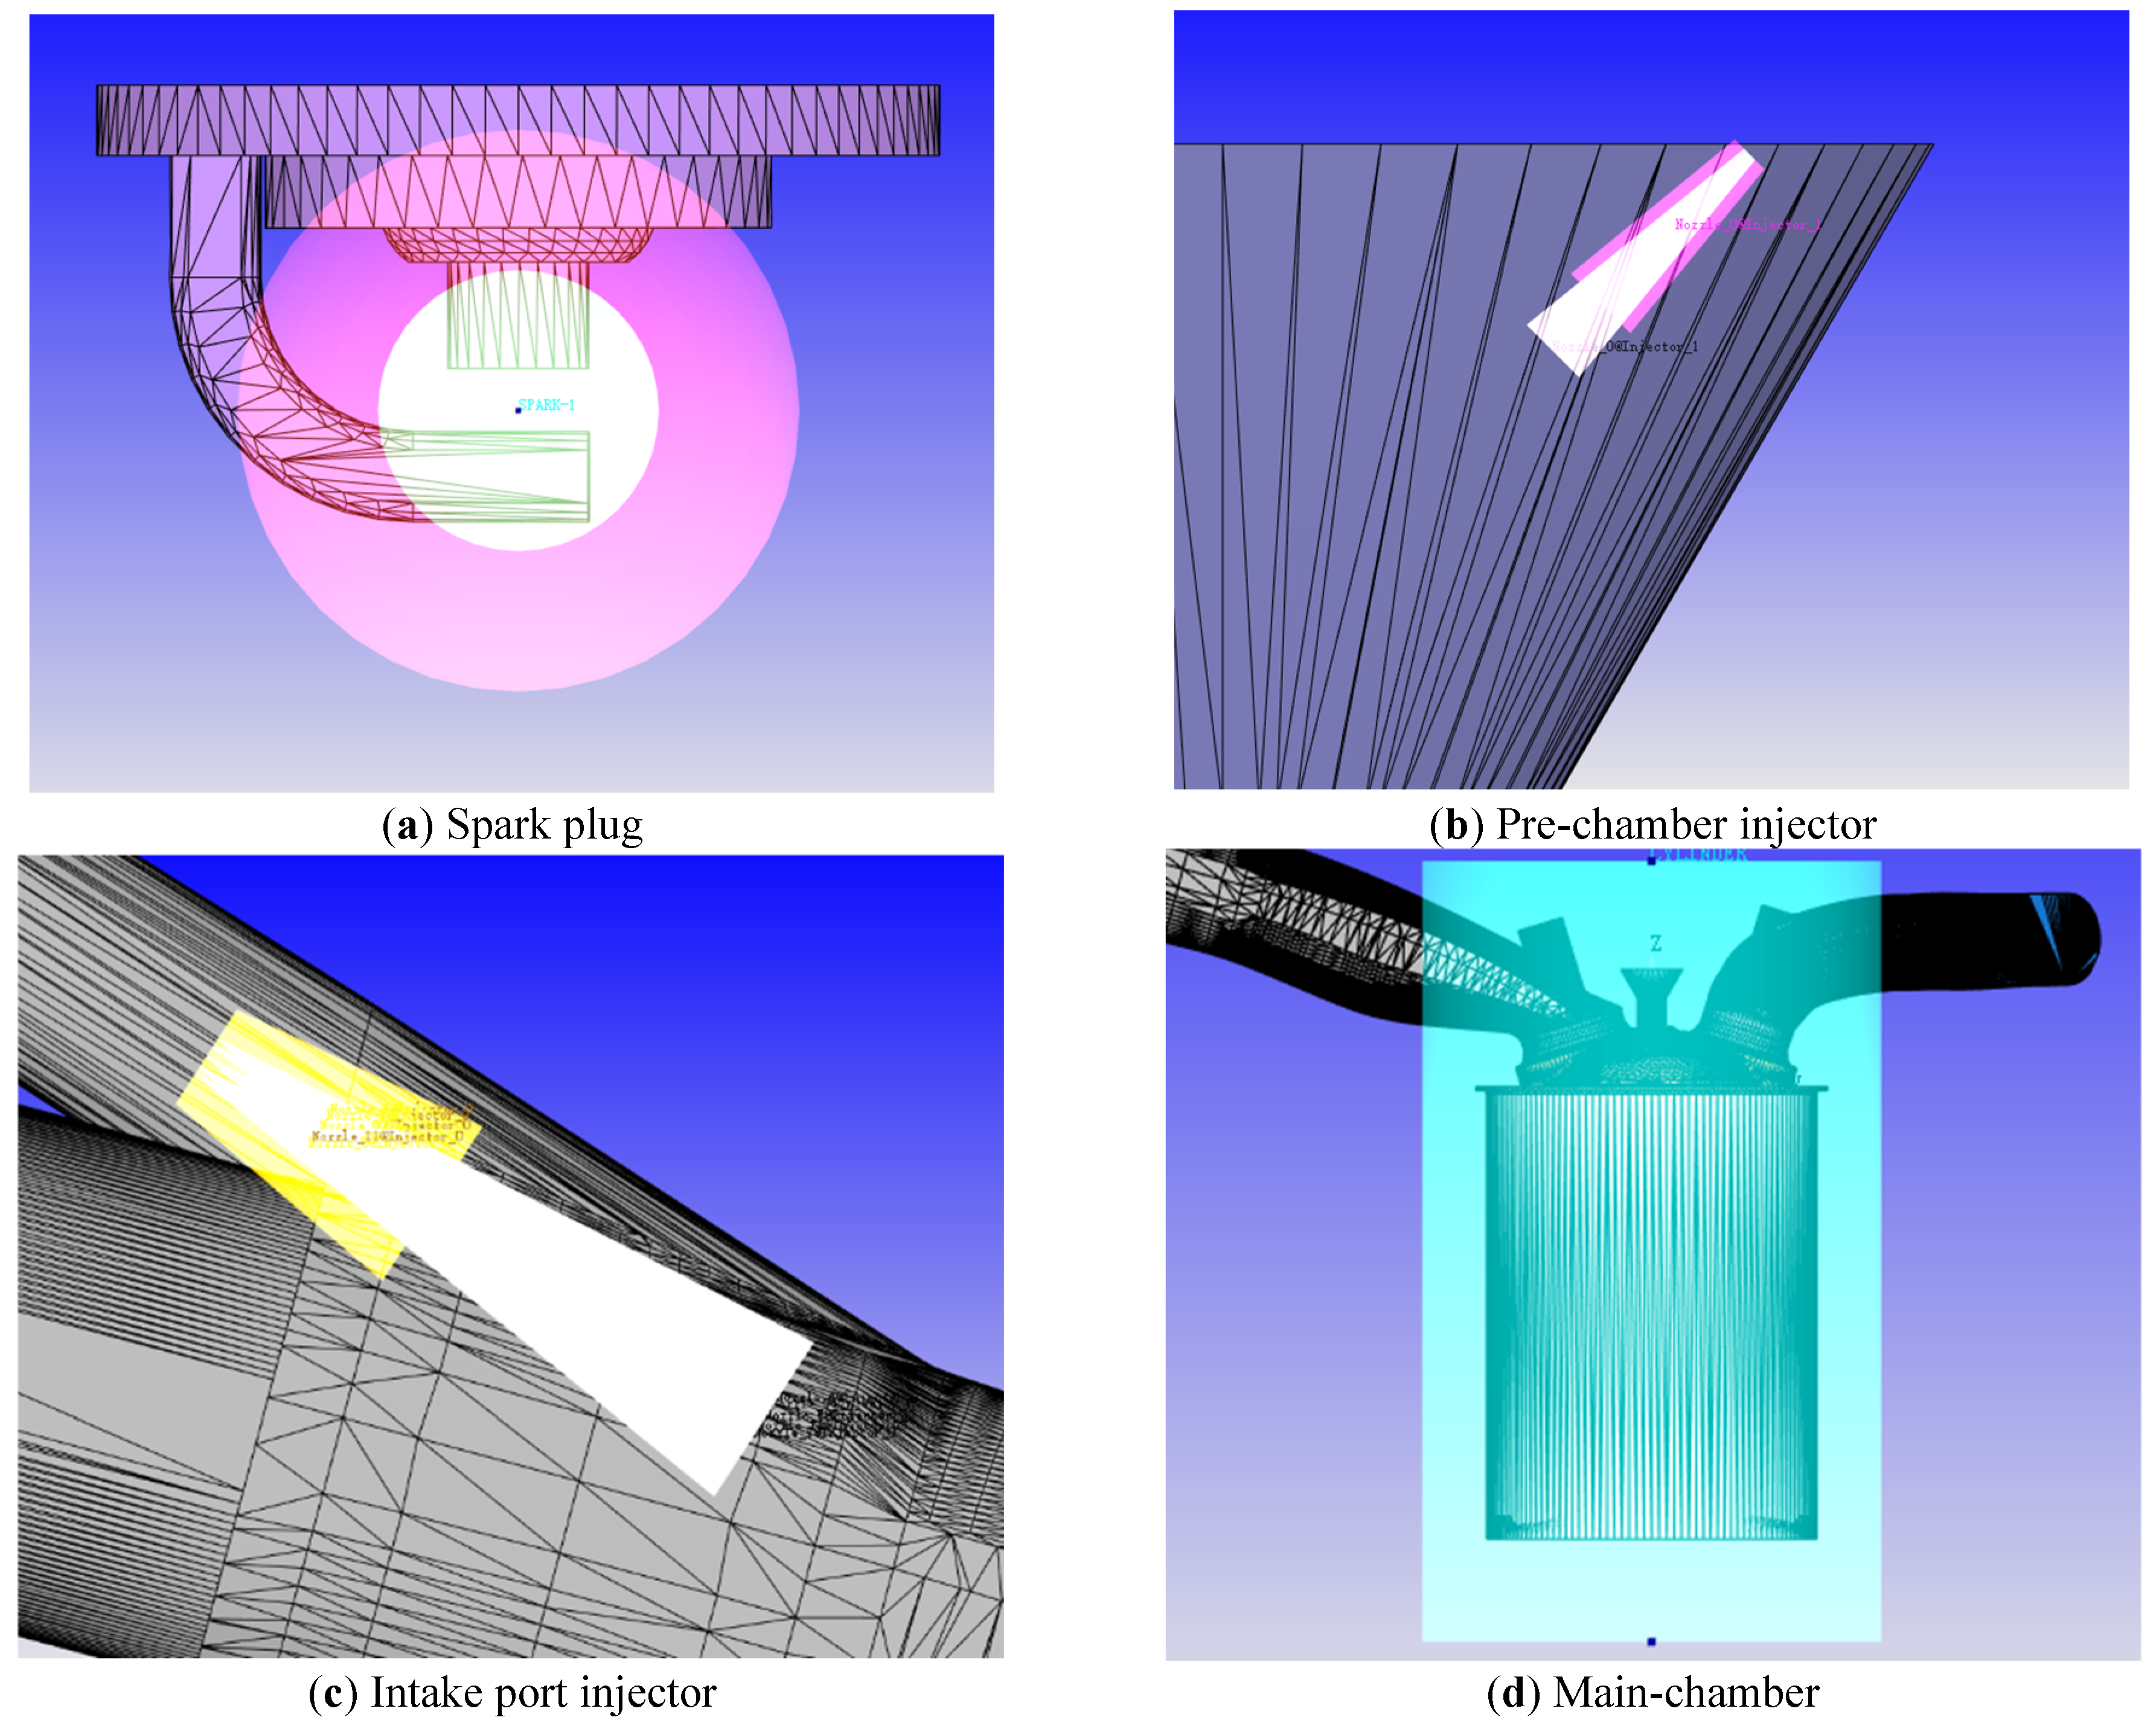
The fixed grid refinement as shown in Figure 2. Permanent fixed embedding refinement is adopted in the MC, PC and the inlet and exhaust valve chamfers. For components such as the intake injector, PC injector and spark plug, which only operate during specific time periods, the timed fixed embedding refinement is used. In the intake region, AMR (Adaptive Mesh Refinement) based on velocity gradient is adopted. In the MC and PC regions, AMR based on both velocity and temperature gradients is adopted. Among them, the spark plug is refined with two spherical regions, with a 5-level refinement at the center and a 4-level refinement in the larger area. In the refinement of the 2 injectors regions, white represents the injectors and the colored areas represent the refinement.
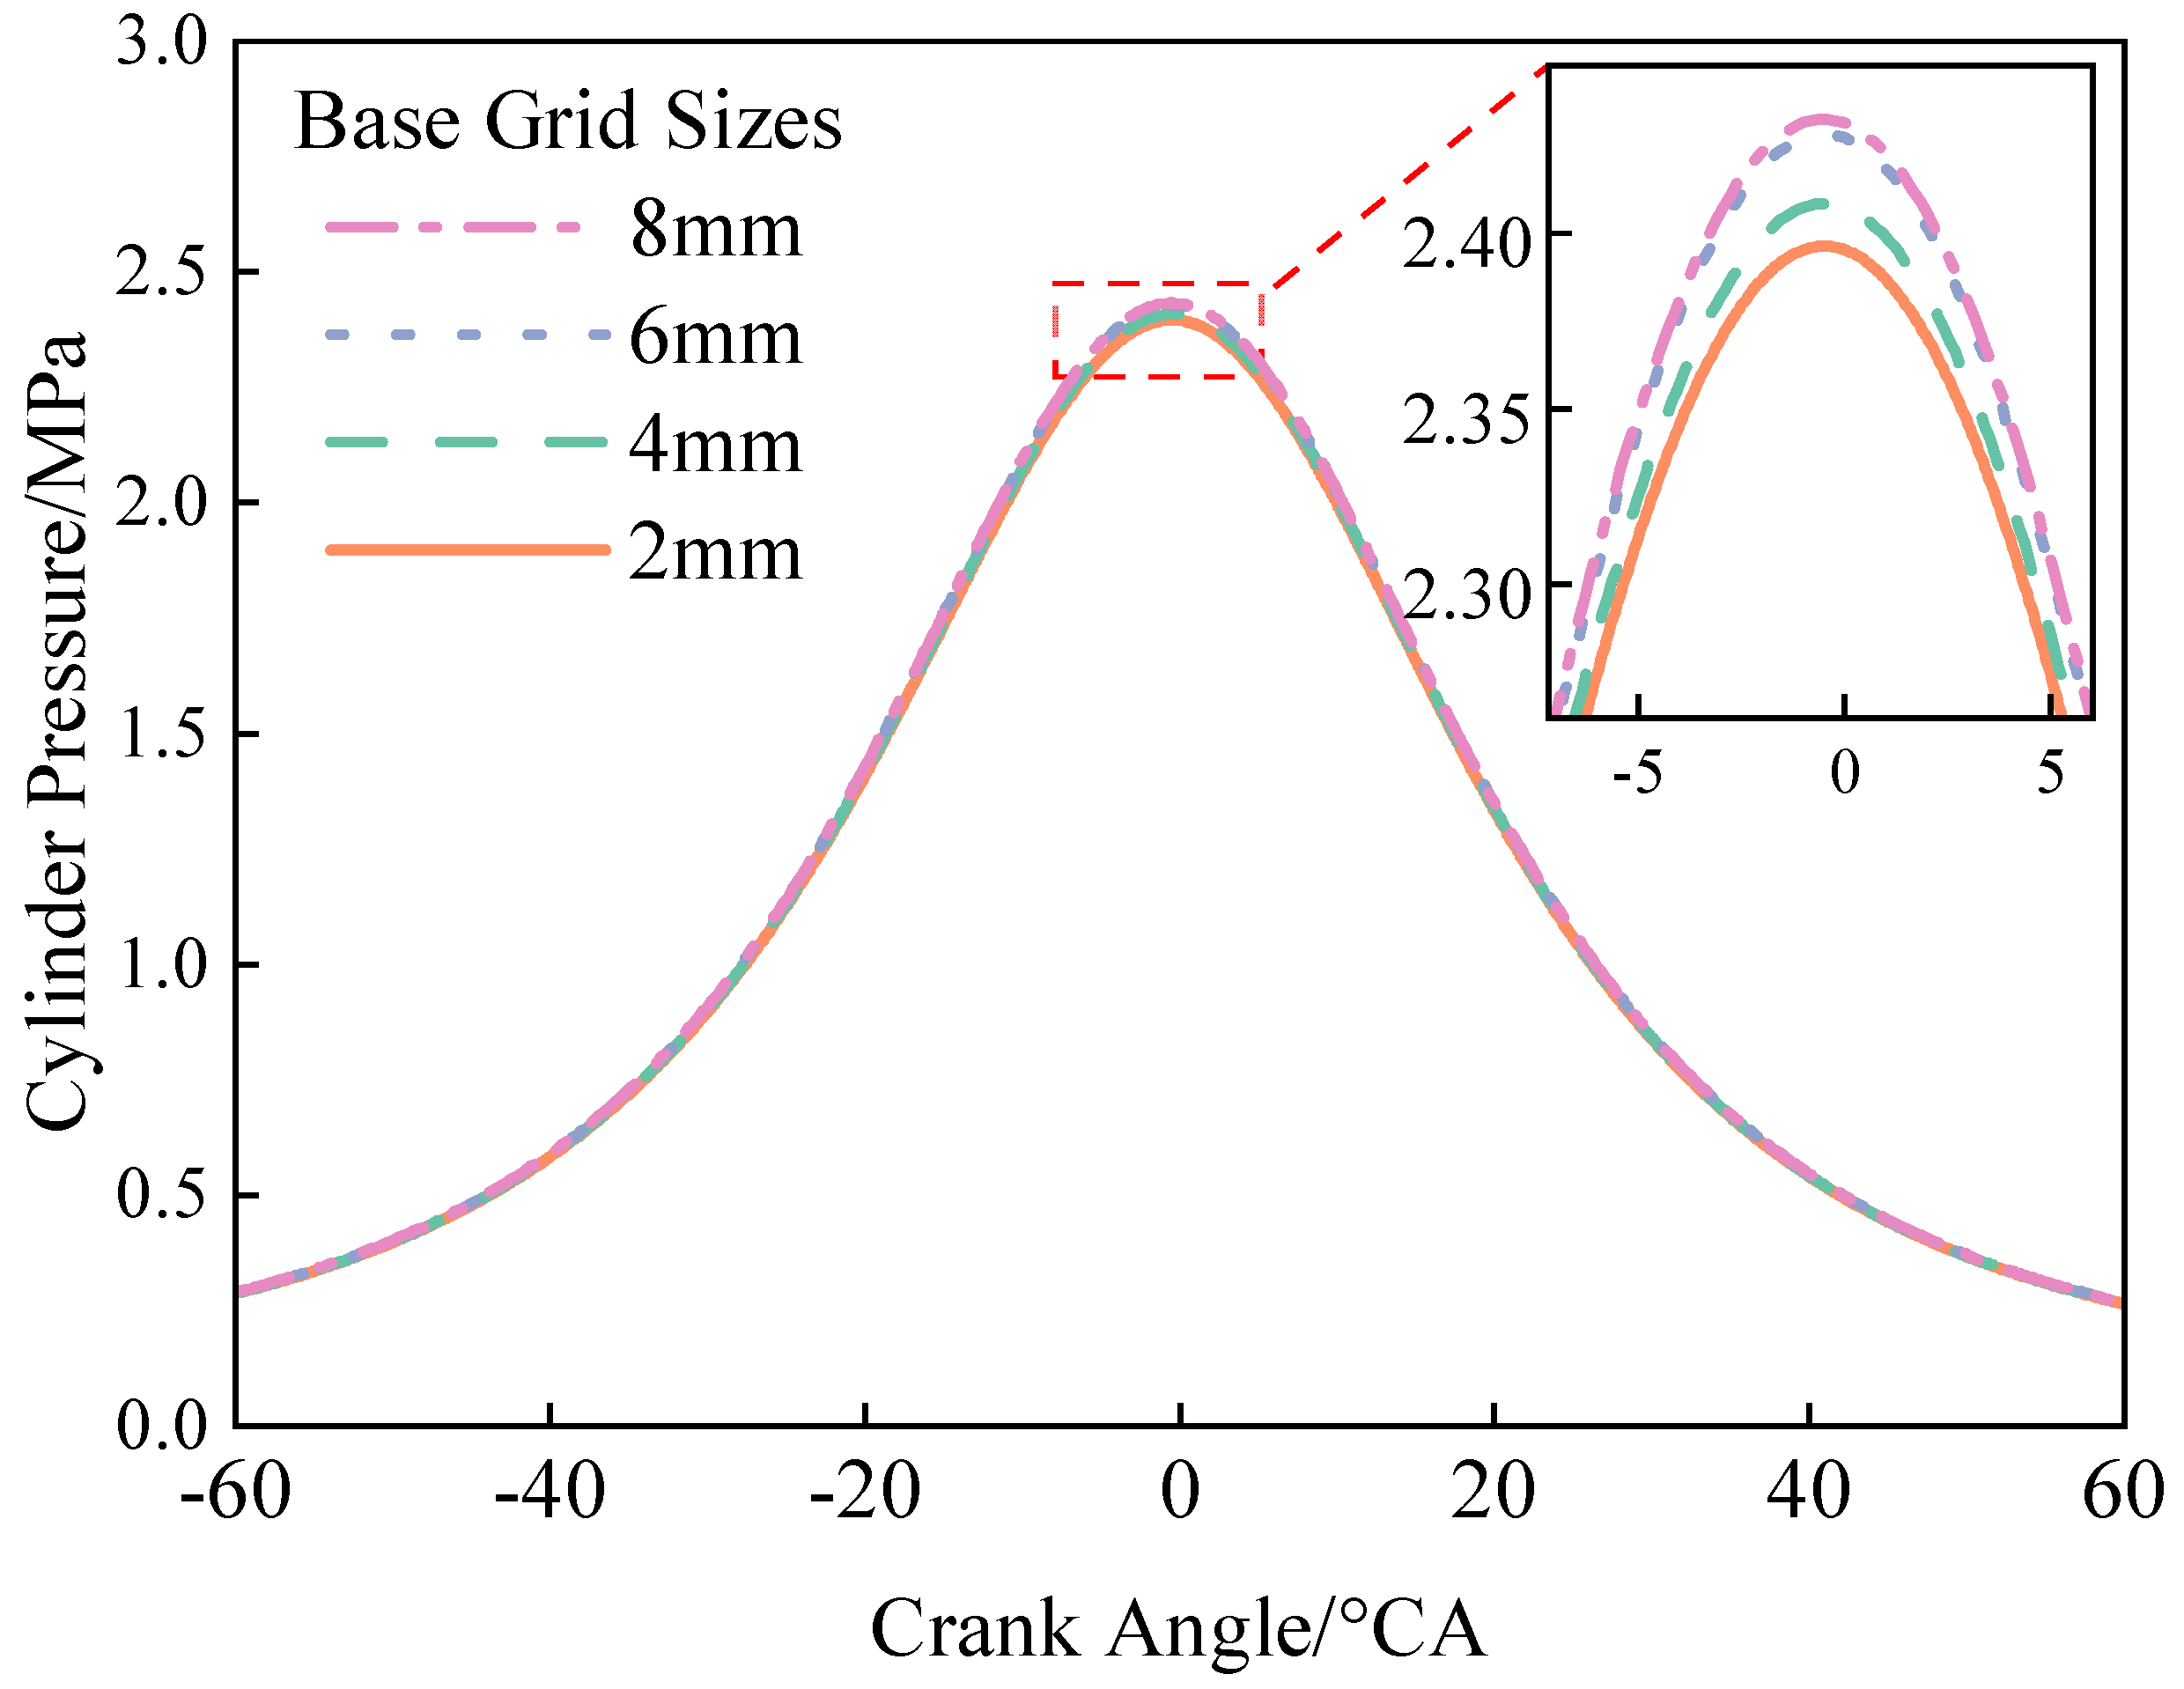
A grid independence study was conducted. Figure 3 shows the cylinder pressure curves for varying base grid sizes. The maximum cylinder pressures for the base grids of 2 mm, 4 mm, 6 mm, and 8 mm were 2.396 MPa, 2.409 MPa, 2.428 MPa, and 2.433 MPa, respectively. Among them, the relative errors for the 4 mm and 2 mm grids were 0.54%. While the relative errors for the 6 mm and 8 mm base grids were 1.34% and 1.54%, respectively. Considering the accuracy and cost, the base grid for the model was set to 4 mm. Additionally, for key regions such as fuel injection, spark plug ignition, intake valve, exhaust valve, and combustion, local grid refinement were adopted to improve the accuracy. The specific refinement levels are shown in Table 5.
The fixed embedded and AMR levels.
| Parameter | Level |
|---|---|
| Embedding in MC | 2 |
| Embedding in PC | 4 |
| Embedding in port injector | 3 |
| Embedding in PC injector | 3 |
| Embedding in spark | 4, 5 |
| Embedding in intake valve | 4 |
| Embedding in exhaust valve | 4 |
| AMR (velocity and temperature) | 3 |
2.3. Validation of Numerical Model
To ensure the accuracy of the numerical model calculations, both the bench test and the simulation were conducted under a rotational speed of 3000 r·min⁻¹ and a torque of 95 Nm, which represents a frequently used operating condition for this engine type.
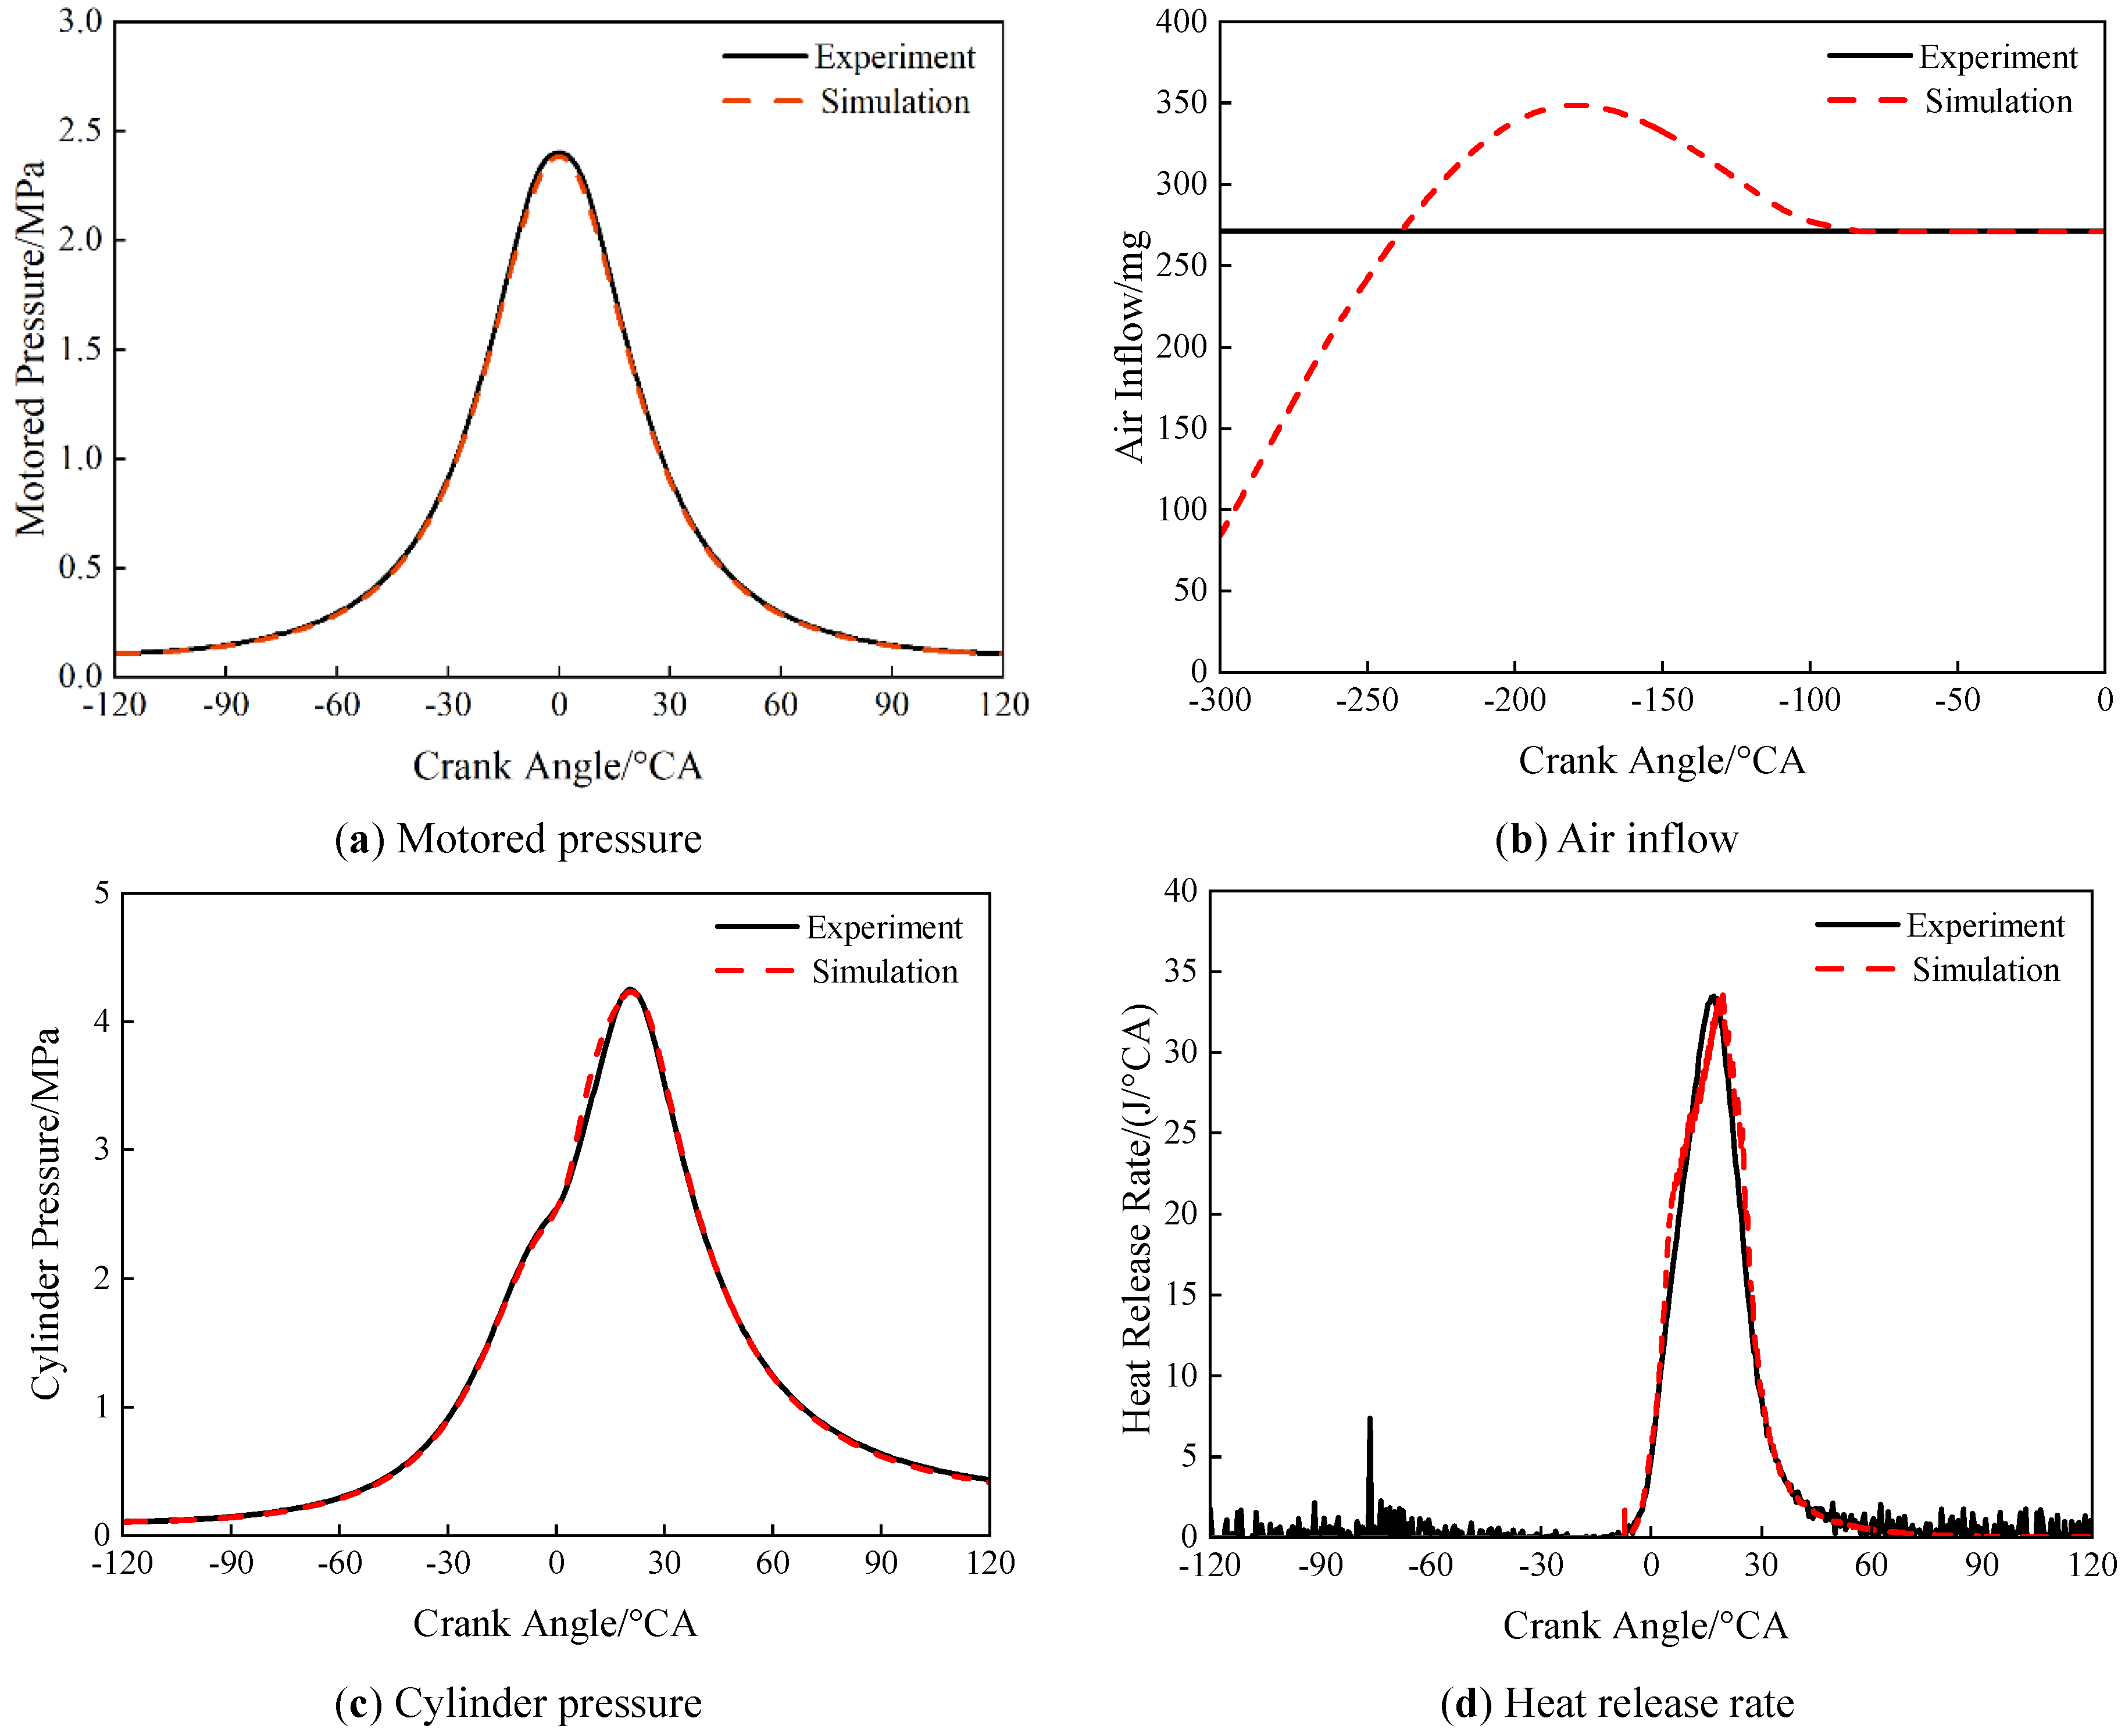
The comparison of test and simulation data is shown in Figure 4. The experimental maximum motored pressure measures 2.40 MPa, while the simulated value is 2.38 MPa, yielding a relative error of 0.83%; the experimental air inflow measures 271.1 mg/cycle, while the simulated value is 271.0 mg/cycle, yielding a relative error of 0.04%; the experimental maximum combustion pressure is 4.25 MPa, while the simulated value is 4.24 MPa, yielding a relative error of 0.01 MPa; the experimental maximum heat release rate is 33.5 J/°CA, while the simulated value is 33.7 J/°CA, yielding a relative error of 0.60%. The relative error between the simulation and the experiment is within 1%. However, there are some errors between the two in the combustion process, which is primarily due to the differences between the physical models used in the simulation and the actual physicochemical changes in reality. Specifically, the difference in intake flow between −300° CA and −100° CA is primarily caused by late intake valve closure and discrepancies between experimental and simulation measurements, with the experimental data obtained via sensor measurements. Therefore, this simulation model is capable of reproducing the in-cylinder flow and combustion processes of an active PC jet ignition engine under the 3000 r·min−1 (95 Nm) condition.
2.4. Pre-Chamber Parameter
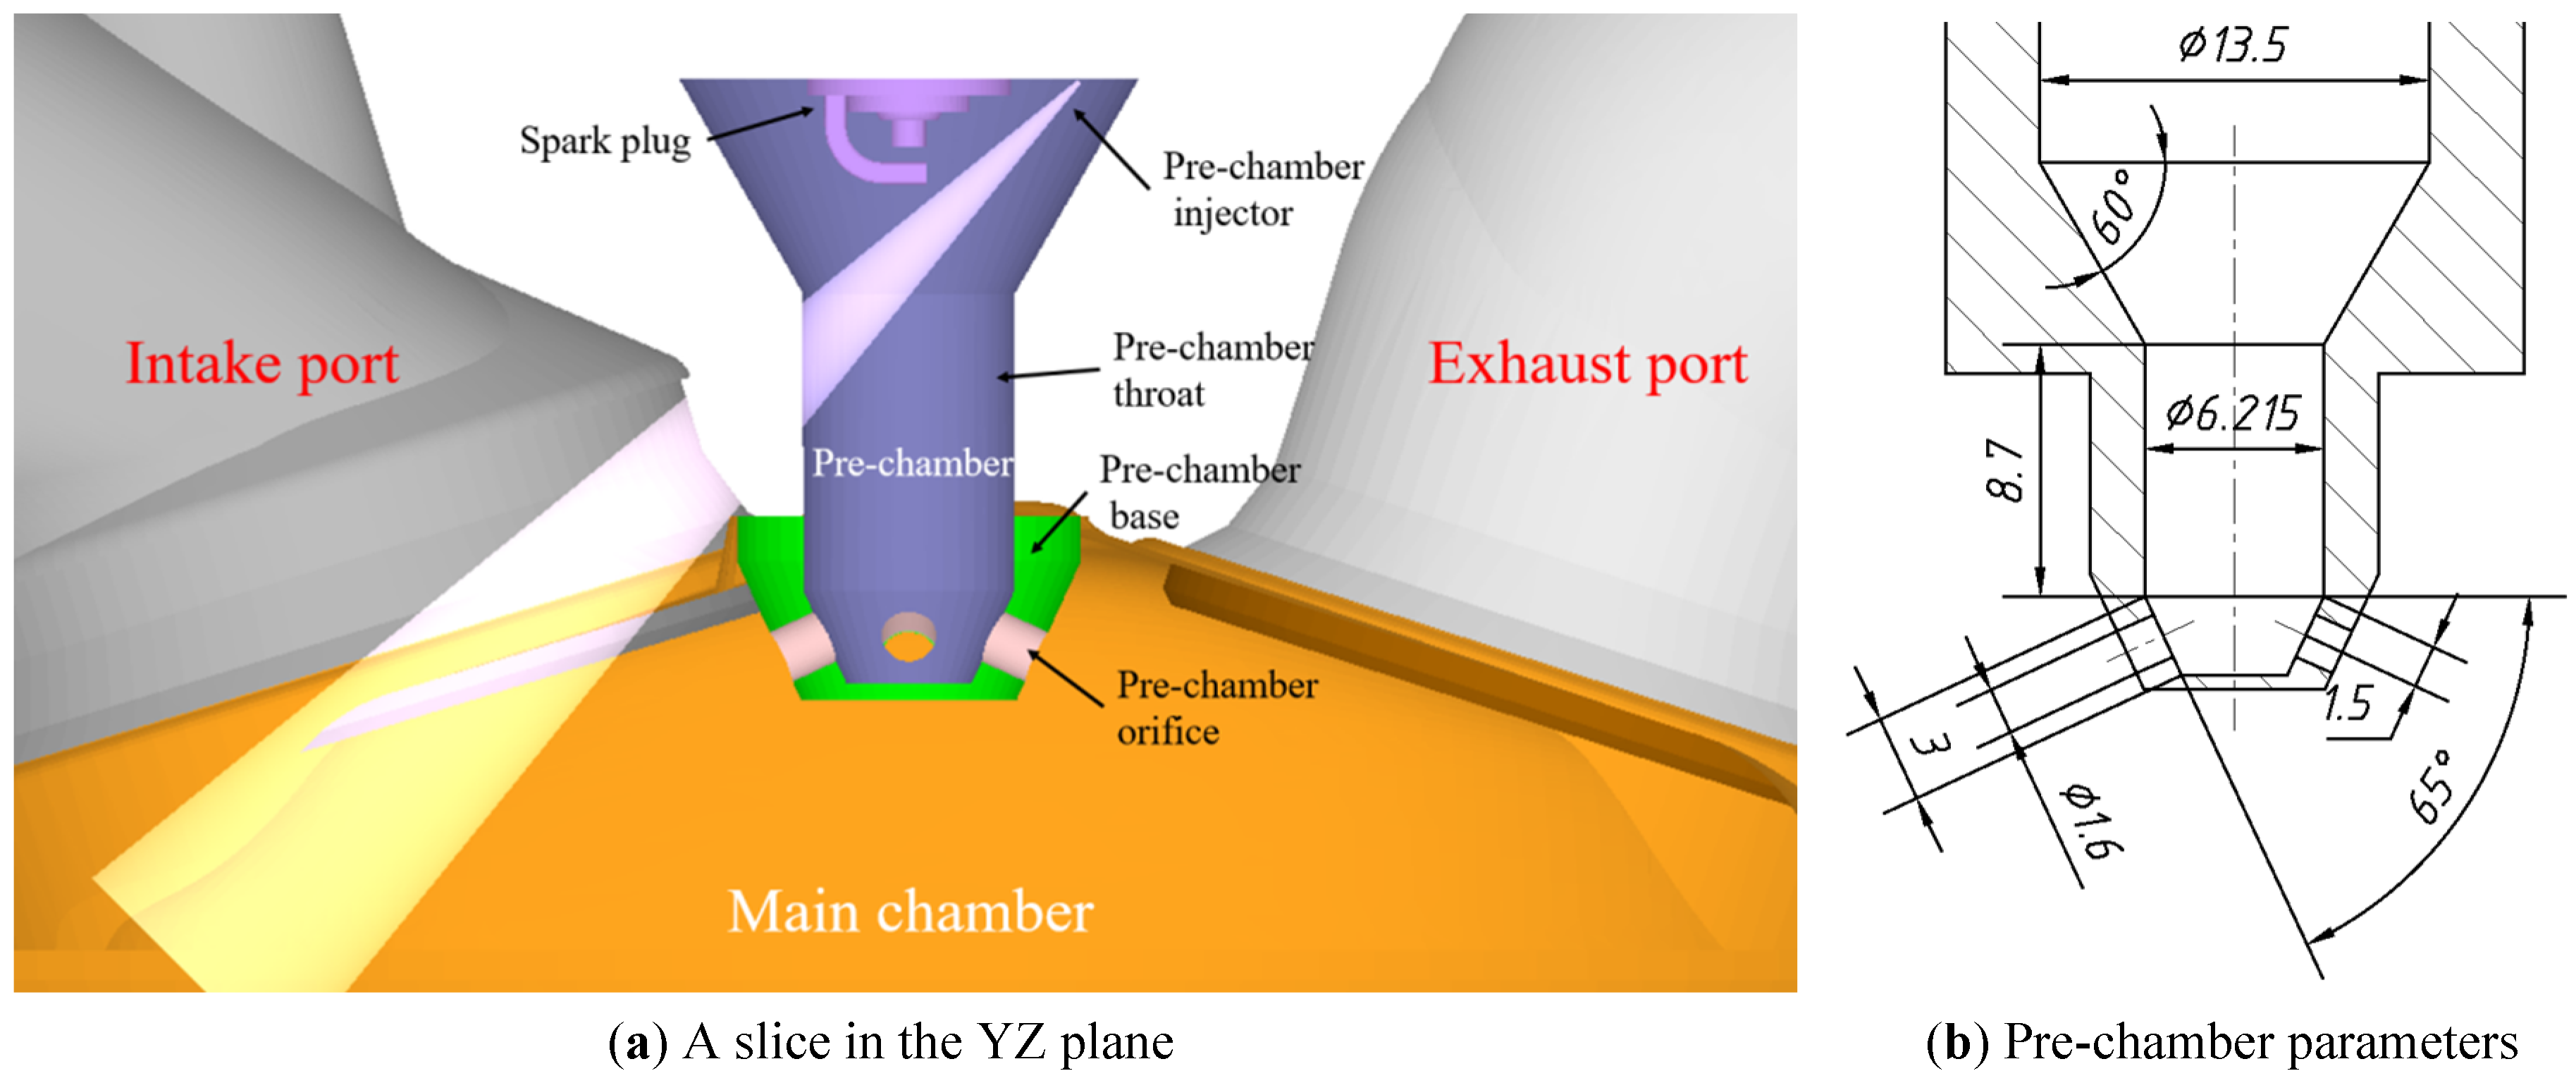
The shape and specific parameters of the PC are shown in the Figure 5 and Table 6. The PC geometry parameters are derived from our previous study. The PC injector is positioned in the upper-right corner of the YZ plane passing through the PC center. In Figure 5a, the conical representation of the nozzle merely illustrates its position, direction, cone angle, and other software settings.
The structure parameters of pre-chamber.
| Parameter | Value |
|---|---|
| Throat length to diameter ratio | 1.4 |
| Orifice number | 4 |
| Orifice diameter/mm | 1.6 |
| Volume ratio/% | 3 |
| Volume/mL | 0.82 |
3. Results and Analysis
The mixture concentration distribution inside the PC plays a critical role in determining the quality of its combustion and subsequent jet flame. Optimizing it is crucial for improving thermal efficiency. In previous studies on the passive PC of this engine type, 1.5 was identified as the lean burn limit [27]. This article conducts research under conditions of the excess air ratio of 1.0 in the PC and 1.5 in the MC. The spark plug position, PC injection pressure and PC injection timing are used as single variables. By analyzing the mixture distribution in the PC, temperature distribution, jet flame, and MC combustion characteristics, this study aims to reveal how the variable parameters mechanistically influence the combustion process. This article focuses on the combustion characteristics and does not conduct analyses on aspects such as emissions. The specific research plan is shown in the Table 7.
Pre-chamber spark plug position and injection parameters research scheme.
| Parameter | Value |
|---|---|
| Spark plug position | Center, −1 mm, −2 mm, −3 mm offset in the Y direction |
| Injection pressure | 5 MPa, 10 MPa, 15 MPa |
| Injection timing | −60 °CA, −120 °CA, −180 °CA, −240 °CA, −300 °CA |
3.1. Effect of Pre-Chamber Injection Pressure on In-Cylinder Combustion and Performance
3.1.1. Effect on the Distribution of the Mixture Gas within Pre-Chamber under Different Injection Pressure
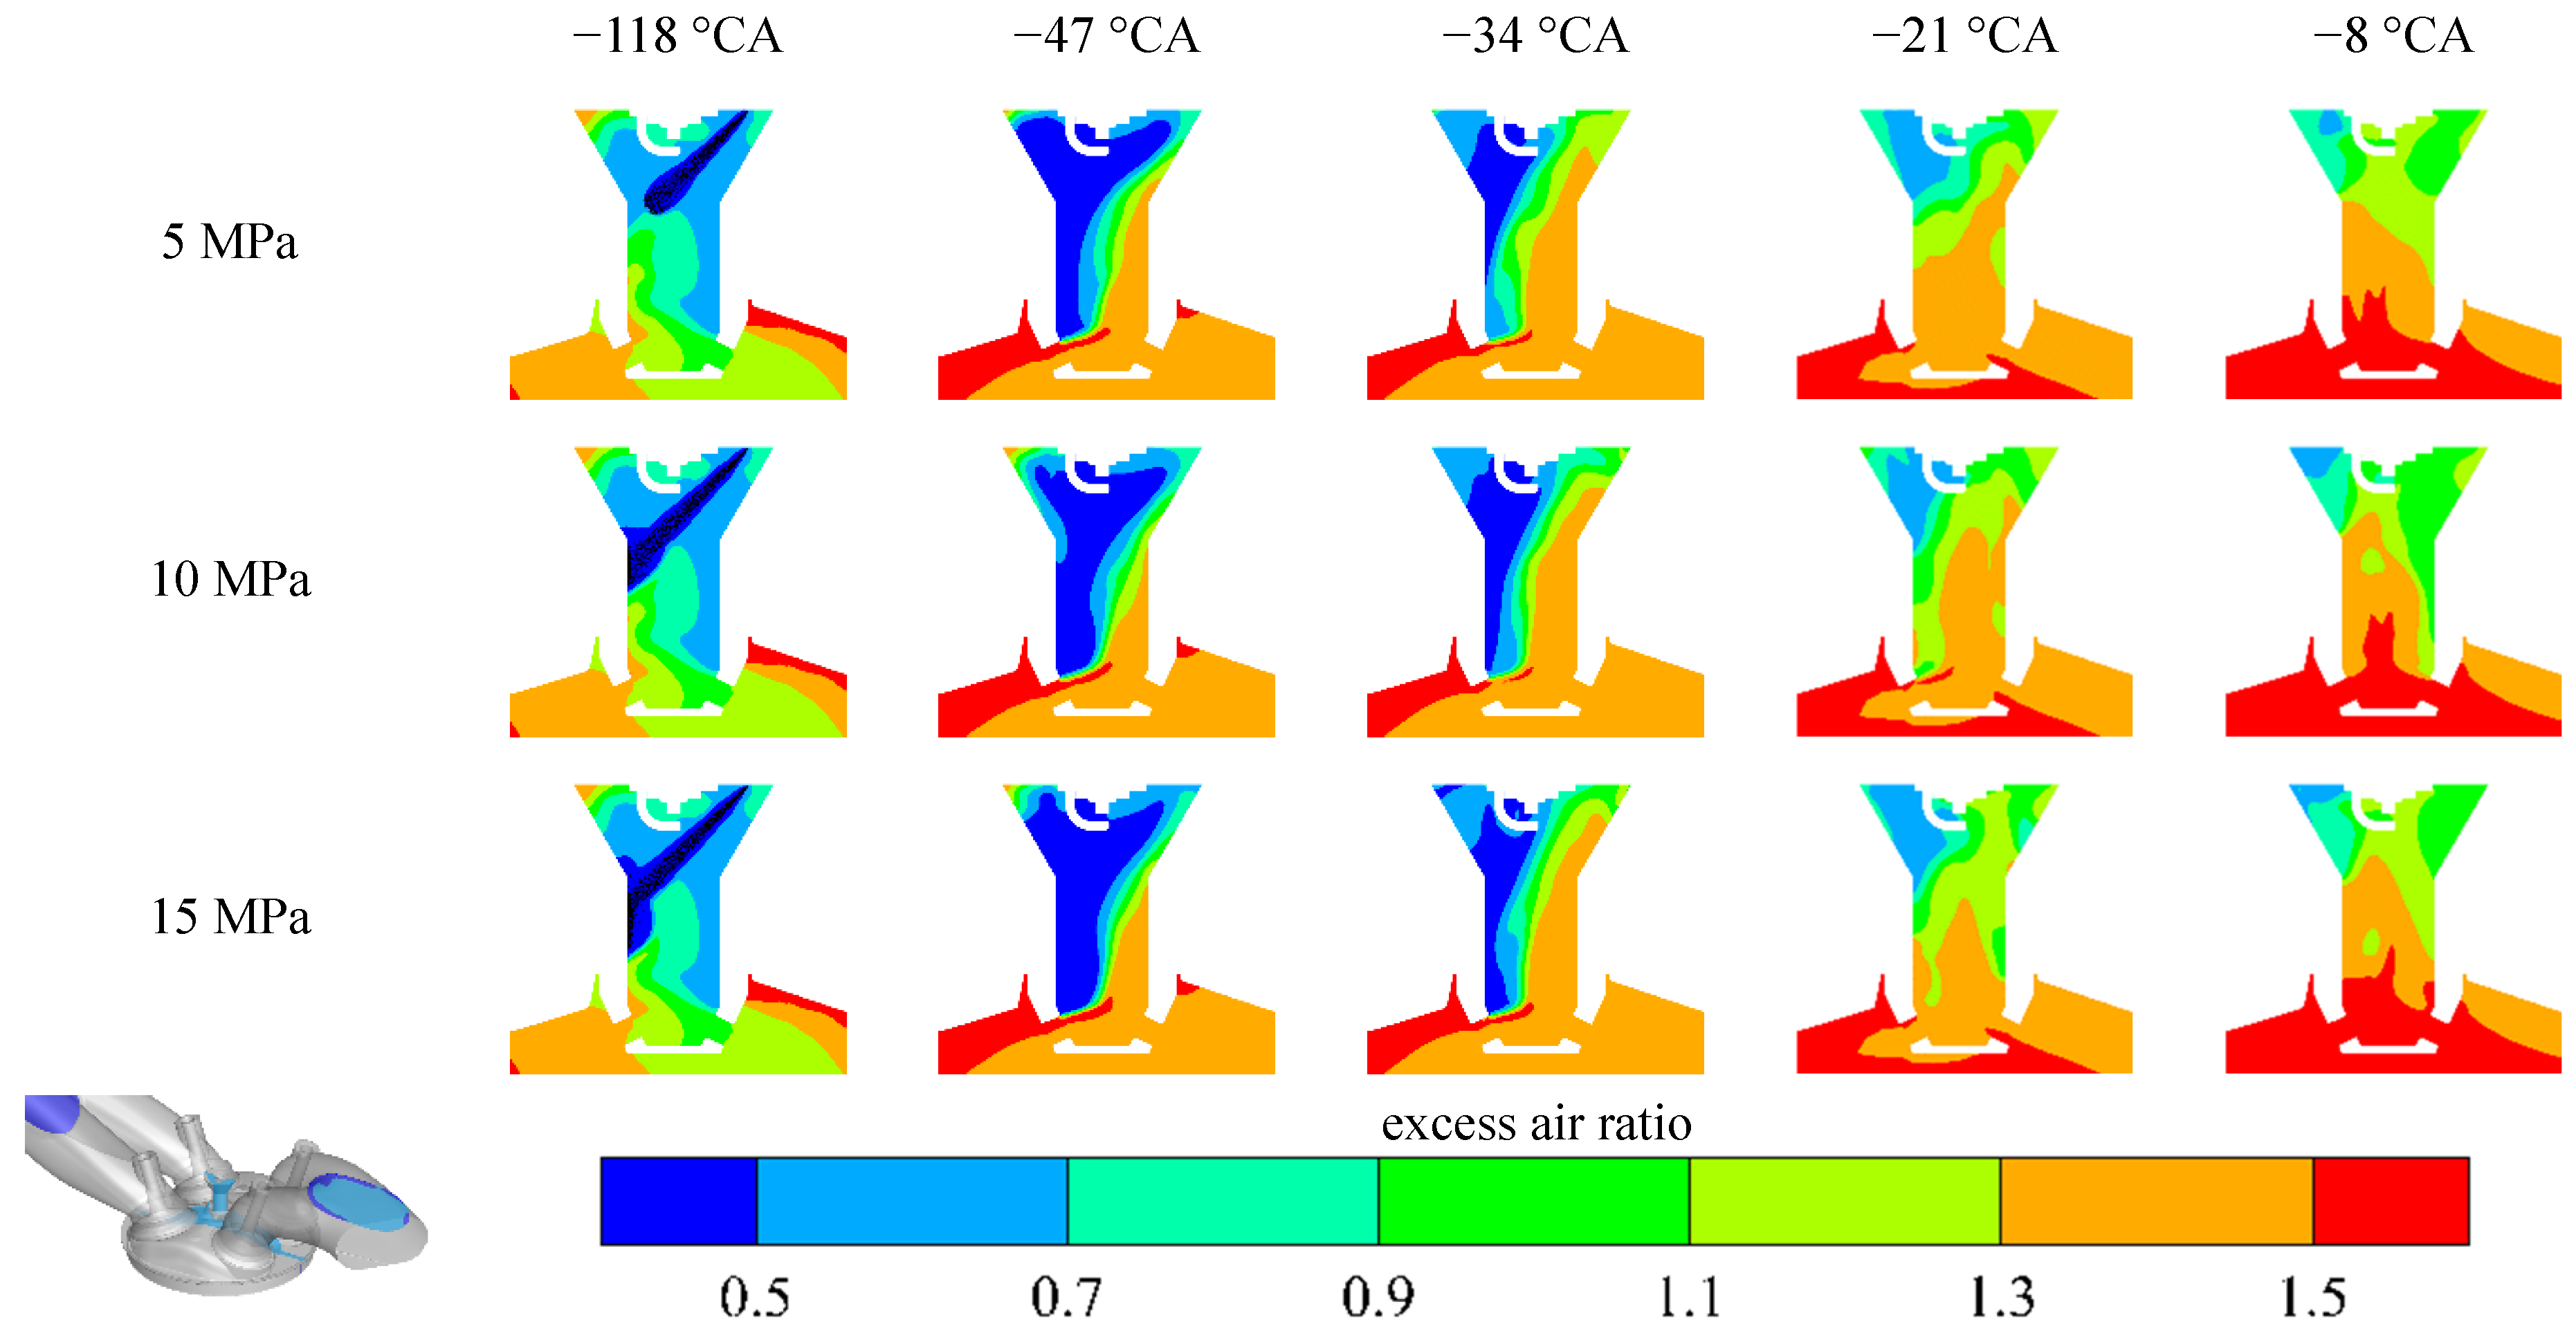
Figure 6 shows the trend of the excess air ratio in the PC with different injection pressures. For the same injection mass, initially, a higher injection pressure results in faster fuel impingement on the wall. Over time, the mixture distributions from the three cases exhibit similar stratification. Additionally, in the 10 MPa case, the mixture near the spark plug is closer to the stoichiometric ratio, and the proportion of mixture with an equivalence ratio between 0.9 and 1.1 is the largest. It is considered that a lower injection pressure results in inadequate fuel atomization and evaporation, leading to inefficient mixture formation. While increasing the injection pressure significantly improves atomization, excessively high pressure also increases spray penetration distance and shortens the evaporation time, which ultimately impairs the evaporation and mixing process.
3.1.2. Effect on Jet Flame under Different Injection Pressure
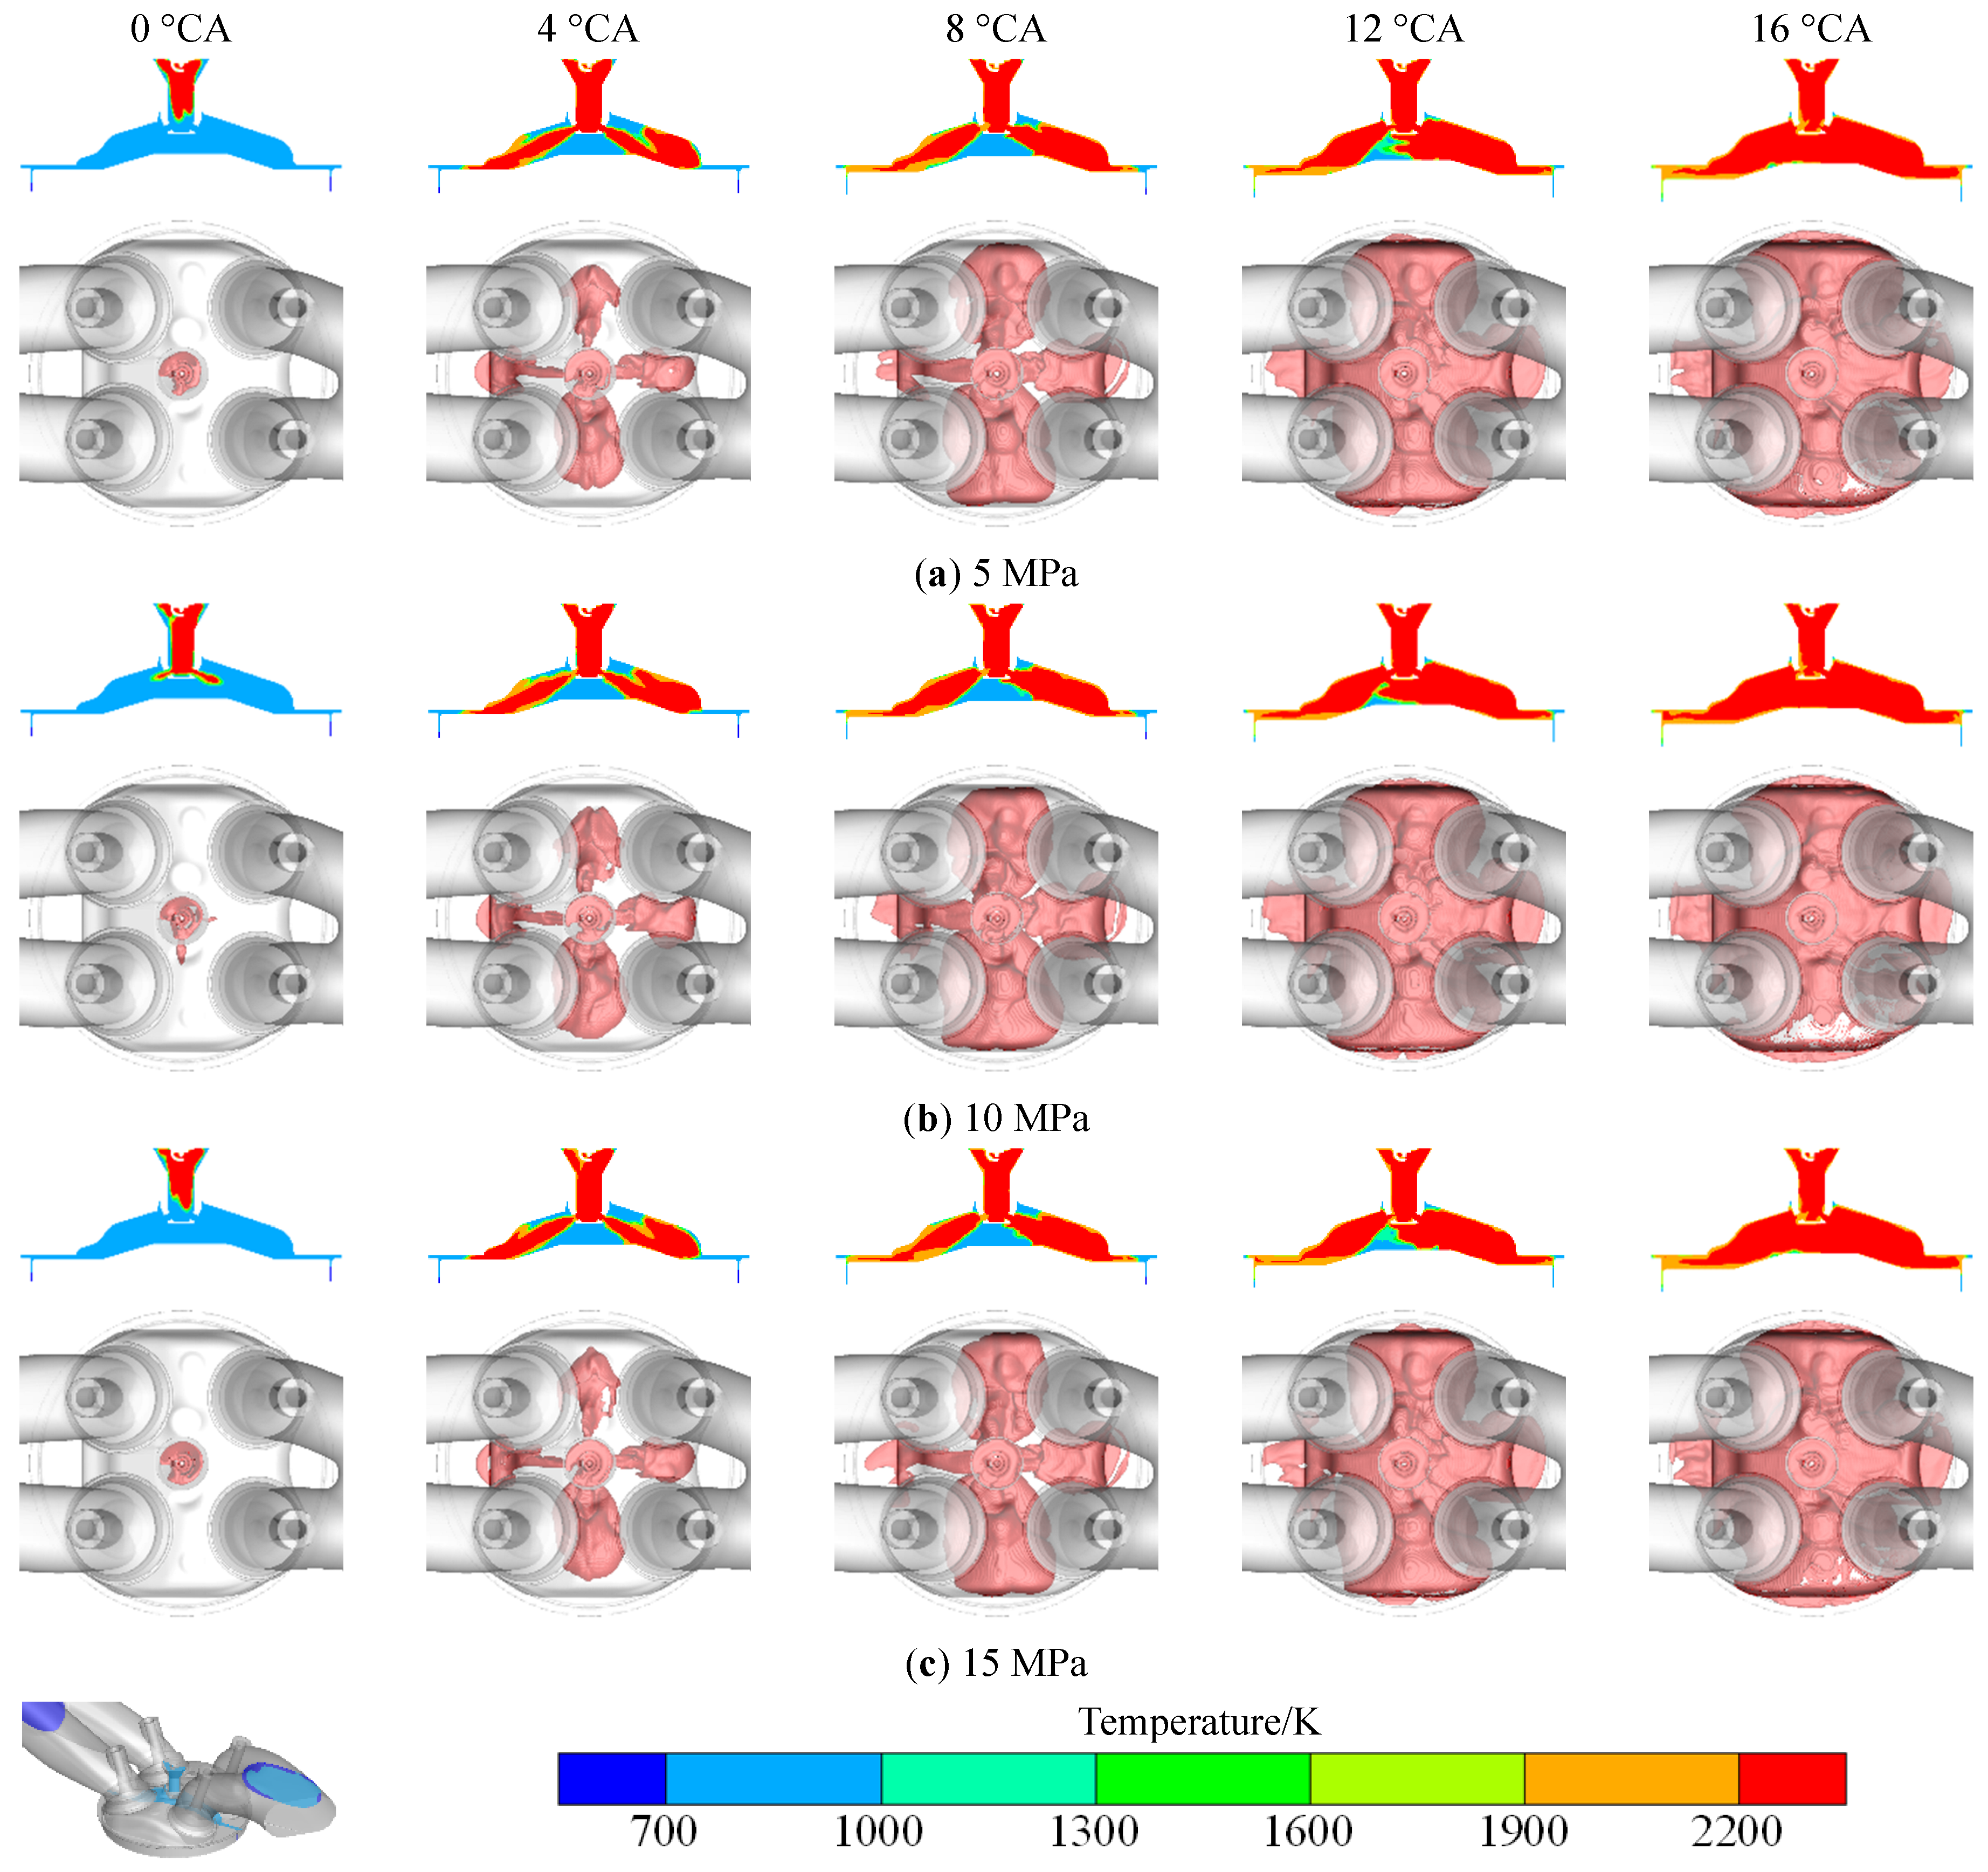
Figure 7 shows the cylinder temperature distribution and jet flame cloud images with different PC injection pressures. The upper part displays a slice view of the YZ-plane, while the lower part shows a top view, both presenting the 2200 K isothermal surface to characterize the jet flame. At 0 °CA, the jet flame develops fastest in the 10 MPa case, while the flame speeds in the other two cases are comparable. In addition, the 10 MPa case shows the highest symmetry among the orifices, and the symmetry in the 5 MPa case is higher than that in the 15 MPa case. In the subsequent combustion, the 10 MPa case exhibits the largest area of high-temperature flame within the MC. Besides, under the 10 MPa, the area of the sub-high-temperature region in the narrow left side of the MC is smaller than the other two. This indicates that the combustion in the PC of this case is more complete, and by filling the MC with active substances, the energy of the jet flame accelerates the combustion process inside.
3.1.3. Effect on Combustion Characteristics under Different Injection Pressure
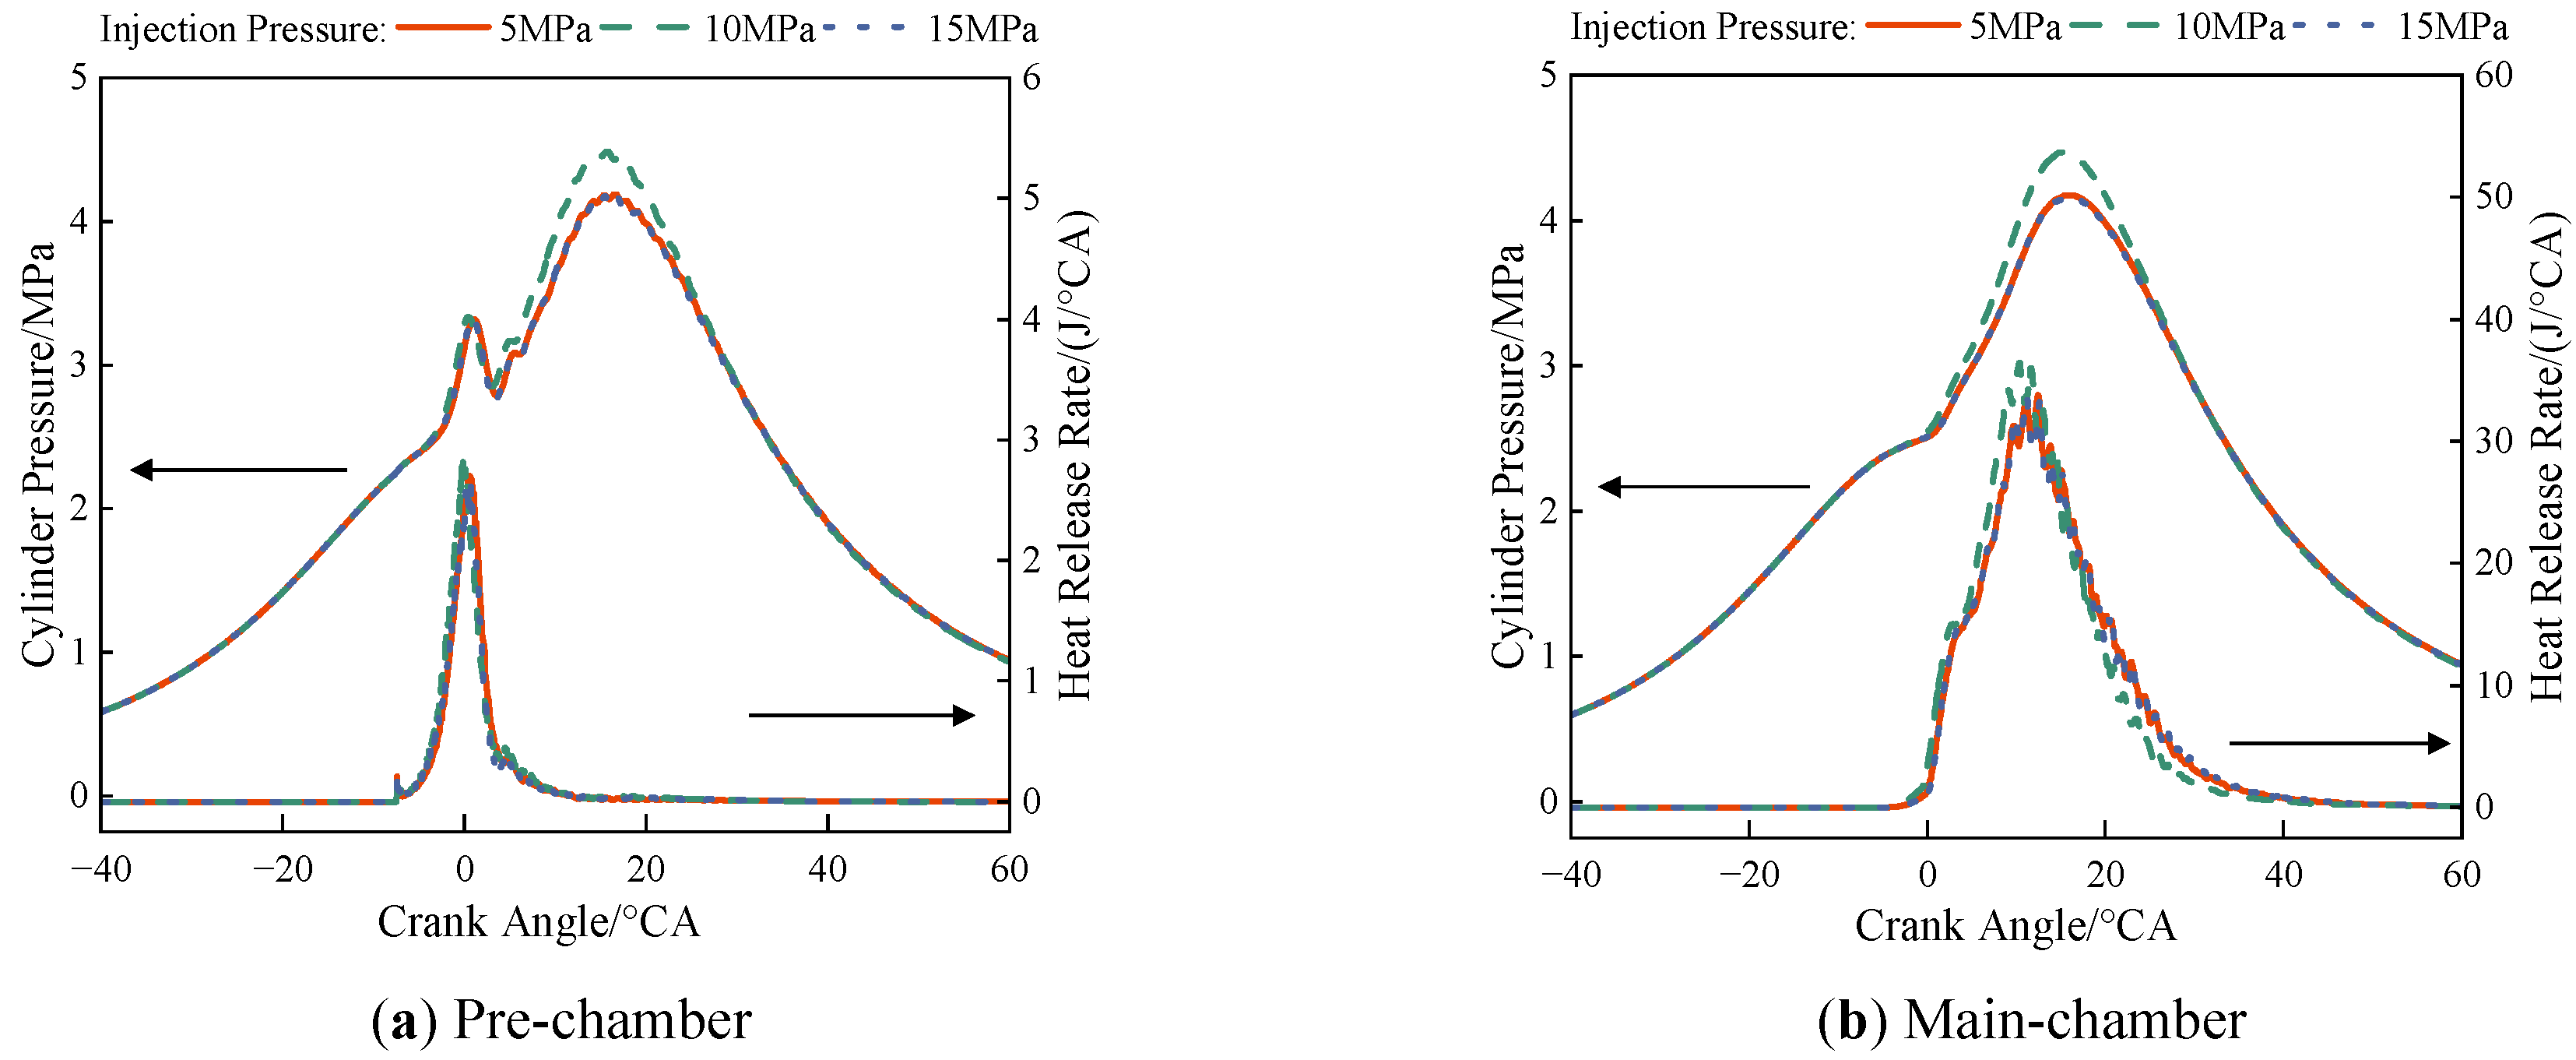
The Figure 8 shows the cylinder pressure and heat release rate with different PC injection pressures.
Figure 8a shows the data of the PC. As injection pressure increases, the first peak pressures are 3.32 MPa, 3.34 MPa, and 3.32 MPa, corresponding to phasing of 1.06 °CA, 0.421 °CA, and 0.960 °CA, respectively. Under 10 MPa condition, the mixture condition near the spark plug is optimal for ignition, and the jet flame propagates rapidly. Additionally, the peak heat release rate in the PC reaches a maximum of 2.83 J/°CA at 10 MPa condition, while the smallest peak heat release rate occurs at 15 MPa. This phenomenon is primarily attributed to the excessively high injection pressure, which shortens the evaporation time and reduces the efficiency of evaporation and mixing. Furthermore, the peak heat release rate phasing at 10 MPa injection pressure is −0.240 °CA, approximately 1 °CA earlier than the peak phasing at 15 MPa. This indicates that a moderate injection pressure can optimize the combustion progress in the PC.
Figure 8b shows the data of the MC. As injection pressure increases, the peak pressures are 4.18 MPa, 4.47 MPa, and 4.16 MPa, corresponding to phasing of 15.8 °CA, 15.0 °CA, and 15.9 °CA, respectively. The peak pressure increases initially and decreases subsequently, consistent with the trend of the first peak pressure in the PC. Additionally, the peak heat release rate in the MC is 36.5 J/°CA at 10 MPa condition.
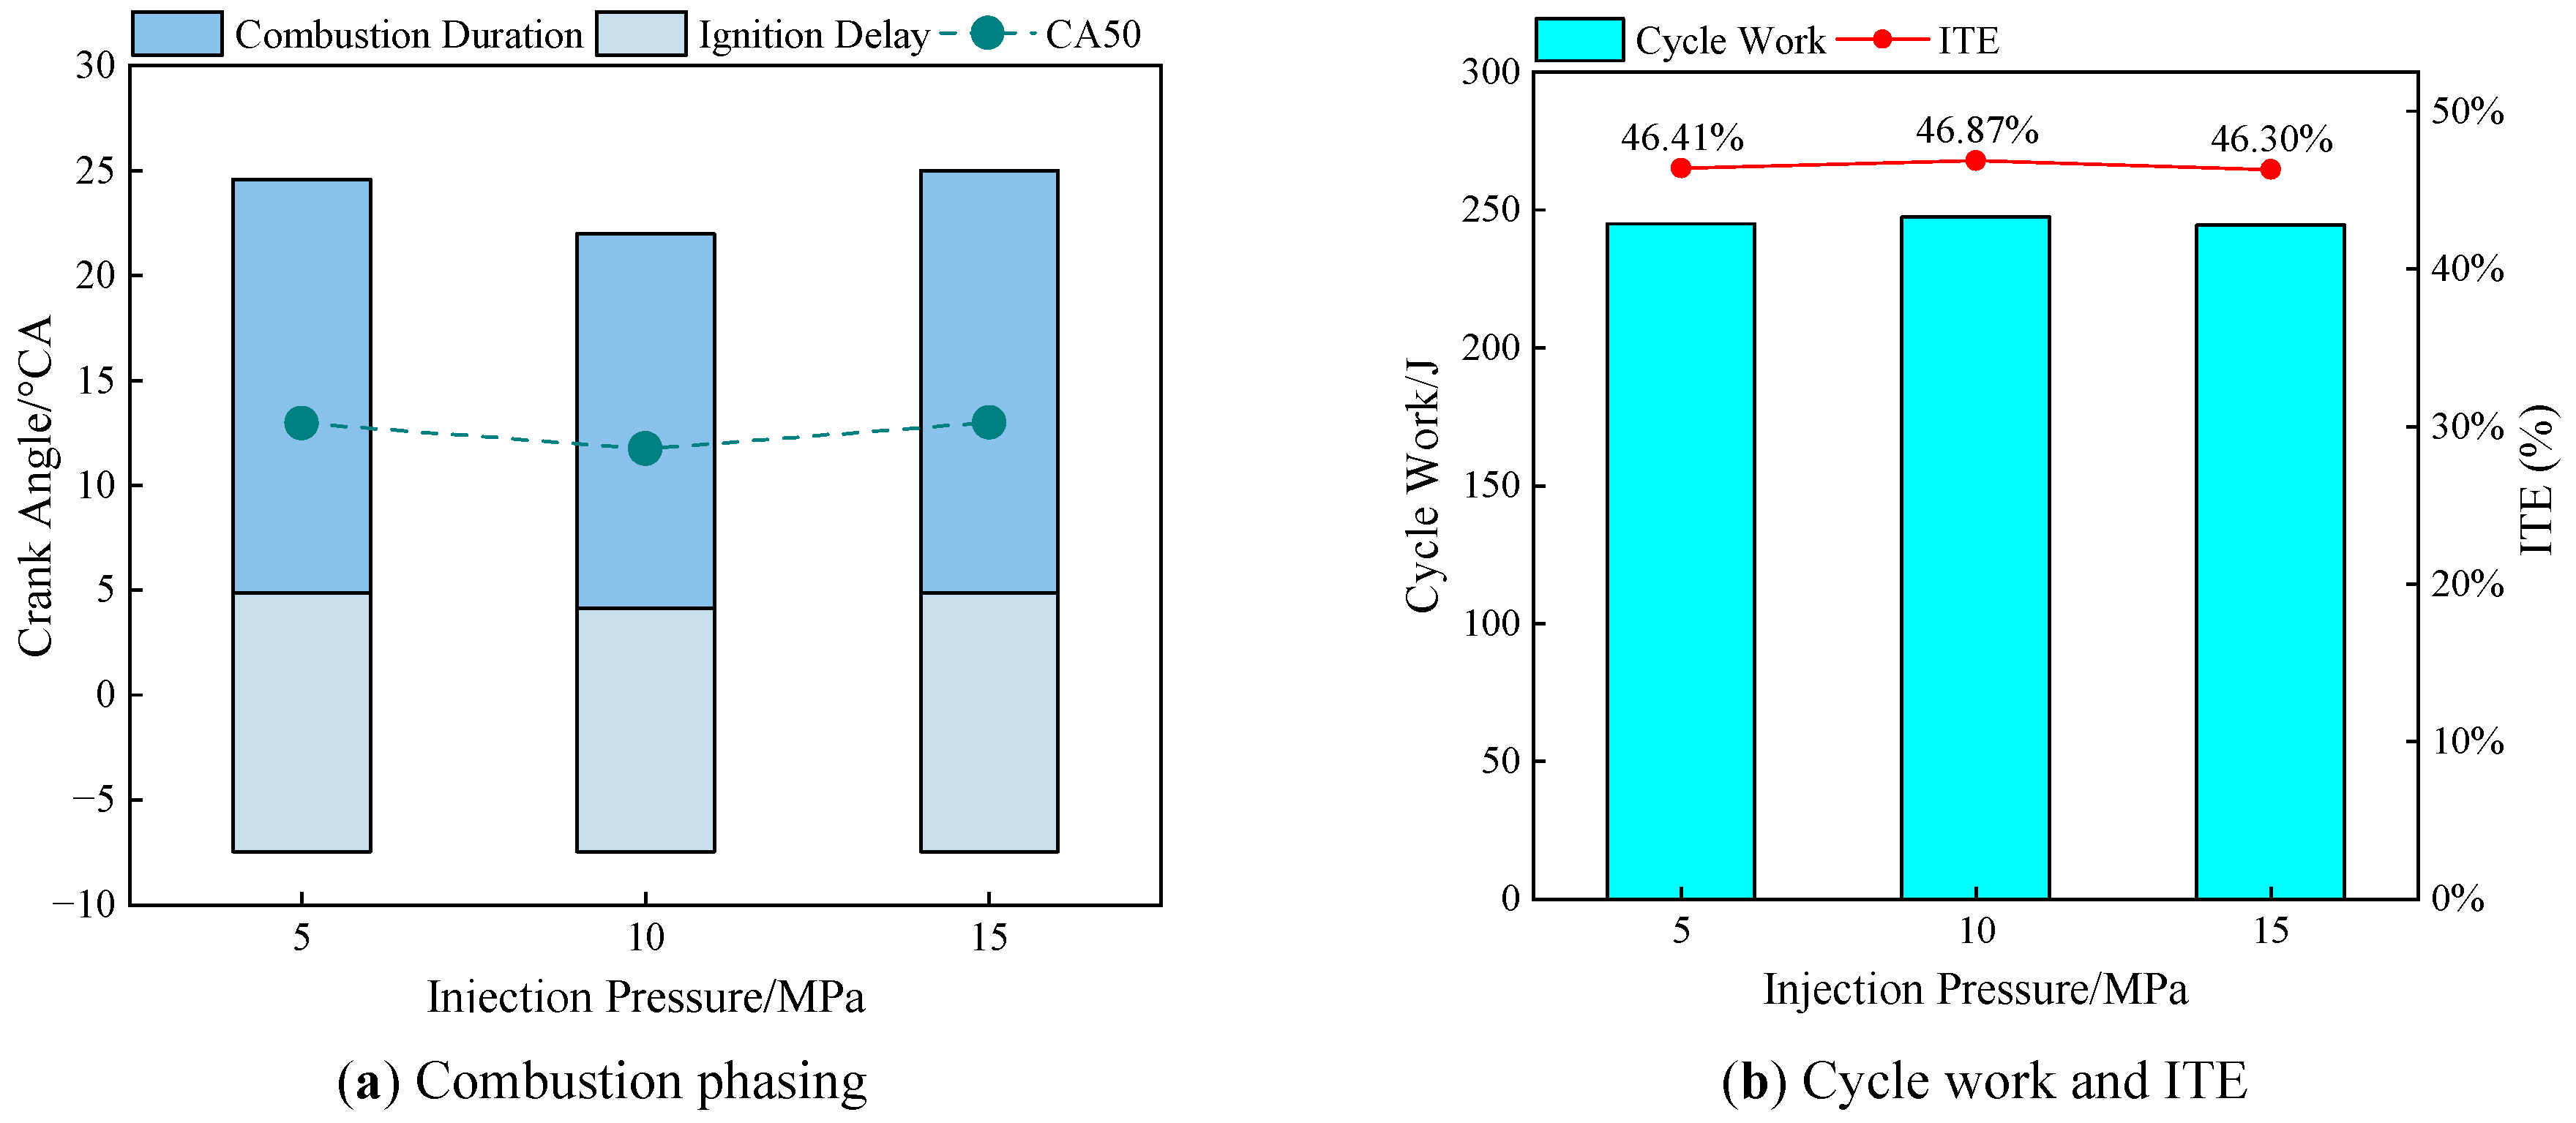
The Figure 9 shows the combustion characteristics and performance parameters of the engine with different PC injection pressures.
In Figure 9a, as the injection pressure increases, the ignition delay, CA50, and combustion duration first decrease and then increase. The prolonged ignition delay under the 5 MPa condition is primarily due to poor fuel atomization resulting from insufficient injection pressure. In contrast, for the 15 MPa case, the excessively high injection pressure reduces the evaporation and mixing efficiency, leading to unsatisfactory mixture preparation in the PC. Both two condition lead to slower combustion in the MC.
Figure 9b shows the cycle work and indicated thermal efficiency (ITE) under different injection pressures. The results show that under 10 MPa, the engine can achieve the maximum ITE (46.9%) and cycle work (248 J). However, the impact in injection pressure on cycle work and ITE is relatively small, with the maximum decrease in ITE being only 0.6%. This phenomenon indicates that the sensitivity of ITE to PC injection pressure is relatively low.
3.2. Effect of Pre-Chamber Injection Timing on In-Cylinder Combustion and Performance
As indicated in Section 3.1, the ITE is highest when the PC injection pressure is 10 MPa. Based on this pressure, this section will investigate the effects of varying PC injection timings on the engine performance and the associated mechanisms.
3.2.1. Effect on the Distribution of the Mixture Gas within Pre-Chamber with Varying Injection Timings
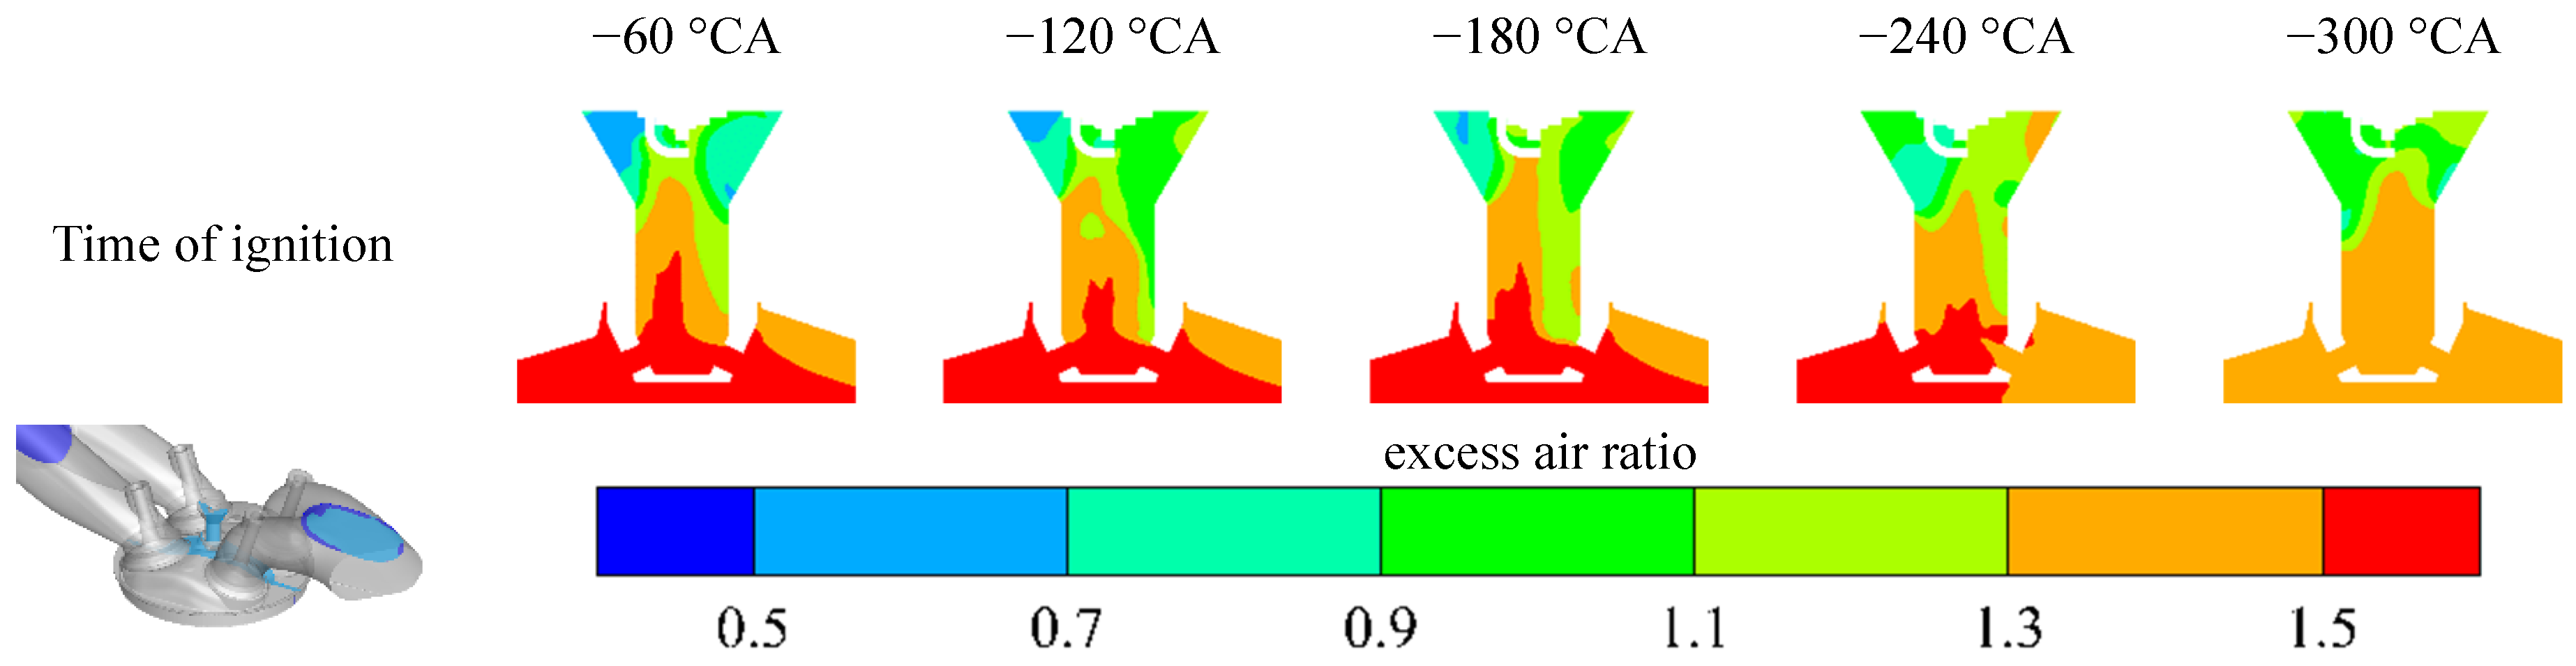
Figure 10 presents the excess air ratio in the PC with different injection timings at the time of ignition. Under the injection timing of −60 °CA, a mixture stratification phenomenon is observed in the PC. In contrast, under −300 °CA, the mixture distribution in the PC demonstrates relatively high uniformity. As the PC injection timing advances (from −60 °CA to −300 °CA), the mixing time increases, leading to improved mixture uniformity at the ignition timing, though the mixture also becomes leaner. Analysis suggests that before the time of injection, the downward movement of the piston creates a negative pressure between the PC and the MC, drawing the fuel from the PC into the MC. An advanced injection timing (−300 °CA) leads to an overall lean mixture in the PC, while a delayed injection timing (−60 °CA) results in insufficient mixing time, causing uneven distribution.
3.2.2. Effect on Jet Flame under Different Injection Timings
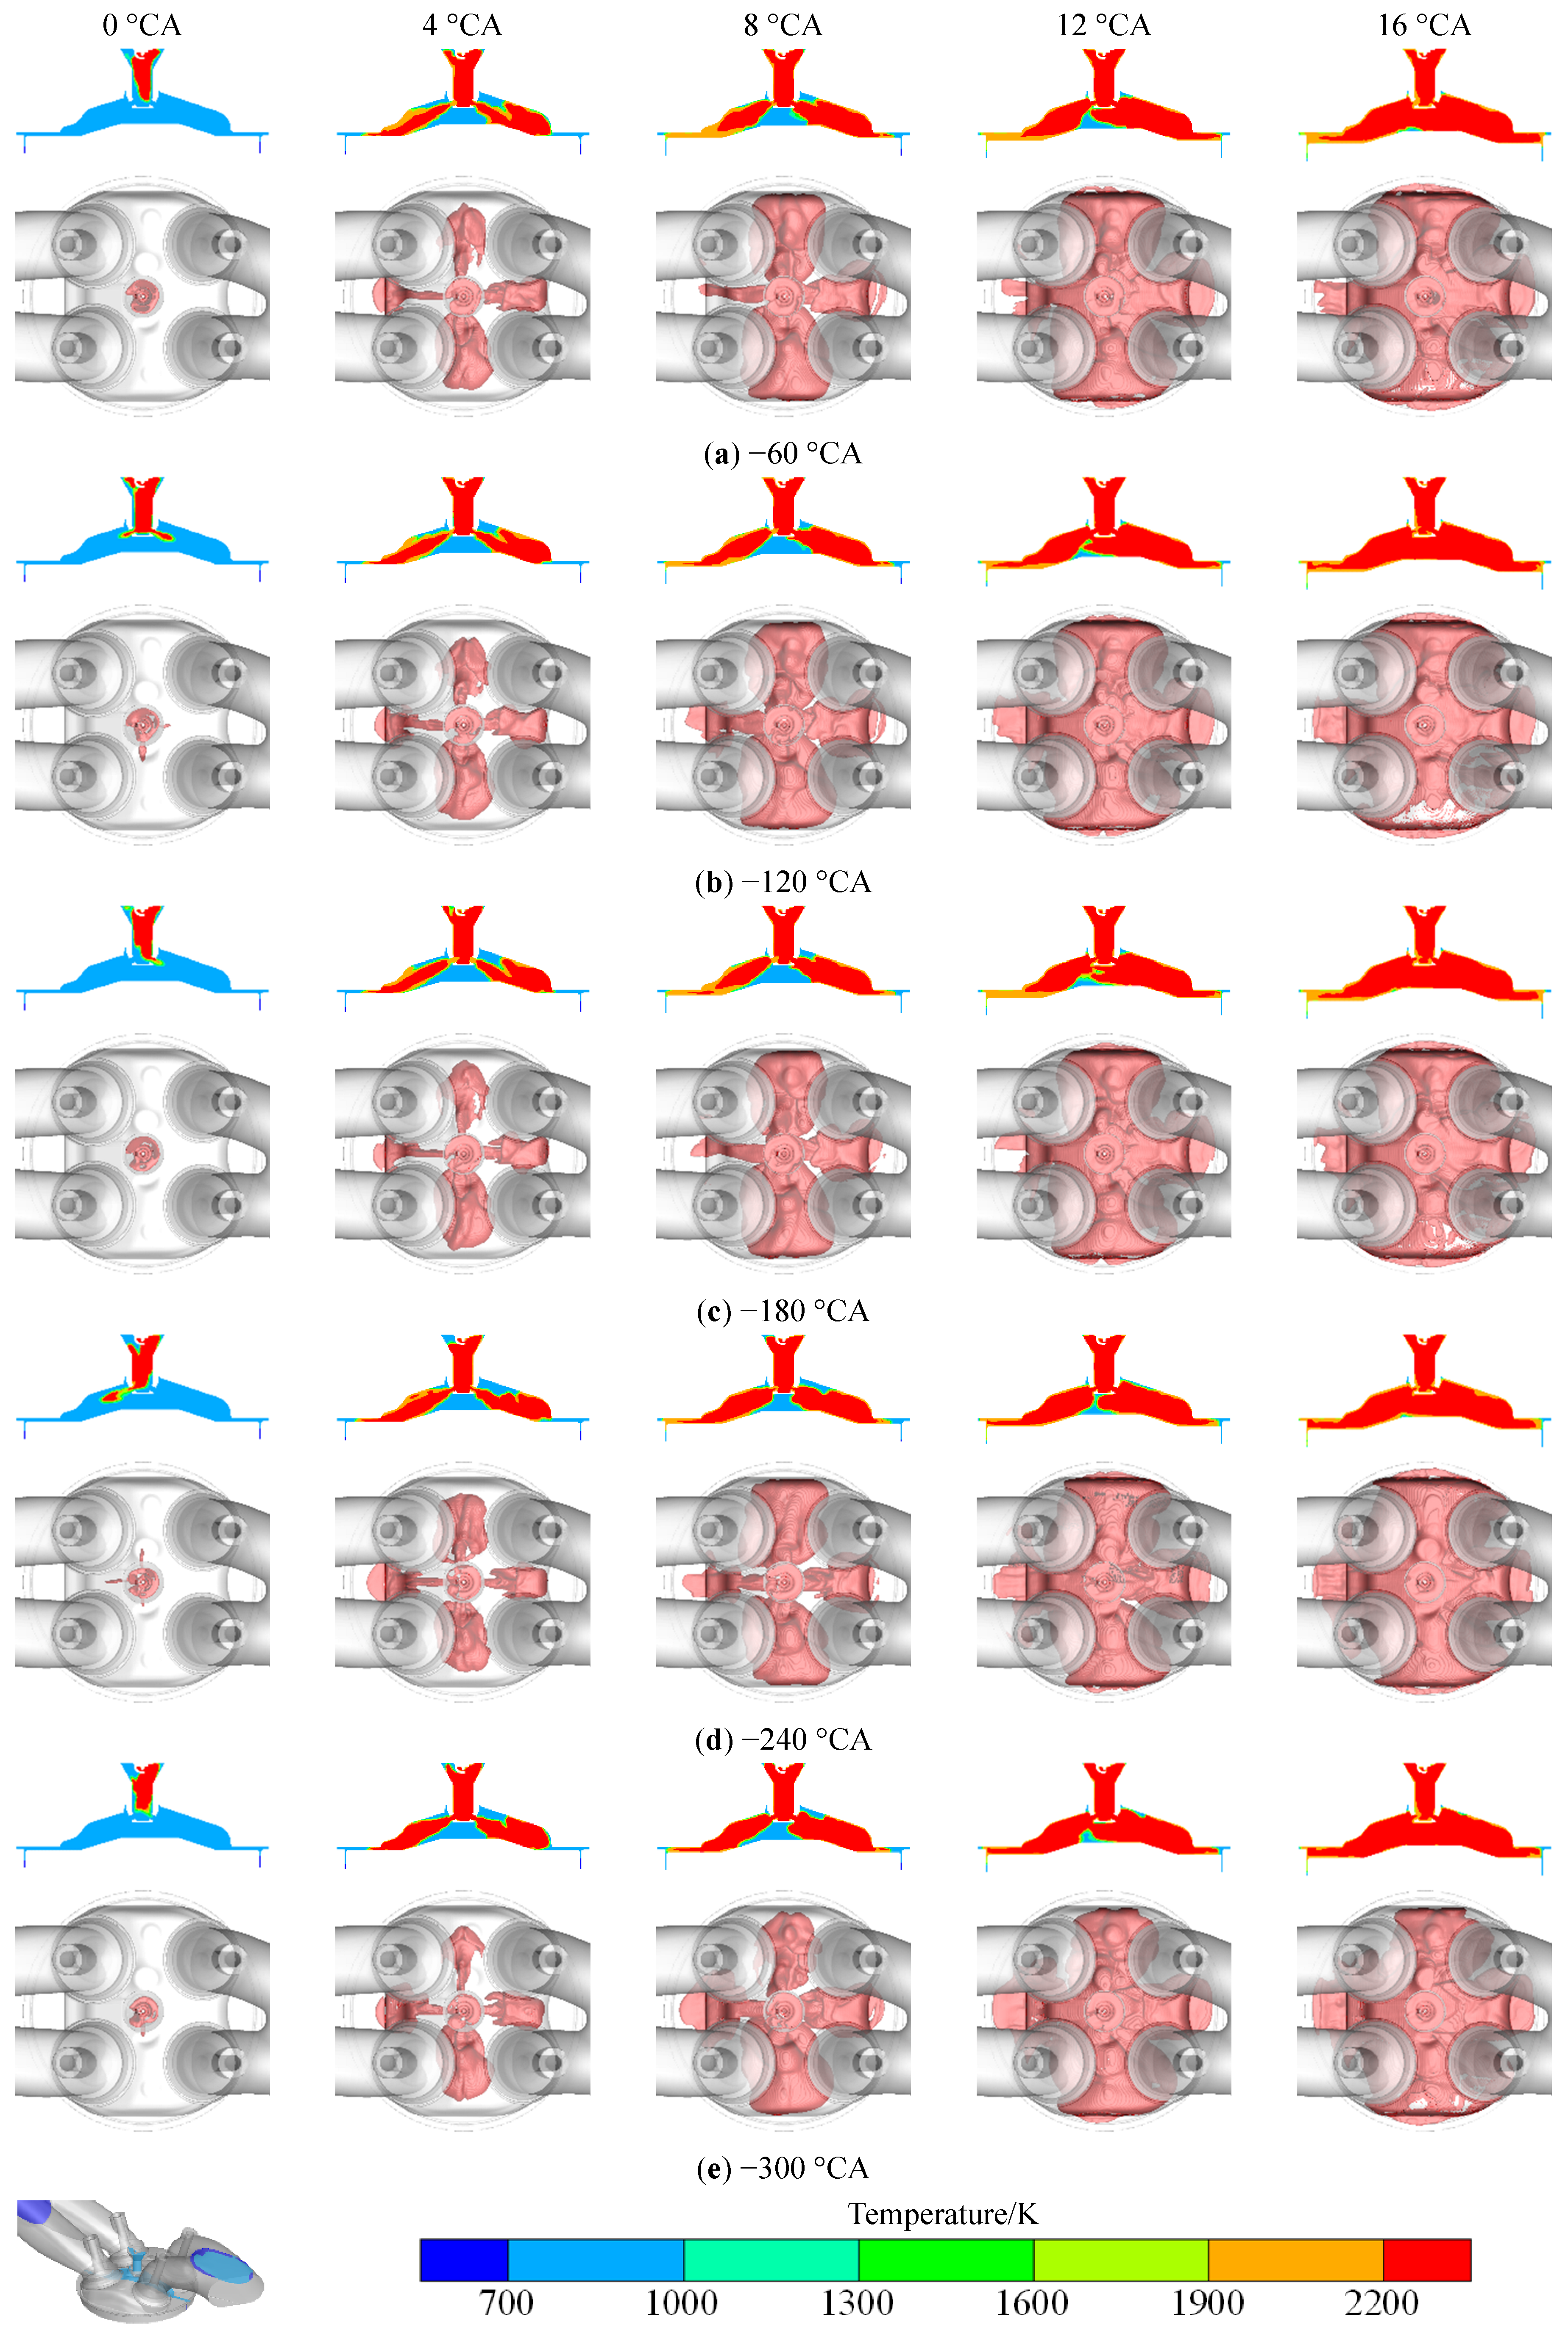
Figure 11 presents the cylinder temperature distribution and jet flame cloud at different injection timings. At top dead center of compression stroke, the jet flame has already entered the MC under all injection timings except for −60 °CA and −300 °CA. Under the −60 °CA condition, the delay is primarily due to insufficient mixing time, resulting in an uneven distribution of mixture concentration, which in turn leads to slow combustion. Under the −300 °CA condition, the cause of the delay is the excessively early injection timing, which makes the mixture enter the MC as the piston descends, leading to a decrease in mixture concentration. For the −120 °CA case, the fastest PC combustion and the smallest spread in flame arrival times among the nozzle holes yield the most uniform jet flames, enabling faster coverage of the entire MC. Additionally, as the jet flame develops, at the same moment, the area of high-temperature regions in the MC is basically consistent across different injection timings.
3.2.3. Effect on Combustion Characteristics under Different Injection Timings
Figure 12a shows the results of the PC. With the injection timing delayed (form −300 °CA to −60 °CA), the first peak pressure decreases (3.44 MPa, 3.34 MPa, 3.38 MPa, 3.26 MPa, and 3.22 MPa). The phasing corresponding to the peak pressure under 120 °CA condition is the earliest (0.421 °CA). The peak heat release rate also decreases (2.91 J/°CA, 2.83 J/°CA, 2.76 J/°CA, 2.55 J/°CA, and 2.51 J/°CA), while the peak pressure phasing occurs earliest at −120 °CA case (−0.240 °CA). With injection timing delayed, a decrease is observed in the volume of fuel leaking into the MC, which contributes to higher peak heat release rate and first peak pressure. However, the uneven mixture distribution under the −60 °CA condition leads to a delay in the peak phasing.
Figure 12b shows the results of the MC. As the injection timing advances, the maximum combustion pressures in the MC first increases and then decreases (4.23 MPa, 4.47 MPa, 4.30 MPa, 4.11 MPa, 4.11 MPa), and the peak heat release rate follows the same trend (33.0 J/°CA, 36.5 J/°CA, 35.3 J/°CA, 32.7 J/°CA, 30.8 J/°CA). Under the −120 °CA case, the phasing corresponding to these two peaks reach their earliest values (15.0 °CA, 10.4 °CA). For the −120 °CA case, the jet flame develops the fastest and most uniformly, enabling rapid ignition of the mixture in the MC, thereby achieving the highest combustion pressure and peak heat release rate.
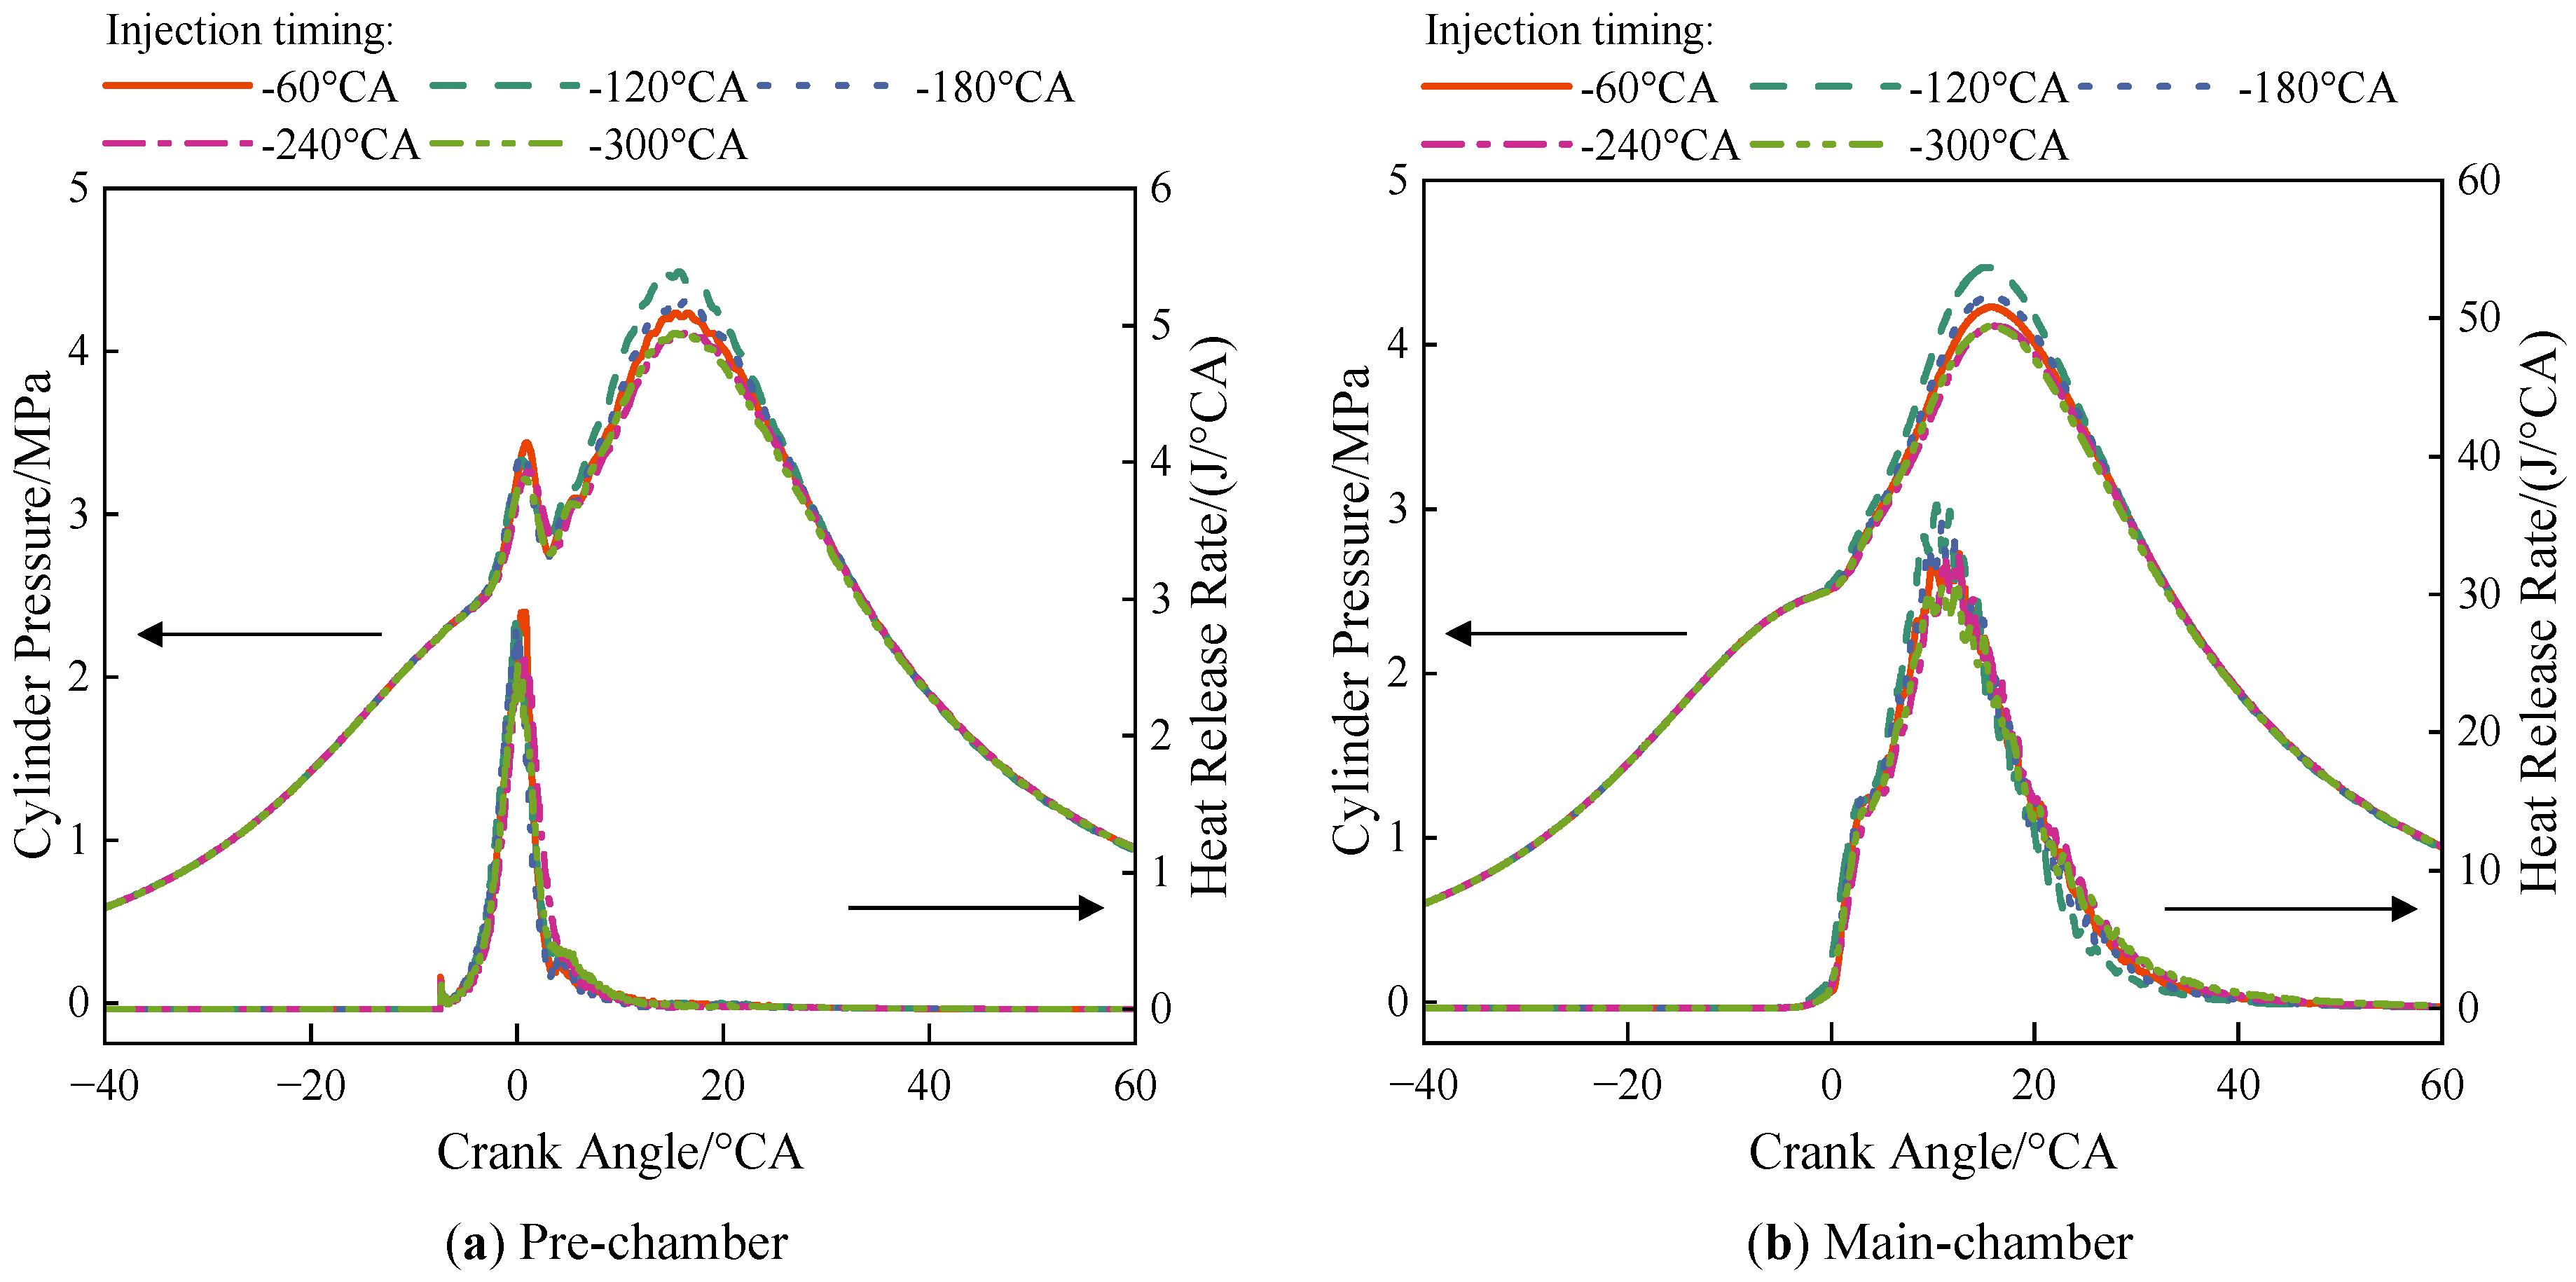
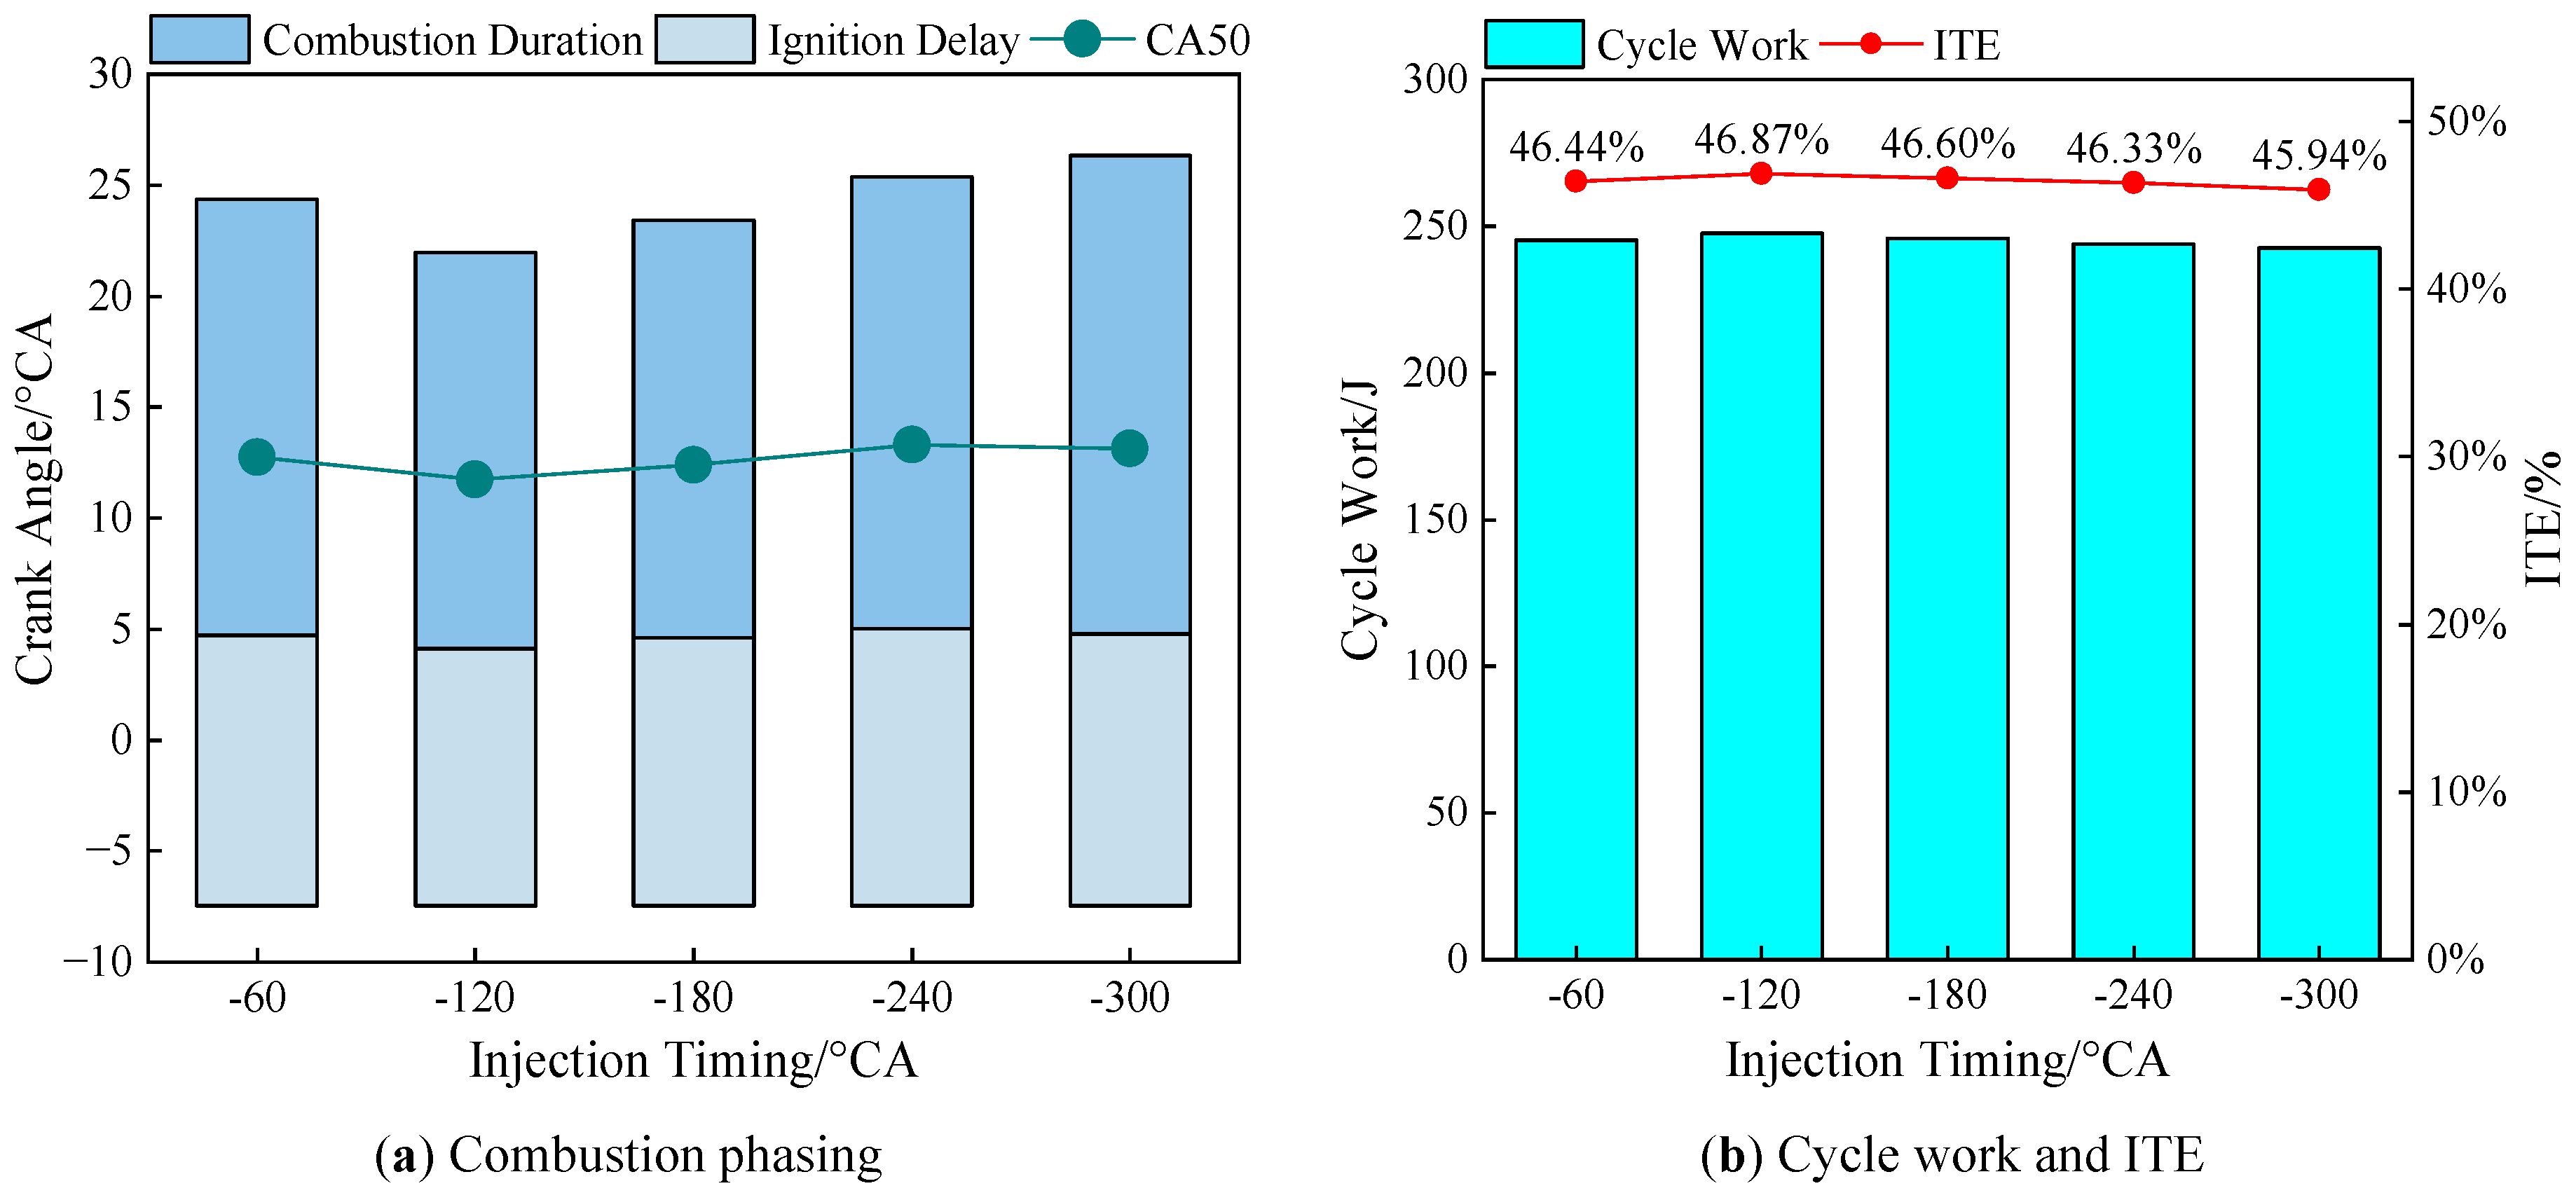
Figure 13 shows the combustion characteristics and performance parameters with different injection timings.
In Figure 13a, with injection timing delayed, the ignition delay, CA50, and combustion duration decrease initially and increase subsequently. Among these, at the injection timing of −120 °CA, the aforementioned parameters reach their minimum values (11.6 °CA, 11.7 °CA, and 17.8 °CA, respectively). With the advance of injection timing (from −60 °CA to −300 °CA), the mixture concentration in the PC decreases, resulting in insufficient subsequent jet energy, which prolongs the combustion duration in the MC. However, under the −300 °CA condition, the combustion duration and CA50 are slightly lower than those under the −240 °CA condition. This may be due to a more homogeneous mixture distribution in the PC under the −300 °CA condition, leading to more complete combustion.
Figure 13b illustrates the characteristics of the cycle work and ITE. with injection timing delayed, both the cycle work and ITE increase initially and decrease subsequently., reaching their maximum values of 248 J and 46.9%, respectively, at −120 °CA. Although the injection timing varies, the ITE remains mostly above 46%, only dropping to 45.9% at −300 °CA, which is merely 1.0% lower than the maximum value. While the injection timing significantly affects the mixture distribution in the PC, its impact on engine performance parameters such as ITE is relatively small.
3.3. Effect of Spark Plug Position on In-Cylinder Combustion and Performance
Based on the foregoing analysis, the PC fuel injection pressure and injection timing influence the in-cylinder combustion process by affecting the mixture distribution. The highest thermal efficiency is achieved at a PC injection pressure of 10 MPa and an injection timing of –120 °CA. On this basis, this section analyzes the effect of spark plug position on in-cylinder combustion and performance. Variations in spark plug position affect the location of flame kernel formation, causing the flame kernel to interact with mixture regions of different concentrations, thereby altering combustion characteristics. In addition, changes in spark plug position also lead to variations in the spatial configuration of the PC, which in turn affects the mixture distribution and indirectly regulates the combustion process. Therefore, it is necessary to investigate the specific effects and underlying mechanisms of spark plug position on in-cylinder combustion and performance, considering the position-induced changes in flame kernel formation location and geometric structure.
3.3.1. Flame Propagation within Pre-Chamber under Different Spark Plug Locations
Figure 14 shows the excess air ratio in the PC with different spark plug positions. This view is a slice made in the YZ plane (the YZ plane is approximately parallel to the intake-to-exhaust direction), and the 3D schematic is shown in the lower left corner of Figure 14. As shown in the figure, the position of the spark plug dramatically affects the mixture distribution in the PC: when it deviates along the -Y direction, firstly a rich zone appears at the left of the spark plug due to the narrow area, which is not favorable for either the flame kernel and flame propagation. After further deviation, the rich zone disappeared because of the space on the left side is too tiny for fuel entering. At the same time, spark plug displacement can cause intensified stratification of the mixture in the PC. This hinders the rapid propagation of the flame in the PC, which may affect the timing of jet flame entering the MC. The above analysis illustrates how spark plug position-induced changes in PC geometry affect mixture distribution, which will further influence subsequent flame kernel development and jet quality.
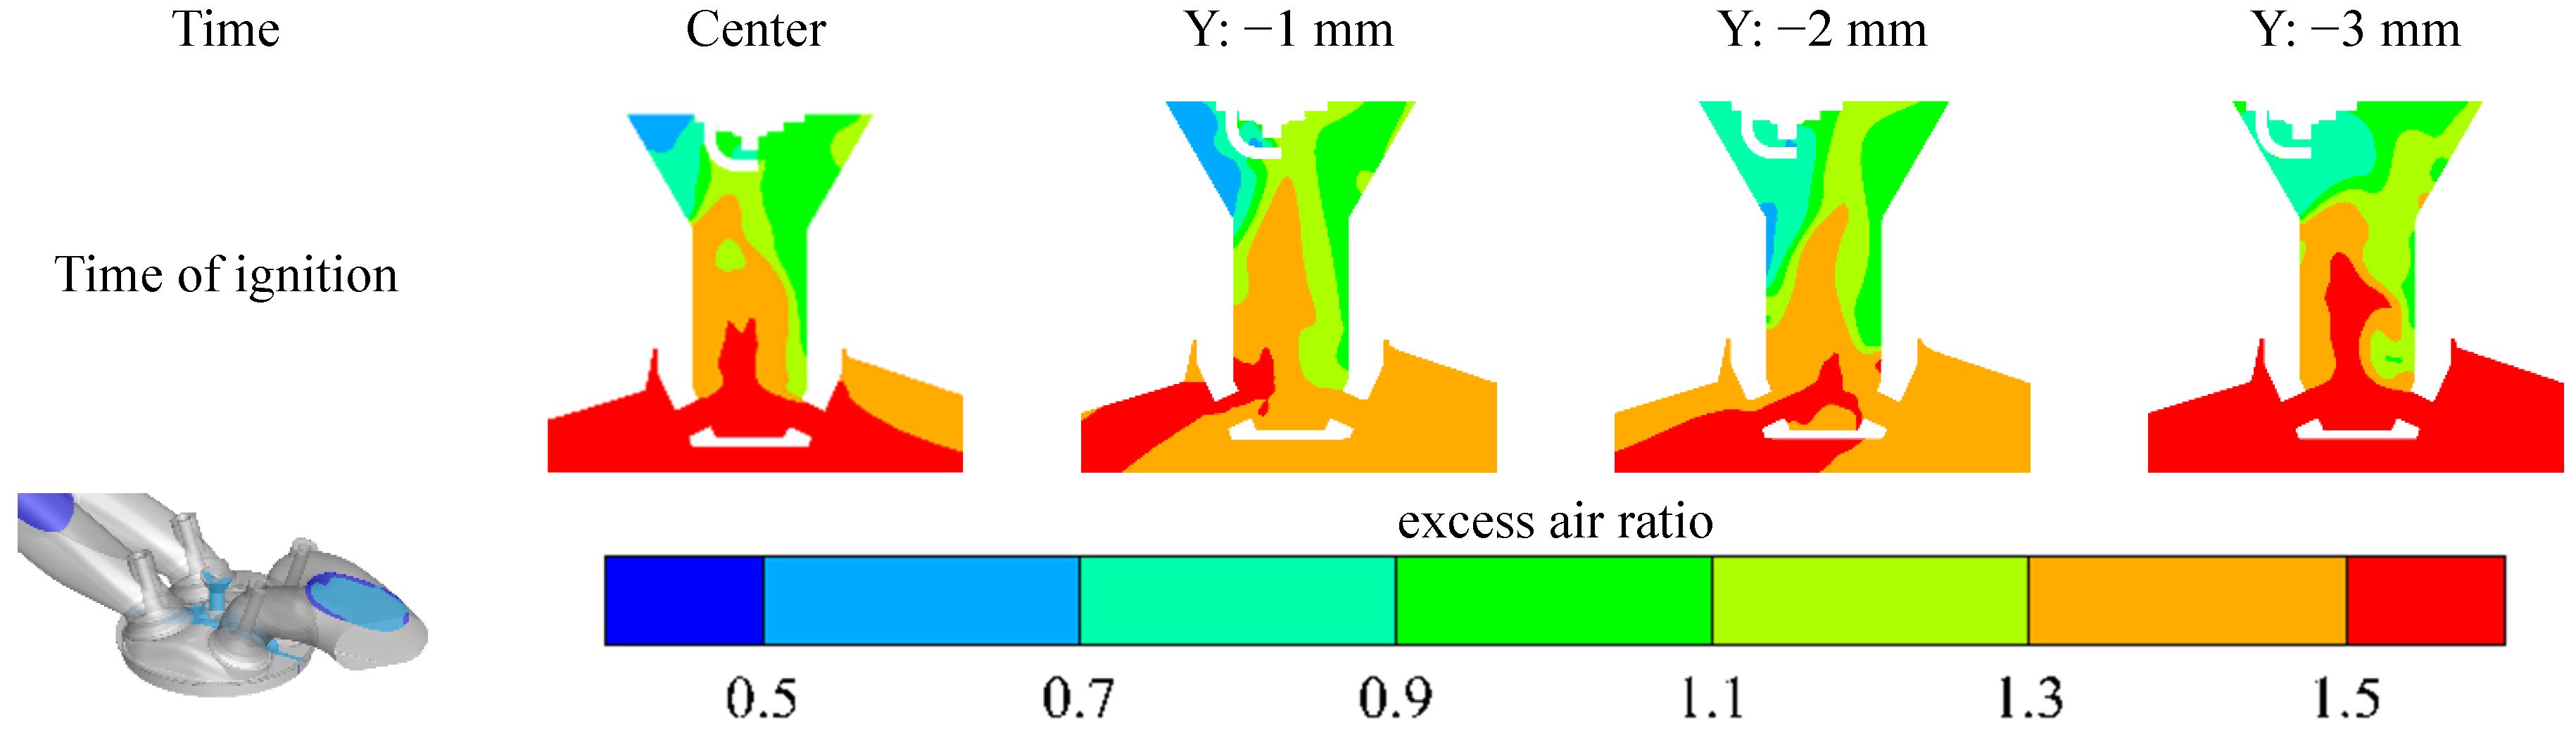
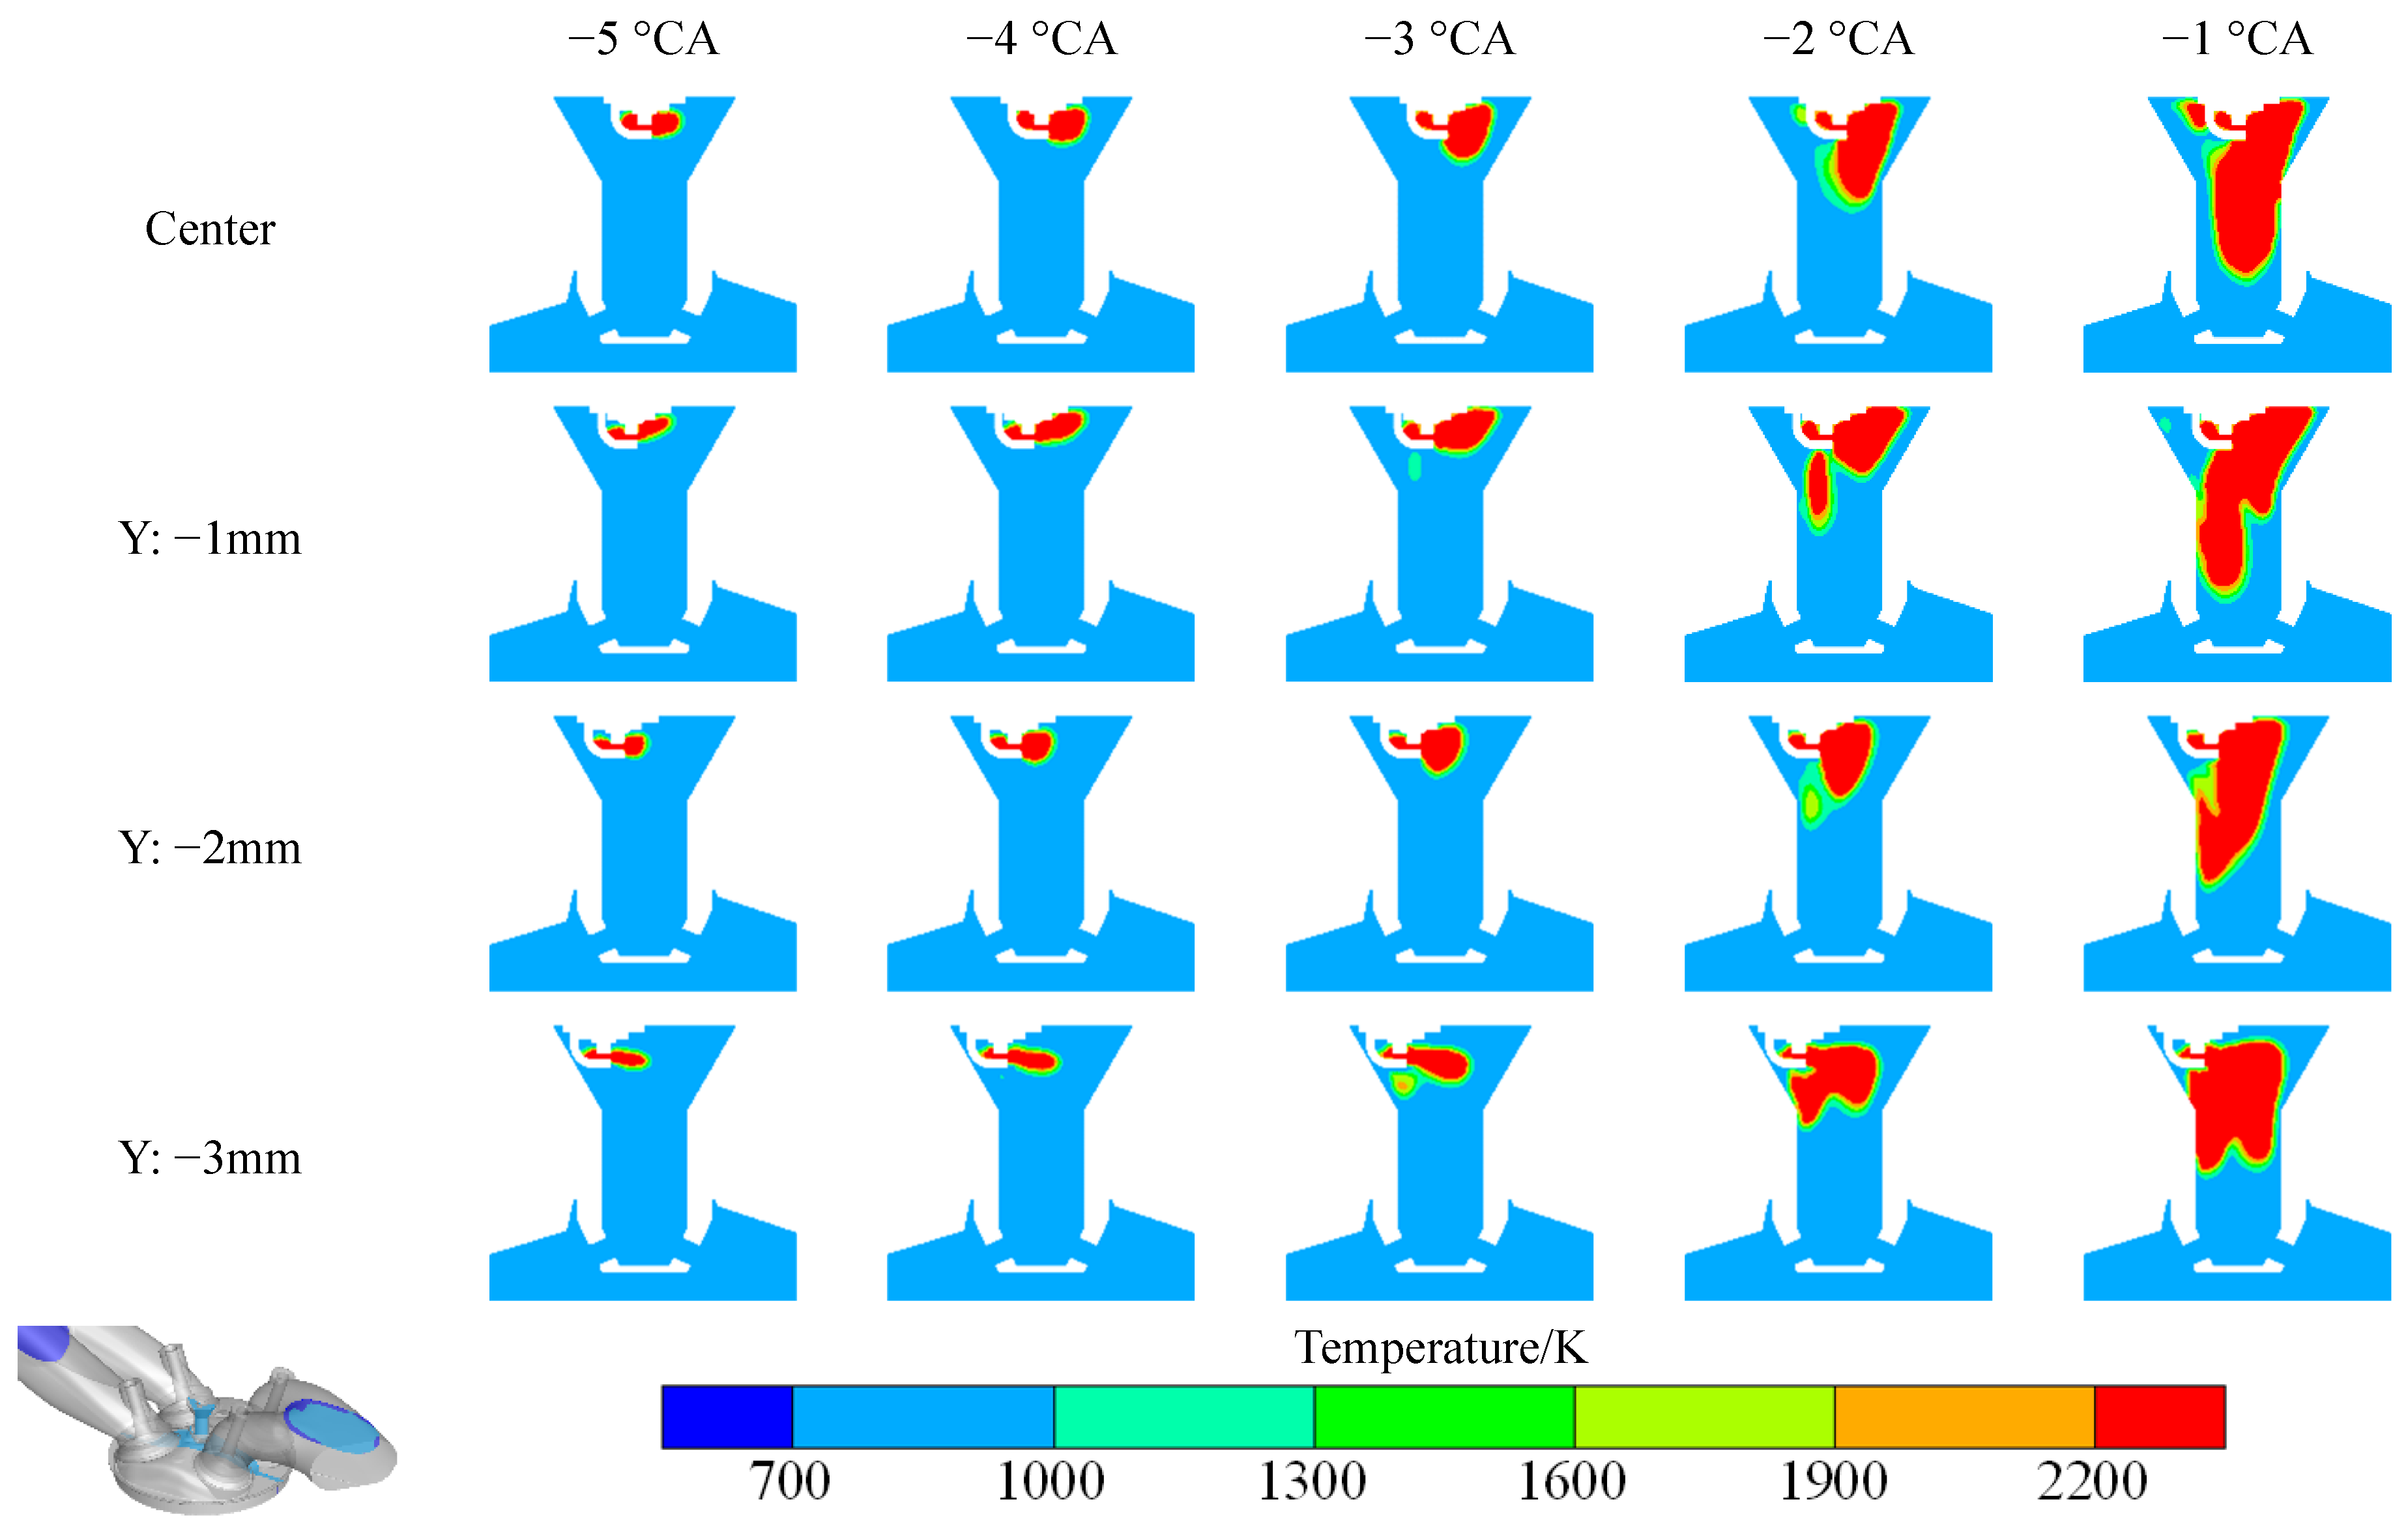
Figure 15 shows the temperature cloud map in the PC with different spark plug positions. As illustrated in the figure, in the initial stage, the impact of the spark plug position on the flame kernel is relatively small. However, as the flame further develops, the spark plug case closer to the center enables the flame to develop more rapidly. Nevertheless, compared to the center position at –1 °CA, a 1 mm offset yields a larger high-temperature zone. This is mainly due to the rich mixture under 1 mm offset condition is ignited by the high-temperature gas flow, thereby accelerating the flame propagation in the PC. This is primarily because the 1 mm offset case exhibits the largest proportion of in-PC excess air ratio in the range of 0.7–1.3, which facilitates rapid early flame development. At the same time, however, this case also suffers from excessive fuel leakage into the MC, and the largest fuel-rich zone appears in the narrow area between the spark plug and the upper-left PC region. The reason is speculated to be that the geometric configuration of this case is the smoothest, resulting in the smallest resistance to fuel diffusion into both the MC and that narrow region. In contrast, in the central case the spark plug obstructs fuel injection and diffusion, while in larger offset cases such as 2 mm and 3 mm, the ample space and fuel injection angle readily generate tumble flow, which also hinders fuel leakage.
3.3.2. Effect on Jet Flame under Different Spark Plug Locations
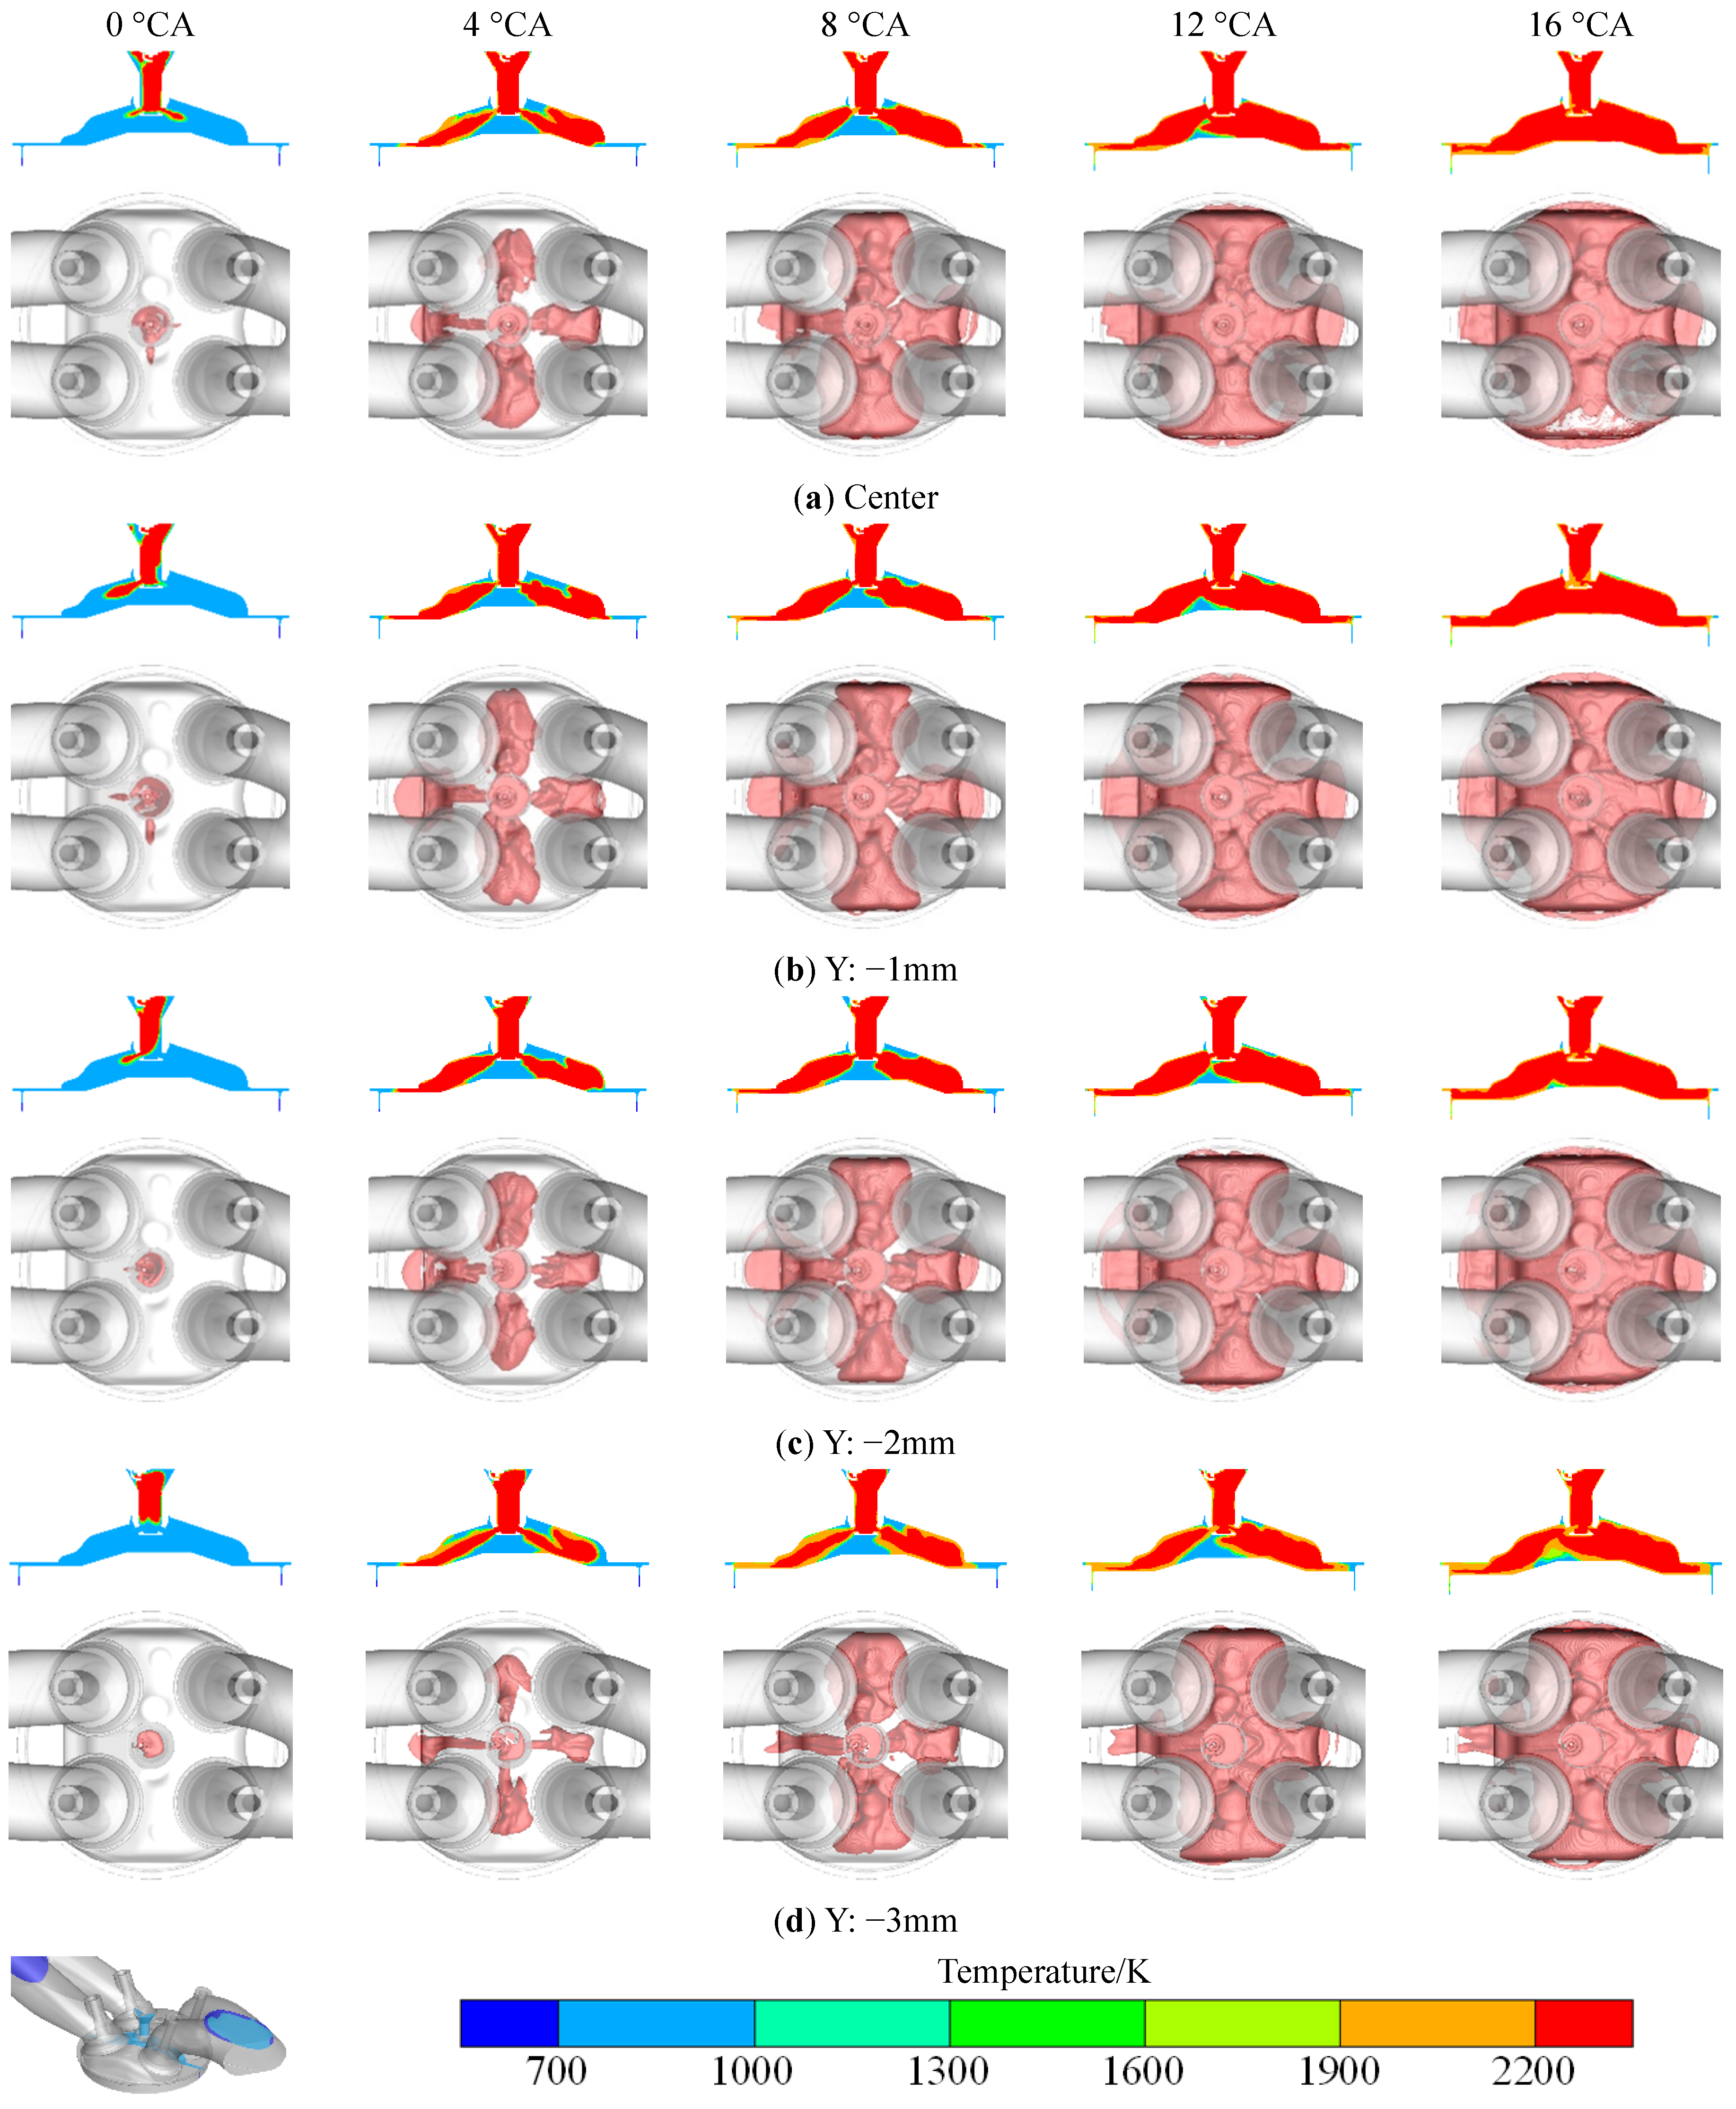
Figure 16 presents the cylinder temperature distribution and jet flame cloud images with different spark plug positions. As shown in the figure, at 0 °CA, the jet flames of all cases except the one with a 3 mm offset have already entered the MC, and the case with a 1 mm offset exhibits the largest jet flame area. By 16 °CA, the case with a 3 mm offset still shows an unburned region at the bottom of the MC, indicating that the active substances injected from the PC are insufficient. Meanwhile, for the case with a 1 mm offset, the temperature at the bottom orifice of the PC drops below 2200 K, resulting in an interrupted flame. It is inferred that incomplete combustion arises from a large unburned region at the upper-left corner of the igniter, while fuel leakage results in insufficient energy in the PC. Both factors jointly impede the later development of the flame jet. Besides, an offset flame kernel position typically causes earlier flame jet emergence on the offset side, as shown in the 1 mm and 2 mm offset cases. For the 3 mm offset case, however, the observed flame development trend suggests that the jets will propagate symmetrically. This is attributed to the mixture distribution in the PC for the 3 mm case, which inhibits the preferential flame development on a single side.
3.3.3. Effect on Combustion Characteristics under Different Spark Plug Locations
Figure 17 shows the cylinder pressure and heat release rate with varying spark plug positions.
Figure 17a displays the data of the PC. As the spark plug offset increases (from 0 to −3), the first peak pressures in the PC are 3.34 MPa, 3.39 MPa, 3.33 MPa, and 3.23 MPa, occurring at crank angles of 0.421 °CA, 0.301 °CA, 0.830 °CA, and 0.921 °CA, respectively. The case with a 1 mm offset achieves the highest first peak pressure of the PC and the earliest timing, indicating the shortest ignition delay and the fastest flame kernel formation and propagation. However, the centrally positioned spark plug results in the highest peak heat release rate (2.83 J/°CA, −0.240 °CA), suggesting more complete combustion. As discussed above, this phenomenon can be attributed to the incomplete combustion and insufficient energy in the PC for the –1 mm offset case.
Figure 17b presents the data in the MC. The combustion characteristics of the PC directly affect the performance of the jet flame, which subsequently influences the combustion in the MC. With the spark plug offset increasing, the peak combustion pressures rise, reaching 4.47 MPa, 4.33 MPa, 4.17 MPa, and 3.89 MPa, respectively. The corresponding crank angles follow the same trend as the first peak pressure of the PC. The case with a 1 mm offset exhibits the earliest phasing (15.0 °CA). The central spark plug achieves the highest peak heat release rate of 36.5 J/°CA at 10.4 °CA. However, the phasing corresponding to the peak heat release rate for the 1 mm offset is slightly later than that for the 2 mm offset. This phenomenon can be attributed to the uneven mixture distribution caused by a 1 mm offset, which leads to significant variations in jet flame size and development speed among the nozzle holes, thereby adversely affecting combustion. Although the flame of 1 mm offset case enters the MC earliest, it still adversely affects combustion performance.
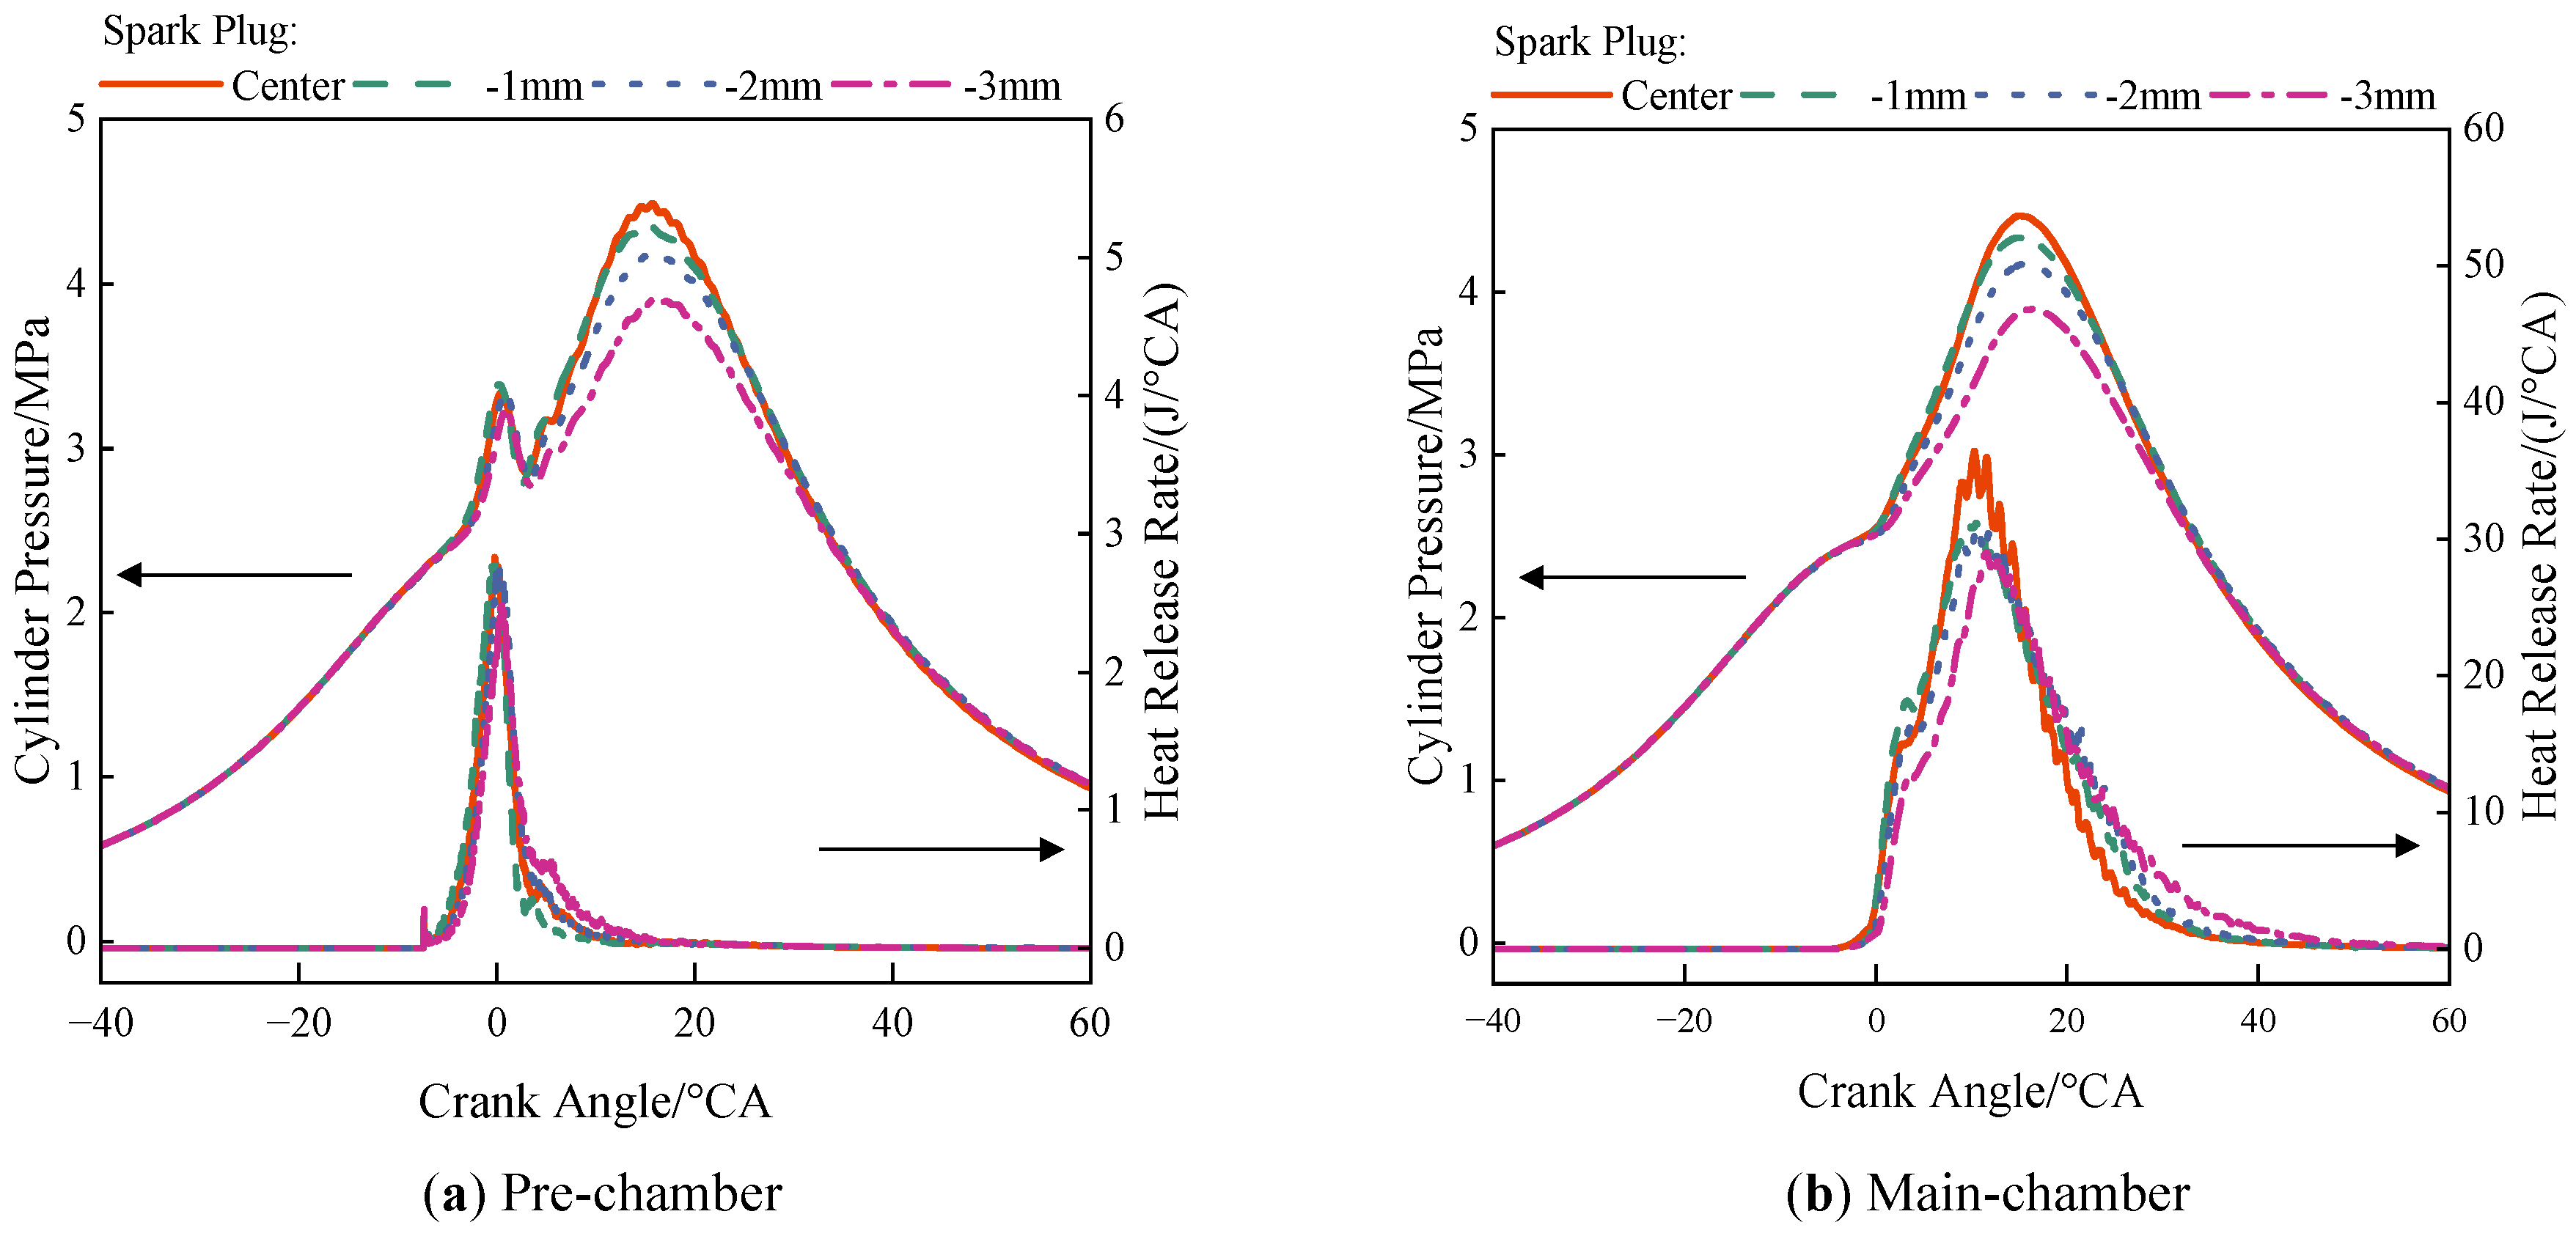
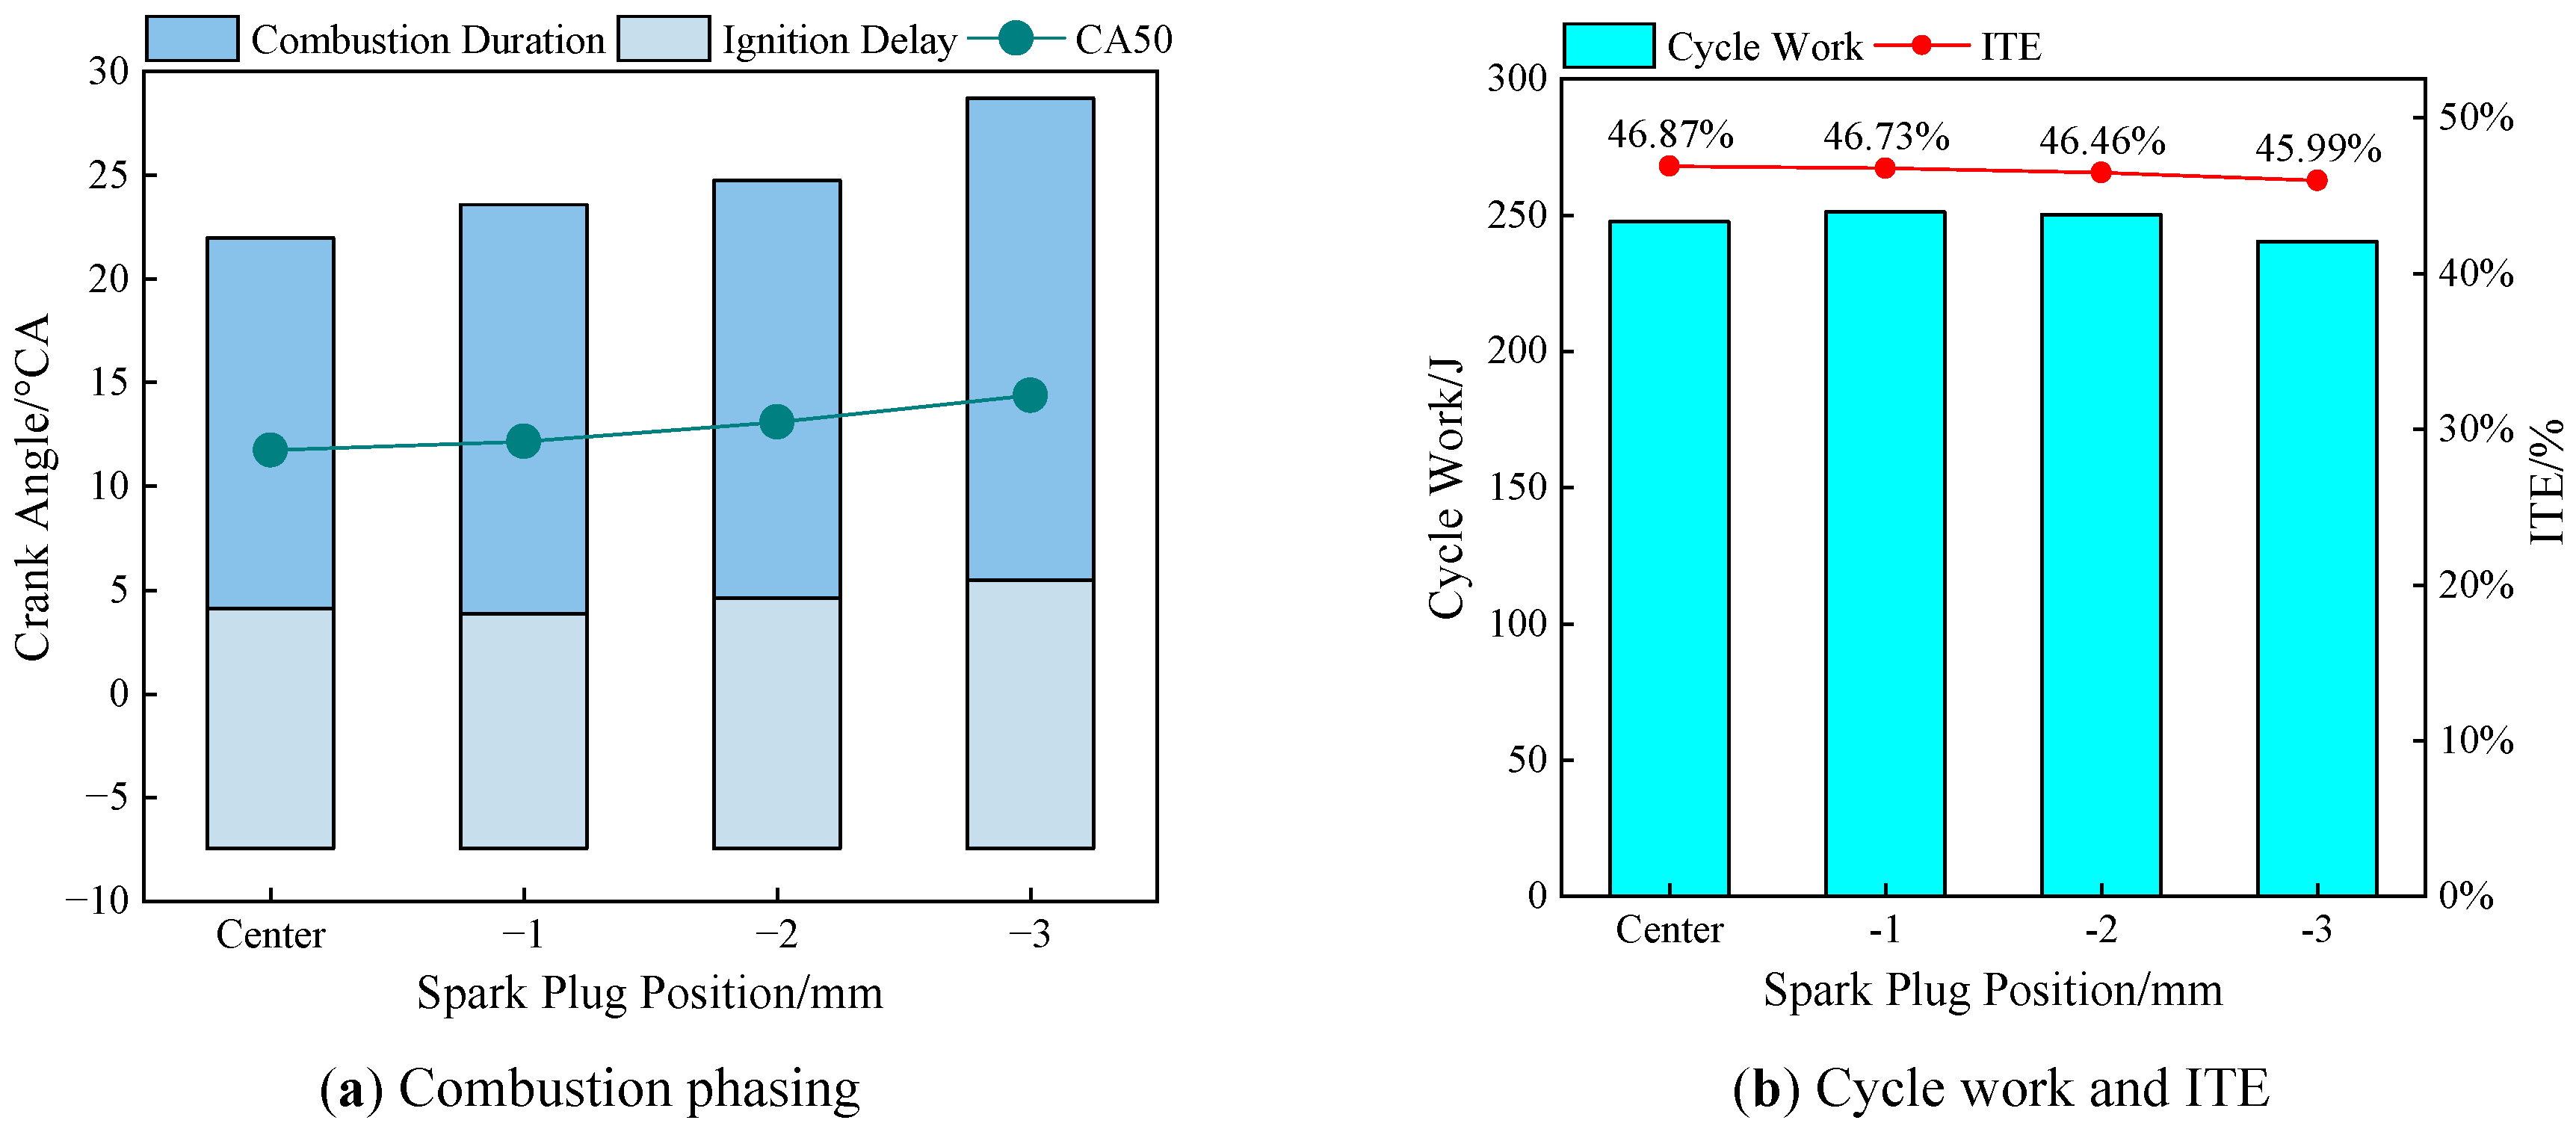
Figure 18 shows the combustion characteristics and performance parameters of the engine with different spark plug positions. Figure 18a is the comparison of combustion phasing. As the spark plug offset increases, CA50 and the combustion duration gradually increase. The center position case has CA50 and combustion duration values of 11.7 °CA and 22.0 °CA respectively. They are 2.64 °CA and 6.74 °CA earlier than the case with a 3 mm offset. Figure 18b is a comparison of cycle work and ITE. As the offset increases, the ITE gradually decreases. The cycle power first increases and then decreases, which is due to the error control of the excess air ratio value of the MC within ±0.2 in the simulation, resulting in a small fluctuation in cycle power.
4. Conclusions
In this study, numerical simulation is employed to analyze the influence mechanisms of PC injection pressure, injection timing, and flame kernel location on the combustion performance of a dedicated hybrid gasoline engine equipped with an active PC. The main conclusions are as follows:
(1) Injection pressure significantly alters the mixture distribution in the PC and combustion process. An excessively low injection pressure results in poor fuel atomization and evaporation, making it difficult to form a well-mixed mixture quickly. In contrast, due to the small volume of the PC, an excessively high injection pressure increases the jet penetration distance and shortens the evaporation time, thereby reducing the efficiency of evaporation and mixing, which is detrimental to the formation of an adequate mixture. A moderate injection pressure (10 MPa) provides the best balance between atomization and evaporation/mixing efficiency, such that the mixture near the spark plug approaches stoichiometric conditions.
(2) Injection timing represents a compromise between achieving PC mixture homogeneity and optimizing combustion phasing. An excessively early injection timing (−300 °CA) allows the PC mixture to diffuse into the MC, while an overly late timing (−60 °CA) leads to concentration stratification due to insufficient mixing time. A moderate timing (−120 °CA) achieves a well-mixed PC charge and the fastest, most uniform jet flame development among the nozzle holes, resulting in higher peak combustion pressure and ITE.
(3) Changing the spark plug position alters both the PC geometry and the flame kernel location. The geometric change affects fuel injection and diffusion, thereby determining mixture distribution and subsequent combustion. The change in flame kernel location influences the flame propagation direction within the PC, thus governing jet symmetry. It should be noted that when the mixture distribution is highly non-uniform, the effect of flame kernel location on jet symmetry can be masked. Based on the above analysis, the design of the PC spatial structure should satisfy two requirements: The mixture is uniformly distributed within the PC, with an equivalence ratio suitable for combustion; Fuel leakage into the MC is minimized to ensure sufficient energy in the PC to support subsequent jet development.
Our study indeed has a limitation in that it does not investigate or discuss the heat transfer issues caused by the PC. Achieving leaner combustion typically requires stronger PC combustion and flame jets, which inevitably leads to excessive local heat transfer, structural damage, and eventual loss of jet ignition function, thereby reducing engine power output. This trade-off between lean combustion and thermal loads remains inadequately addressed in the literature.
Author Contributions
S.W.: investigation, software, visualization, validation, writing—original draft preparation; Y.L.: visualization, validation, writing—review & editing; T.L.: software, formal analysis, writing—review & editing; Q.L.: software, formal analysis, visualization.; X.Z.: methodology, resources; J.W.: investigation, visualization; Z.K.: conceptualization, methodology, investigation, software, formal analysis, writing—review & editing, supervision, resources, funding acquisition. All authors have read and agreed to the published version of the manuscript.
Funding
This research was funded by Chongqing Technology Innovation and Application Development Project (Grant No. CSTB2025TIAD-KPX0049) and the Fundamental Research Funds for the Central Universities (Grant No. 2024CDJXY005).
Institutional Review Board Statement
Not applicable.
Informed Consent Statement
Not applicable.
Data Availability Statement
Data will be made available on request.
Conflicts of Interest
The authors declare that they have no known competing financial interests or personal relationships that could have appeared to influence the work reported in this paper. The author Y.L. is an employee of the company China Merchants Testing Vehicle Technology Research Institute Co., Ltd. The author X.Z. is an employee of the company Dongfeng Liuzhou MOTOR Co., Ltd. The authors declare that this affiliation is the only potential conflicts of interest related to this work and that they did not influence the design, execution, analysis, interpretation, or presentation of the research.
Use of AI and AI-Assisted Technologies
No AI tools were utilized for this paper.
Nomenclature
| AMR | Adaptive Mesh Refinement |
| CFD | Computational Fluid Dynamics |
| °CA | Crank Angle Degree |
| ICE | Internal Combustion Engine |
| ITE | Indicated Thermal Efficiency |
| MC | Main-chamber |
| PC | Pre-chamber |
| PFI | Port Fuel Injection |
| SI | Spark Ignition |
| TJI | Turbulent Jet Ignition |
| TKE | Turbulent Kinetic Energy |
References
- 1.
Senecal, P.; Leach, F. Diversity in Transportation: Why a Mix of Propulsion Technologies Is the Way Forward for the Future Fleet. Results Eng. 2019, 4, 100060.
- 2.
Bunce, M.; Blaxill, H. Sub-200 g/kWh BSFC on a Light Duty Gasoline Engine. In Proceedings of the SAE 2016 World Congress and Exhibition, Detroit, MI, USA, 12–14 April 2016.
- 3.
Liu, Y.; Gong, Y.; Li, J. Research and Development on The Pre-Chamber Technology for Gasoline Engine. Automot. Dig. 2019, 11, 11–15. (In Chinese)
- 4.
Yu, S.; Zheng, M. Future Gasoline Engine Ignition: A Review on Advanced Concepts. Int. J. Engine Res. 2021, 22, 1743–1775.
- 5.
Jeon, J. Spatiotemporal Flame Propagations, Combustion and Solid Particle Emissions from Lean and Stoichiometric Gasoline Direct Injection Engine Operation. Energy 2020, 210, 118652.
- 6.
Huang, Y.; Surawski, N.C.; Zhuang, Y.; Zhou, J.L.; Hong, G. Dual Injection: An Effective and Efficient Technology to Use Renewable Fuels in Spark Ignition Engines. Renew. Sustain. Energy Rev. 2021, 143, 110921.
- 7.
Blankmeister, M.; Alp, M.; Shimizu, E. Passive Pre-Chamber Spark Plug for Future Gasoline Combustion Systems with Direct Injection. In Proceedings of the Ignition Systems for Gasoline Engines: 4th International Conference, Berlin, Germany, 6–7 December 2018; pp. 149–174.
- 8.
Benajes, J.; Novella, R.; Gomez-Soriano, J.; Barbery, I.; Libert, C.; Rampanarivo, F.; Dabiri, M. Computational Assessment towards Understanding the Energy Conversion and Combustion Process of Lean Mixtures in Passive Pre-Chamber Ignited Engines. Appl. Therm. Eng. 2020, 178, 115501.
- 9.
Kyrtatos, P.; Bardis, K.; Bolla, M.; Denisov, A.; Wright, Y.; Herrmann, K.; Boulouchos, K. Transferability of Insights from Fundamental Investiga-Tions into Practical Applications of Prechamber Com-Bustion Systems. In Proceedings of the Ignition Systems for Gasoline Engines: 4th International Conference, Berlin, Germany, 6–7 December 2018; pp. 442–45
- 10.
Boust, B.; Sotton, J.; Labuda, S.; Bellenoue, M. A Thermal Formulation for Single-Wall Quenching of Transient Laminar Flames. Combust. Flame 2007, 149, 286–294.
- 11.
Duan, W.; Huang, Z.; Chen, H.; Tang, P.; Wang, L.; Chen, W. Effects of Passive Pre-Chamber Jet Ignition on Combustion and Emission at Gasoline Engine. Adv. Mech. Eng. 2021, 13. https://doi.org/10.1177/16878140211067148.
- 12.
Luo, J.; Ma, B.; Kang, Z. A Brief Review of the Development of Lean Combustion Technology Based on Active/Passive Pre-Chambers. In the Proceedings of China SAE Congress 2022: Selected Papers, Shanghai, China, 22 October 2022; pp. 188–194.
- 13.
Stadler, A.; Sauerland, H.; Härtl, M.; Wachtmeister, G. The Potential of Gasoline Fueled Pre Chamber Ignition Combined with Elevated Compression Ratio. In Proceedings of the WCX SAE World Congress Experience, Detroit, MI, USA, 21–23 April 2020.
- 14.
Zhang, L.; Huang, Z.; Wang, T.; Zhao, N.; Cheng, H.; Chen, W. Lean Combustion and Emission Performance of a Gasoline Direct Injection Engine with Active Pre-Chamber. Adv. Mech. Eng. 2022, 14. https://doi.org/10.1177/16878132221113453.
- 15.
Zhu, C.; Wooldridge, M.S. An Experimental Investigation of the Effects of Fuel Injection Pressure and Engine Speed and Load on Pre-Chamber Combustion Characteristics. Fuel 2024, 366, 131220.
- 16.
Wang, B.; Xie, F.; Hong, W.; Du, J.; Chen, H.; Li, X. Extending Ultra-Lean Burn Performance of High Compression Ratio Pre-Chamber Jet Ignition Engines Based on Injection Strategy and Optimized Structure. Energy 2023, 282, 128433.
- 17.
Validi, A.; Schock, H.; Jaberi, F. Turbulent Jet Ignition Assisted Combustion in a Rapid Compression Machine. Combust. Flame 2017, 186, 65–82.
- 18.
Hua, J.; Zhou, L.; Gao, Q.; Feng, Z.; Wei, H. Influence of Pre-Chamber Structure and Injection Parameters on Engine Performance and Combustion Characteristics in a Turbulent Jet Ignition (TJI) Engine. Fuel 2021, 283, 119236.
- 19.
Kou, H.; Hu, W.; Li, T.; Duan, Q.; Yin, X.; Duan, H.; Zeng, K. Effects of Injection Timing on Combustion and Mixture Formation of a Methanol Direct Injection Engine Equipped with a Small Volume Passive Pre-Chamber. Fuel 2025, 384, 133910.
- 20.
Bunce, M.; Blaxill, H.; Cooper, A. Development of Both Active and Passive Pre-Chamber Jet Ignition Multi-Cylinder Demonstrator Engines. In Proceedings of the 28th Aachen Colloquium Automobile and Engine Technology, Eurogress Aachen, Germany, 7–9 October 2019; pp. 907–941.
- 21.
Sementa, P.; Catapano, F.; Di Iorio, S.; Todino, M.; Vaglieco, B.M. Analysis of the Combustion Process of SI Engines Equipped with Non-Conventional Ignition System Architecture. In Proceedings of the CO2 Reduction for Transportation Systems Conference, online, 7–9 July 2020.
- 22.
Chen, L.; Zhang, S.; Zhang, R.; Li, J.; Yang, P.; Pan, J.; Wei, H. Optical Experiments on the Effect of Turbulent Jet Ignition on Lean Burning and Engine Knocking. Fuel 2022, 307, 121869.
- 23.
Rajasegar, R.; Niki, Y.; García-Oliver, J.M.; Li, Z.; Musculus, M.P. Fundamental Insights on Ignition and Combustion of Natural Gas in an Active Fueled Pre-Chamber Spark-Ignition System. Combust. Flame 2021, 232, 111561.
- 24.
Zhao, D.; An, Y.; Pei, Y.; Shi, H.; Wang, K. Numerical Study on the Asymmetrical Jets Formation from Active Pre-Chamber under Super-Lean Combustion Conditions. Energy 2023, 262, 125446.
- 25.
Zhao, D.; An, Y.; Pei, Y.; Hu, J.; Hu, Z.; Zhang, Y. Optical Study on Spray Mixing, Flame Propagation and Jets Evolution within Visible Methanol Active Pre-Chamber for Turbulent Jet Ignition. Energy Convers. Manag. 2024, 319, 118952. https://doi.org/10.1016/j.enconman.2024.118952.
- 26.
Hu, J.; An, Y.; Zhao, D.; Pei, Y. Study of Active Pre-Chamber Jet Flames Based on the synergy of Airflow with Different Nozzle Swirl Angle. Energy 2023, 282, 128198.
- 27.
Lv, Y.; Feng, S.; Luo, J.; Li, L.; Kang, Z. Study on the Influence of Passive Pre-Chamber Combustion Strategy on In-Cylinder Combustion and Emission Characteristics of Gasoline Engines. Automot. Eng. 2024, 46, 1633–1642. (In Chinese)

This work is licensed under a Creative Commons Attribution 4.0 International License.

 Suite 4002 Level 4, 447 Collins Street, Melbourne, Victoria 3000, Australia
 General Inquiries: info@sciltp.com