

Downloads
Download


This work is licensed under a Creative Commons Attribution 4.0 International License.
Article
Enhancing the Reliability Assessment System for Crucial Powertrain Components through Design, Simulation, and Experiment
Xiaochun Zeng 1,2,3, Gongcheng Wang 1,* , Ying Liu 2,3, Jing Liu 1,2,3, Yinglian Feng 2,3,4, Xiuyong Shi 5,6, Diming Lou 5,6, Lei Zhang 4, Tao Wei 1, and Zhong Li 1
1 Jiangling Motors Co. Ltd., Nanchang 330001, China
2 Jiangxi Province Women Science and Technology Workers Association, Nanchang 330036, China
3 Jiangxi Mechanical Engineering Society, Nanchang 330002, China
4 Magna PT Powertrain (Jiangxi), Nanchang 330200, China
5 Nanchang Automotive Institute of Intelligence & New Energy, Nanchang 330052, China
6 Tongji University, Shanghai 200092, China
* Correspondence: gwang7@jmc.com.cn
Received: 5 September 2023
Accepted: 19 September 2023
Published: 20 September 2023
Abstract: This article conducted innovative research on heat balance, cooling and structural strength by using Computer Aided Engineering (CAE), design, and experiment. These multifaceted approaches rely on the meticulous application of dynamic analysis, combustion analysis, fluid dynamics, and finite element analysis. This research has devised a fatigue-oxidation-creep multi-fatigue life prediction technique for thermal engines, coupled with an innovative water jacket optimization method. By addressing the design challenges arising from the demanding requirements of high explosion pressure, formidable power, and significant torque in power systems, this study has made significant strides in advancing the field. And this method was used to establish the development capability of powertrain electric drive components. To enhance reliability and prediction accuracy, a simulation and test calibration method was devised for Crucial Powertrain Components. This article establishes a robust foundation by providing comprehensive data support for reliability target decomposition, facilitating the efficient derivation of component reliability metrics. Additionally, it explores potential customer scenario failures and investigates the underlying mechanisms of powertrain malfunctions. By establishing a correlation matrix between failure modes, mechanisms, and reliability experiments, the coverage of powertrain failure mode verification experiments was significantly increased by over 95%. Ultimately, this article contributes to the formation of a comprehensive technical system for evaluating the reliability of crucial powertrain components, integrating design, simulation, and experiment.
Keywords:
reliability collaborative development simulation experiment calibration1. Introduction
Light commercial vehicles play a vital role in national economic sectors such as construction, transportation, fruit and forestry, and fishing. The importance of a dependable power system in these vehicles cannot be overstated. The constant evolution of light commercial vehicles, marked by remarkable advancements in explosion pressure and torque, has presented novel challenges in the realm of assessing the reliability of powertrain's crucial components [1]. This article focuses on requirements imposed by enhanced levels of explosion pressure and torque in the context of light commercial vehicle powertrains. It establishes a comprehensive system for evaluating the reliability of pivotal powertrain components through the interplay of design, simulation, and experimentation.
2. Thermal Engine Fatigue Assessment for Powertrain Based on Thermal Balance
2.1. Collaborative Development of Computer Aided Engineering (CAE), Design, and Experiment
The collaborative development of CAE, design, and experiment is shown in Figure 1. Based on dynamics, combustion, fluid, and finite element analysis, research has been conducted to investigate the thermal equilibrium, cooling, and structural strength of powertrain systems [2]. This study presents a comprehensive framework for predicting the fatigue-oxidation-creep multiple damage of thermal engines. Additionally, it explores the optimization of the water jacket system, establishes evaluation criteria for the water jacket flow field, develops calibration techniques for temperature distribution analysis, and proposes a standardized approach for evaluating cylinder hole deformation.
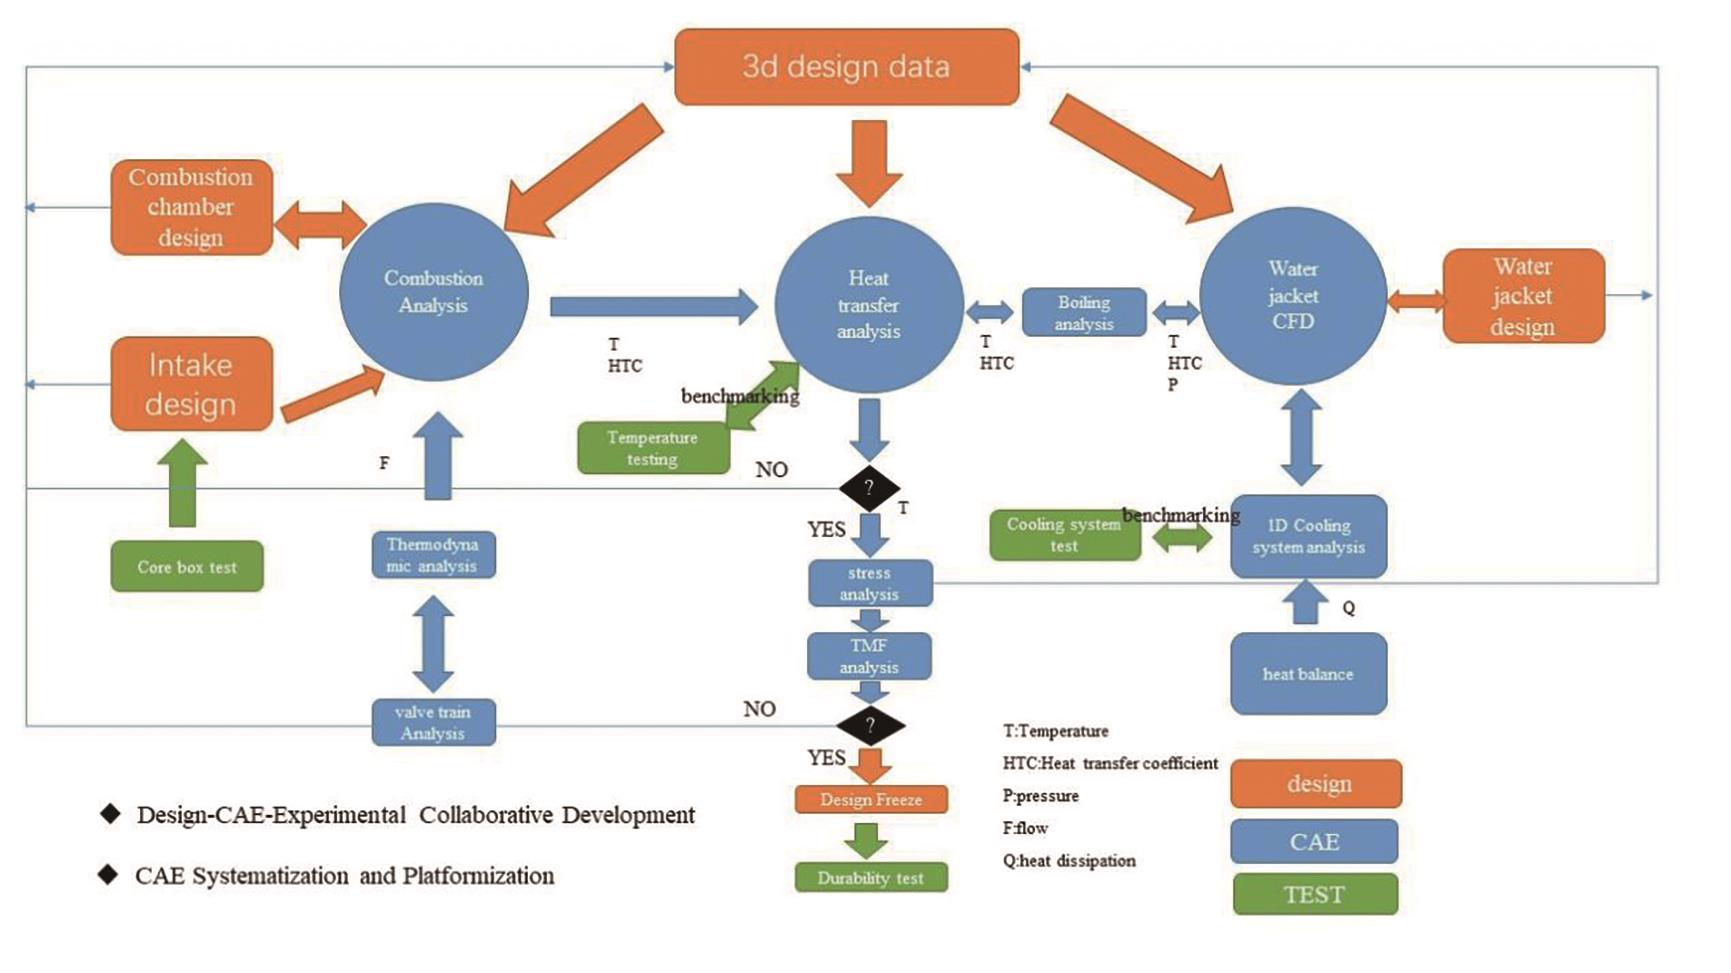
Figure 1. Collaborative development of Computer Aided Engineering (CAE), design, and experiment.
2.2. An Independent Developed Procedure for Calculating Powertrain Thermal Balance
Developed powertrain thermal balance calculation procedure can calculate thermal balance and energy distribution positively. At present, the industry commonly relies on estimations derived from effective power, and the result of engines heat dissipation is not accurate [3]. Using the principle of energy conservation, a heat balance calculation procedure has been developed. The total energy inflow, comprising the fuel calorie and air enthalpy, is equal to the total energy outflow from the system, encompassing the effective energy, exhaust calorie, dissipation of heat through the water jacket, intercooler, oil cooler, and EGR, as well as engine component heat radiation. The distribution of fuel energy among the engine's effective energy, heat dissipation, and exhaust waste heat is illustrated in Figure 2.
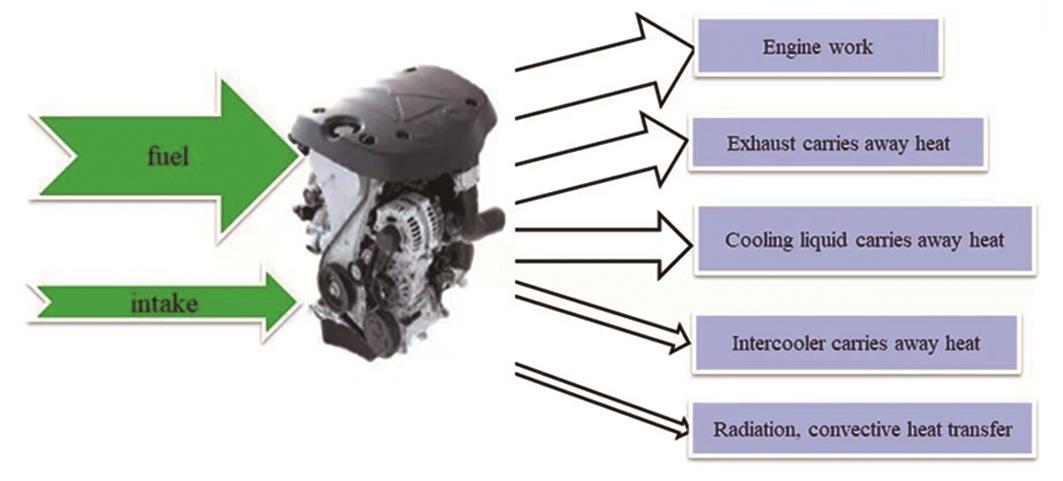
Figure 2. Schematic diagram of engine heat balance.
The cooling of the powertrain at low temperatures is necessary to maintain its reliability. However, achieving high thermal efficiency necessitates reducing heat losses through high-temperature cooling, creating a mutual constraint between the two objectives. The development must address the intricate challenge of achieving precise control over cooling losses in the powertrain. By leveraging the Vibe heat release equation, the Woschni heat transfer equation within the cylinder, and the intake and exhaust enthalpy of excess air coefficient fuel energy balance equation, we have successfully formulated a powertrain energy flow mathematical model. This model has been constructed through the utilization of empirical test data. A complete powertrain energy flow calculation software was independently developed in Python, covering fuel combustion, heat transfer, exhaust, and radiator. The software has solved the complex calculation problem of heat flow distribution in cylinder blocks and cylinder heads in different scenarios. Furthermore, it has enabled prompt forward analysis of water flow and the harmonious alignment of heat load under different conditions. The software has calculated energy distribution such as work, cooling, and exhaust, and provided guidance for reducing cooling losses. In comparison to its commercial counterparts, this software exhibits a negligible accuracy error of merely 5%, while remarkably enhancing efficiency by an astounding 80%, as shown in Figure 3.
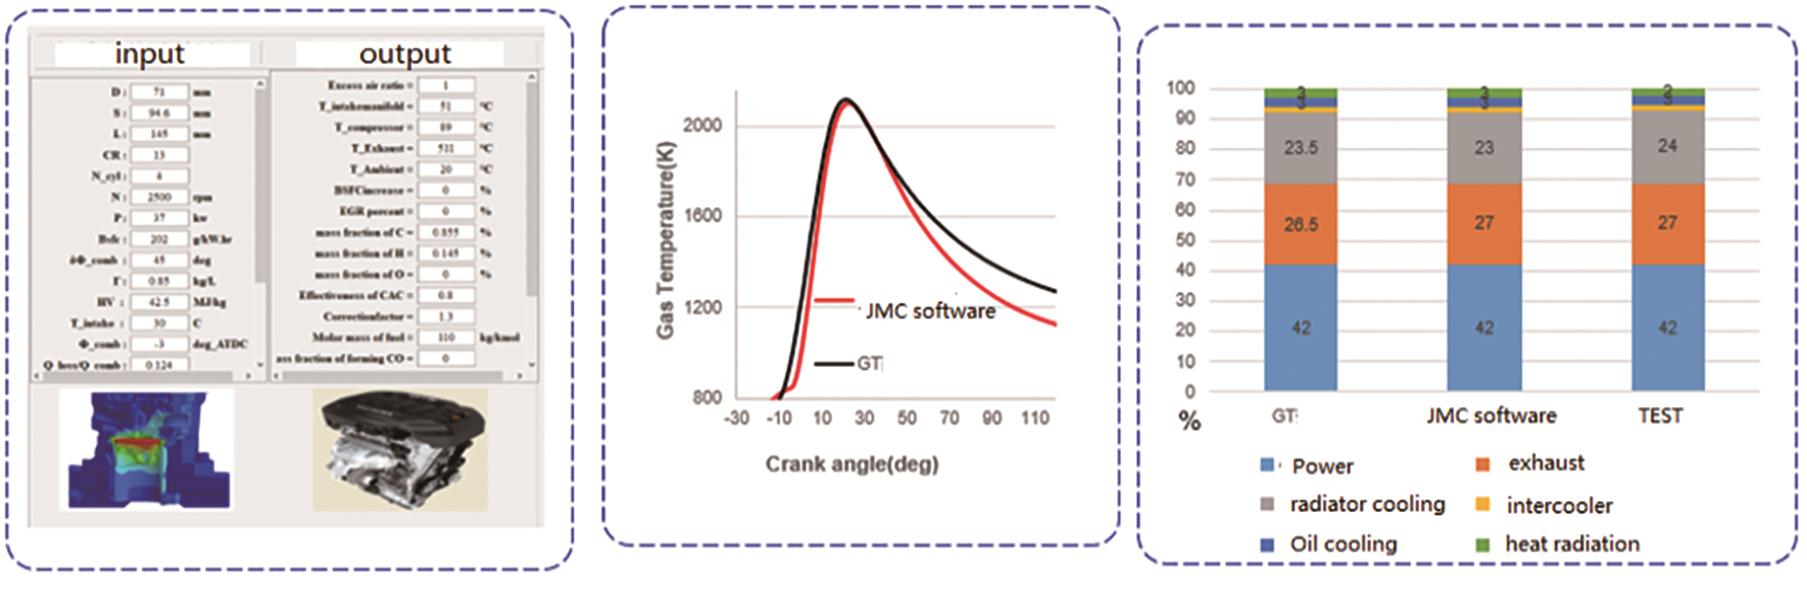
Figure 3. Powertrain energy flow calculation Software.
2.3. Water Jacket Design Methods and Standards
This article has laid the foundation for a comprehensive set of evaluation criteria, encompassing parameters such as the intricate velocity distribution within the water jacket, the convective heat transfer coefficient of crucial components (including the upper segment of the cylinder barrel, the inclined water hole between cylinders, and the nose beam area of the cylinder head), as well as the uniformity of cylinder cooling across various water jackets. A water jackets design standard has been established based on the flow parameters of the water jacket flow field. To ensure the uniform cooling of each cylinder, the difference in coolant flow rate through the gasket holes of each cylinder should be less than 10%. The optimal velocity of coolant flow should fall within the range of 1–3 m/s, while adhering to a local threshold of no more than 5 m/s. Additionally, it is important to ensure the absence of any instances of backflow or stagnant water within all components. It is imperative that the convective heat transfer coefficient (HTC) meets the prescribed criteria at critical locations. Specifically, the upper part of the cylinder hole must exceed 6,000 W/m2K, the inclined water hole and exhaust nose beam area of the cylinder head must exceed 10,000 W/m2K, and the exhaust nose beam area of the cylinder must exceed 14,000 W/m2K.
2.4. A Method for Analyzing the Temperature Field of Cylinder and Cylinder Head with Bidirectional Fluid-Solid Coupling
The combustion heat transfer boundary is very complex, and the heat release coefficient is influenced by many factors. In the past, engineers calculate the average heat release coefficient and medium temperature through empirical formulas or employing a singular coupling method involving fluid-solid or solid-fluid interactions. However, it must be acknowledged that the true boundary is subject to mutual influences. The bidirectional fluid-solid coupling analysis method facilitates a seamless integration between the analysis of temperature fields in both fluid and solid domains. This novel approach not only establishes mutual boundaries but also serves to enhance the accuracy of results. This method takes into account the impact and assessment of water jacket film boiling. Specifically, when the wall temperature of the water jacket exceeds the film boiling temperature, the heat transfer coefficient of the water jacket will decrease sharply. Therefore, it is necessary to control the water jacket temperature to be at least 20 °C lower than the film boiling temperature.
2.5. Fatigue Life Prediction of Thermal Engine
The cylinder head TMF analysis results of thermal engine fatigue life prediction based on the fatigue-oxidation-creep multiple damage include fatigue damage and fatigue life [4]. The fatigue damage is composed of three parts: oxidation damage, mechanical damage, and creep damage, as shown in Figure 4. Insights into the primary drivers of thermal engine fatigue can be derived from the obtained results, while the distribution of thermal engine fatigue life allows us to pinpoint the most vulnerable region in the structural framework of the engine. This invaluable information offers theoretical guidance to inform the design process.

Figure 4 (a) Mechanical damage; (b) Oxidative damage; (c) Creep damage.
3. Reliability Simulation and Test Calibration for Key Engine Components
3.1. Calibrating the Strength Coefficient for the Fillet of the Crankshaft
Considering the inherent challenges in precisely quantifying the level of reinforcement in the fillet of the crankshaft, we conducted a comprehensive study involving simulation and test-based calibration of the strength coefficient associated with the crankshaft fillet. This paper successfully established a calibration method for the strength coefficient of the crankshaft fillet, encompassing a diverse range of 20 distinct crankshaft structures, 6 different materials, and 2 distinct manufacturing processes. It could quickly support the selection of crankshaft materials, structures and processes and reduce the special fatigue test by 50%. The proposed methodology for calibrating the crankshaft fillet strength coefficient is as follows: Firstly, the fatigue strength of the crankshaft material is ascertained through a specialized crank fatigue test. Subsequently, utilizing the finite element method, the material parameters and the strength coefficient associated with the fillet surface of the crankshaft are precisely calibrated. The steps are as follows:
- (1) A fatigue strength evaluation of the crankshaft crank component was performed, wherein the crankshaft crank underwent a comprehensive fatigue limit examination utilizing the lifting method. Consequently, the median fatigue limit bending moment of the crank (at a 50% survival rate) was determined. The crankshaft bending fatigue test was carried out according to QC/T 637-2000 "Automobile Engine bending Fatigue Test Method". The test cycle base was 1 × 10⁷ cycles, and the test load waveform was sine wave.
- (2) Convert the fatigue limit moment at 99.99% survival rate. During the calibration of the enhancement factor, we relied on a survival rate of 99.99%. It is necessary to compute the crankshaft load moment M -1 (99.99%) based on the findings from the fatigue strength test of the crank (where the survival rate was 50% for the crankshaft load bending moment M -1 (50%)). The formula is as follows:
- M-1 (99.99%) = M-1 (50%) - a × K × Sn-1
- Sn-1: The standard deviation of M-1 (50%)
- a: The one-sided normal distribution of quantile values with probability of 99.99%
- K: The correction coefficient related to the pairs number of valid data.
- (3) According to the test, the crank and the load (fatigue limit moment), the CAE model was carried out to calculate the stress distribution of the crank under the fatigue limit moment of 99.99%.
- (4) Analyze the fatigue strength of the crank and calibrate the strength coefficient of the rounded surface.
We established a finite element model that was equivalent to the fatigue test conducted on the crankshaft. Based on the analysis result, the surface strength coefficient of the crankshaft was calibrated by using FEMFAT. The stress result was imported into FEMFAT, selected BASIC module, and the working conditions were upper and lower. The process of determining the strength coefficient is as follows: Firstly, a strength coefficient is assumed (the empirical range is 1.6–2.8). If the minimum fatigue safety coefficient can be 1, the surface strength coefficient of the crankshaft is this number. However, should this not be the case, it is necessary to iteratively refine the assumption until the minimum fatigue safety factor attains a value of 1.
3.2. The Line-Bore Simulation Applied to the High-Cycle Fatigue Test of Connecting Rod
Given the challenges inherent in integrating fatigue analysis with the precision process for connecting rod big bore, a comprehensive investigation was undertaken to explore the simulation and test of tensile and pressure fatigue in connecting rods. As a result, a novel approach was developed, encompassing Line-Bore simulation for connecting rods and an extensive analysis of high-cycle fatigue. It realized the accurate simulation of the connecting rod big bore precision process and improved the accuracy of the tensile and pressure fatigue analysis, as shown in Figure 5.
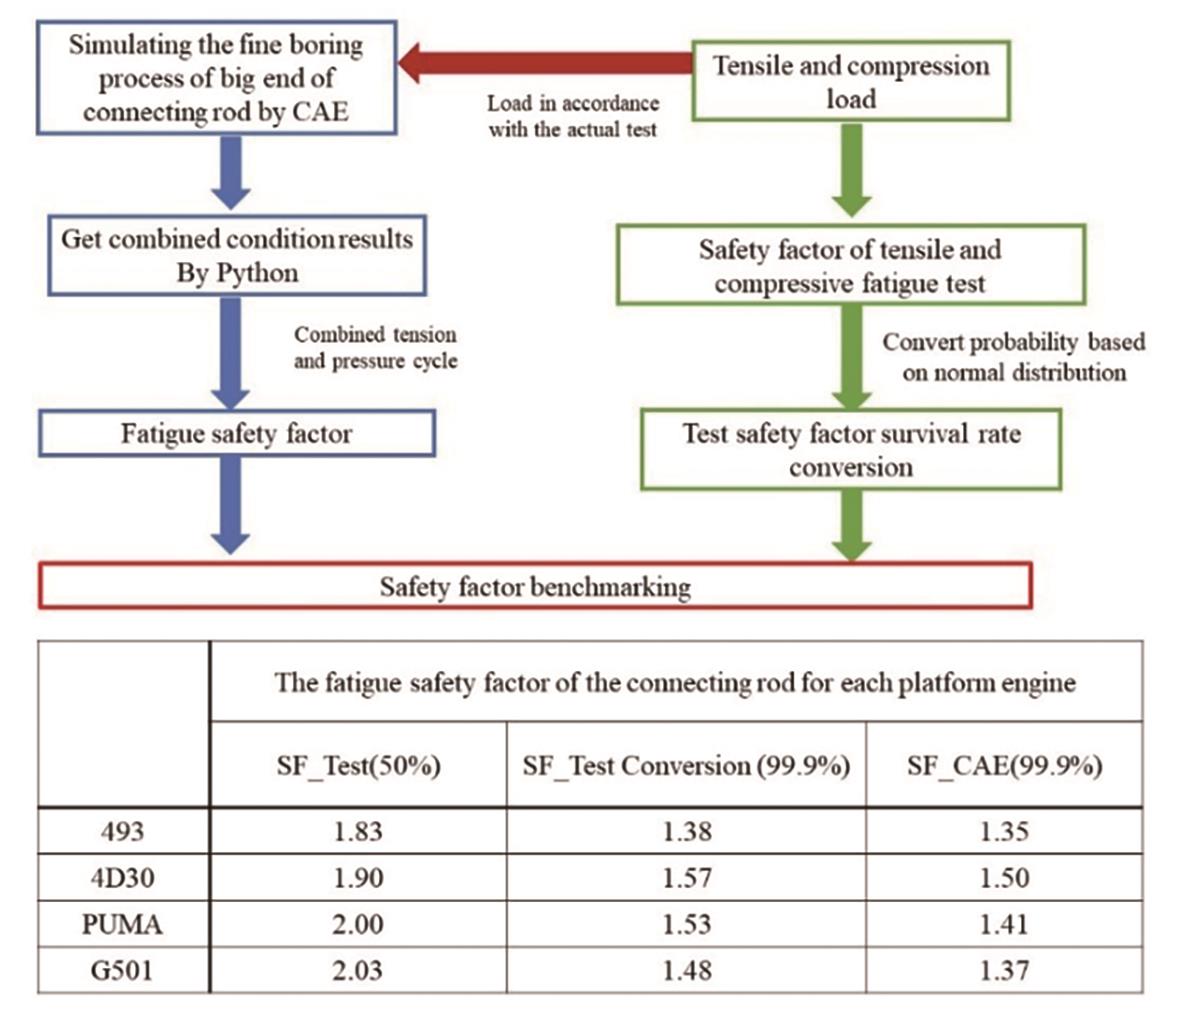
Figure 5. Connecting rod fatigue analysis calibration.
3.3. Analysis and Calibration of Main Wall of Cylinder High-cycle Fatigue Strength
As the installation support of the crankshaft, the main bearing wall of the cylinder bears the dynamic EHD (elastic hydrodynamic dynamics) load transmitted from the engine operating system (piston-connecting rod-crankshaft) through the spindle tile, the assembly force of the spindle tile interference and the main cover bolt, and the thermal stress generated by the temperature field of the cylinder block. The EHD load undergoes variation as the crankshaft rotates and exerts a circular force on the main bearing tile. Consequently, the main bearing wall is susceptible to fatigue failure when subjected to alternating stresses.
By employing an engine dynamics model, the precise limit boundary of the force acting on the main bearing wall of the cylinder is determined. The calculation of the EHD load primarily focuses on the following aspects: 1) external full load, extracting force of main bearing wall under 0–720° crankshaft at low torque point for strength analysis of main bearing wall; 2) Extracting force of main bearing wall under 0–720° crankshaft at rated point under full load condition. The low speed torque point and the rated point in the cylinder burst pressure reached the maximum, which is close to the calibrated burst pressure limit.
A thorough analysis of the high-cycle fatigue strength was conducted on the primary wall of the cylinder, wherein the feeble region within the pre-cylinder body was precisely gauged, exhibiting complete alignment with the specialized fatigue test. Figure 6 shows the test and simulation results of a gray cast iron cylinder.
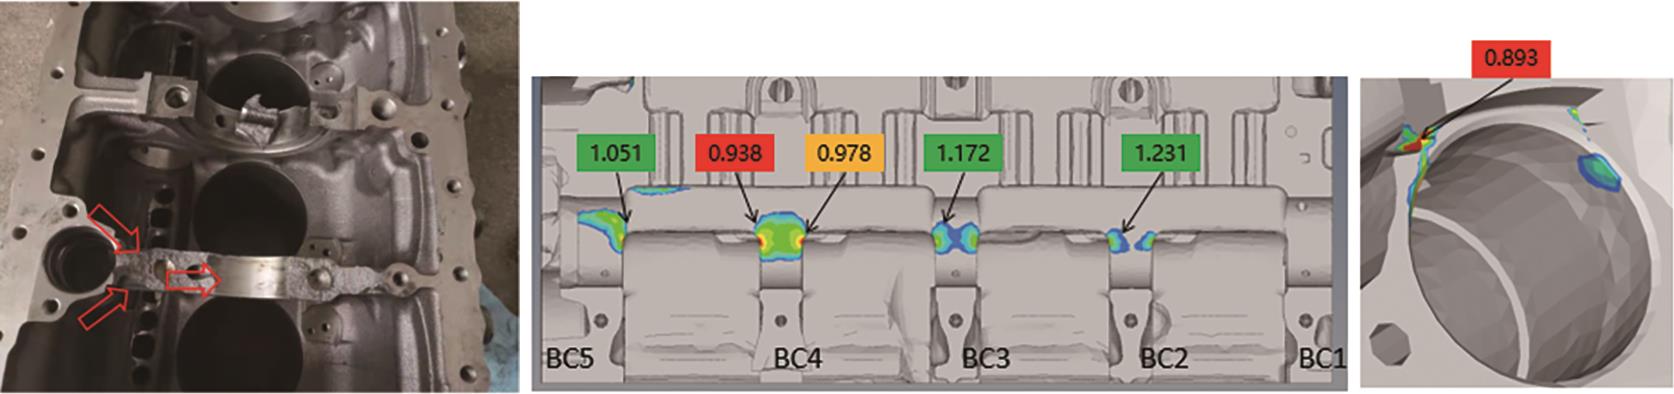
Figure 6. Test and simulation results of a gray cast iron cylinder.
4. B10(The definition of B10 lifespan is the working time point of a product. After this point in time, it is expected that 10% of the products will malfunction) Life Prediction Technology Based on Customer Scenarios
4.1. Establish Failure Mode & Mechanism and Reliability Test Correlation Matrix
To address the concern regarding the limited concordance between conventional power system reliability assessments and customer usage scenarios, we have successfully identified potential failure modes and mechanisms within customer scenarios. This accomplishment enabled us to construct a comprehensive matrix (Figure 7) which correlates failure modes, mechanisms, and reliability tests. Through this approach, we have significantly enhanced the testing coverage for power system failure mode verification, surpassing a remarkable 95% improvement.
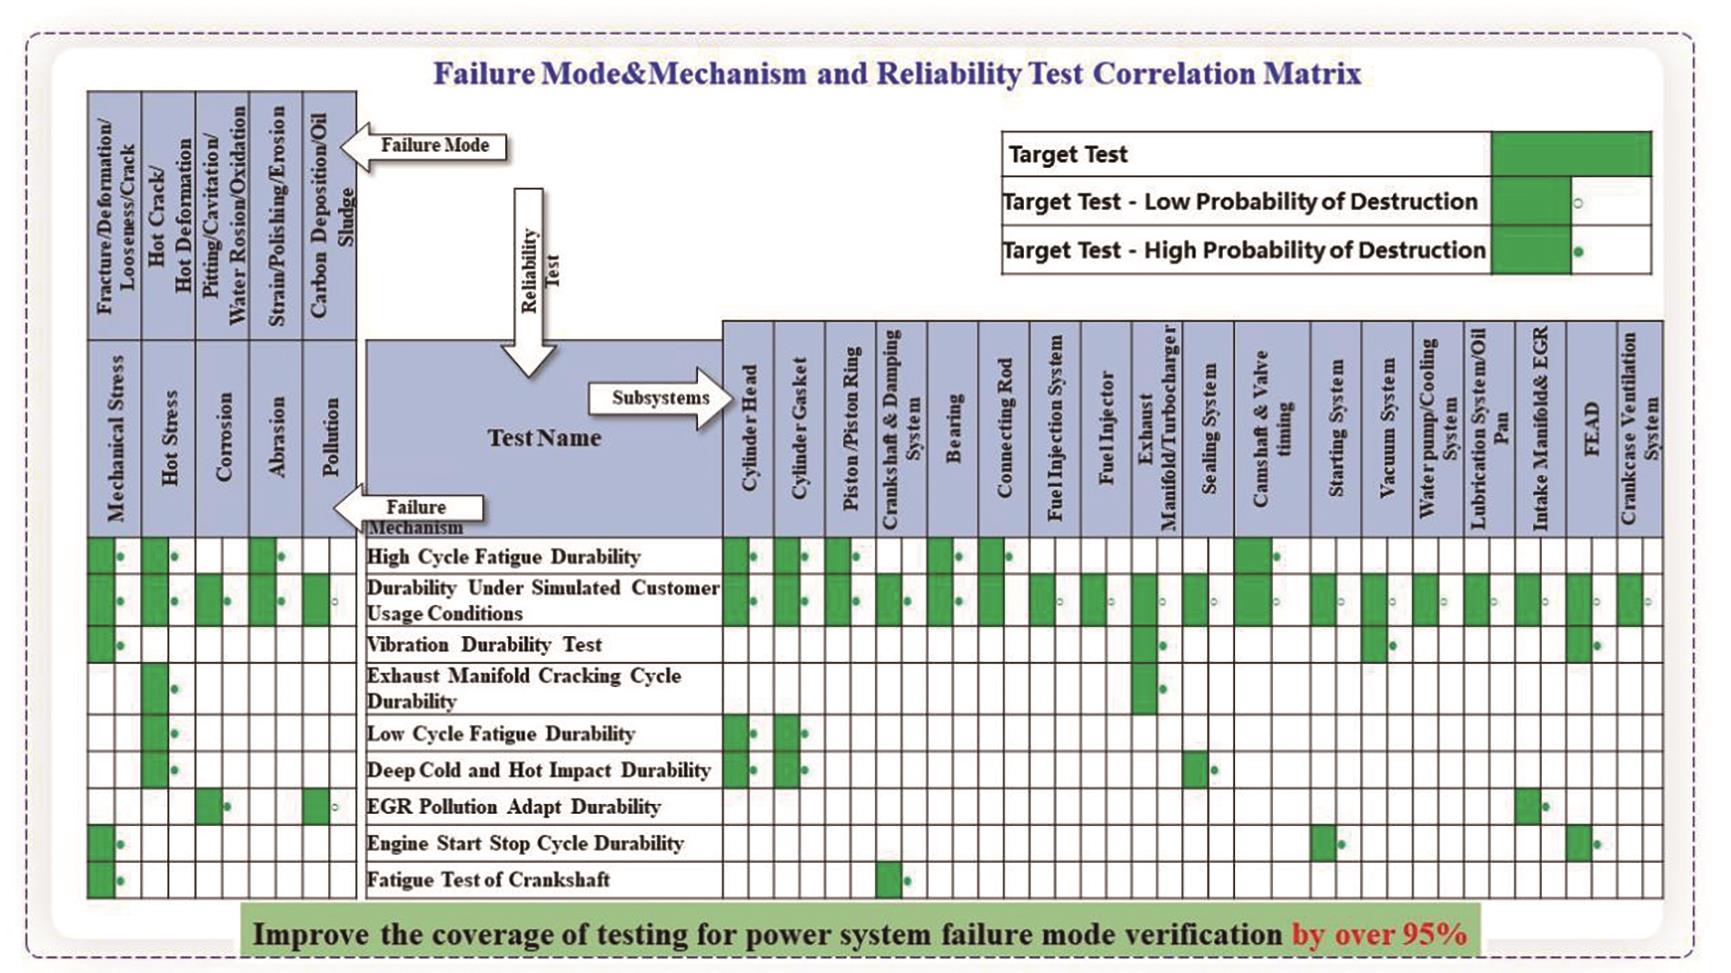
Figure 7. Failure mode & mechanism and reliability test correlation matrix.
Aimed at the issue of low correlation between traditional power system reliability test and customer usage scenarios, combining the failure fault of existing power system products during use, the performance parameters, structural characteristics, and material technology of the power system, developed failure mode and mechanism analysis. This paper established a database covering 6 major subsystems and over 200 sub component failure modes and mechanisms, extract and summarize 15 types of failure modes and 5 failure mechanisms. We constructed a comprehensive matrix which correlates failure modes, mechanisms, and reliability tests. This matrix can be used to determine the test items required for reliability verification of each component efficiently and quickly. Consequently, we have achieved a remarkable enhancement in the scope of testing for power system failure mode verification, surpassing an unprecedented 95% threshold.
4.2. Create B10 Life Prediction Method
To solve the issue of the power systems validation in reliability test, we created an equivalent conversion between bench test time and vehicle mileage, established reliability rating standards and atlases of power systems, achieved accurate assessment of B10 lifespan with a confidence level of 95%.
As an important reliability of index automotive power systems, B10 life usually measure the vehicle mileage. To achieve the goal of B10 life, it is imperative to establish an equivalent conversion between bench test time and vehicle mileage. Additionally, the development of an algorithm to estimate the required sample size for testing purposes is of utmost significance. This algorithm combines vehicle motion characteristics, damage acceleration, and reliability prediction models for solving with high accuracy. We established reliability rating standards and atlases of power systems that used to guide the grading of parts after test. Utilizing the data obtained from experimental equivalent mileage and rating results, we successfully employed the Weibull distribution to accurately evaluate the B10 lifespan. This evaluation was achieved with a remarkable confidence level of 95%, as demonstrated in Figure 8. Consequently, we solved the validation problem of the power system in reliability experiment.
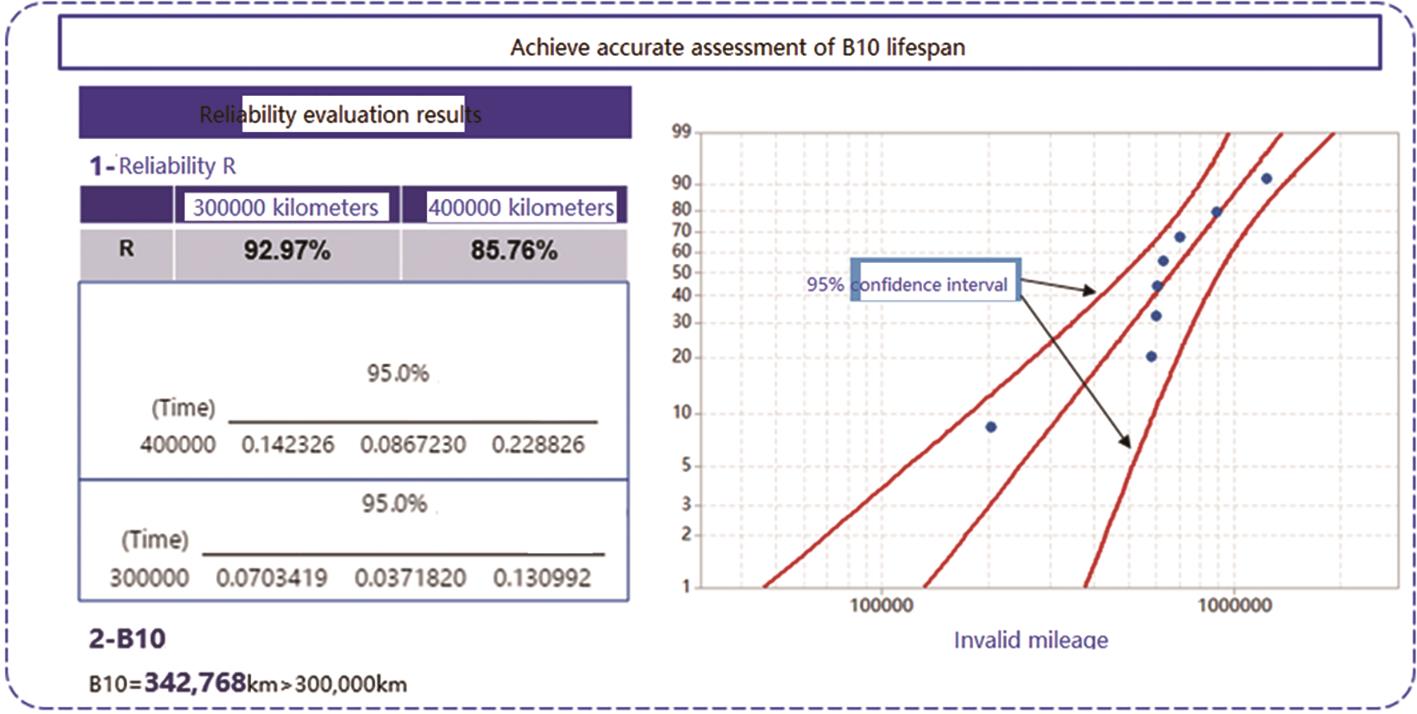
Figure 8. B10 life prediction.
5. Simulation of Electric Drive Axle Assembly Structural
5.1. Simulation of The Electric Drive Axle Shell Assembly Stiffness
5.1.1. Establish Model
- (1) Assuming that the material of the bridge shell is uniform and isotropic;
- (2) Assuming that the material properties of each welded part in the bridge shell has no change;
- (3) Neglecting small features such as inlet and outlet ports, sealing gaskets, and bolt holes;
- (4) Neglecting small accessory components and features on the bridge shell that do not affect the structure;
- (5) Simplifying the fillet and chamfer characteristics in the bridge shell into right angle features;
- (6) The size of the solid mesh is generally chosen as 5 mm, and it is recommended to use a second-order mesh for tetrahedrons;
- (7) The bolt positions are connected using a rigid rbe2 element, and all welds are simulated using a shell element model, which is connected to the base material at a common node;
Once the bridge shell assembly model is finalized, its constraint boundary can be elegantly simplified as that of a simply supported beam. In this configuration, one end imposes three displacement degrees of freedom on the wheel center, while the opposing end liberates the wheel center's half-axis direction and instead constrains two other displacement degrees of freedom. Furthermore, the center of the leaf spring seat restricts the half-axis rotation of the axle shell. We subjected the center of the leaf spring to a doubled rear axle load, thereby initiating an analysis to determine the maximum deformation of the drive axle shell assembly.
5.1.2. Results and Evaluation Standard
Stiffness evaluation standard: In the presence of a doubled rear axle load, the maximum vertical deformation per meter of track width shall not exceed 1.5 mm.
As shown in Figure 9, it is the maximum deformation of the vehicle's axle shell under double axle load. The maximum deformation of the bridge shell is recorded at 1.4 mm, while the specified wheelbase of 1.5 m aligns with the designed dimensions. Notably, the maximum vertical deformation per meter of wheelbase is measured to be a commendably low 0.933 mm, which falls below the desired threshold of 1.5 mm. Consequently, the stiffness of the axle shell assembly is successfully meeting the prescribed requirements.
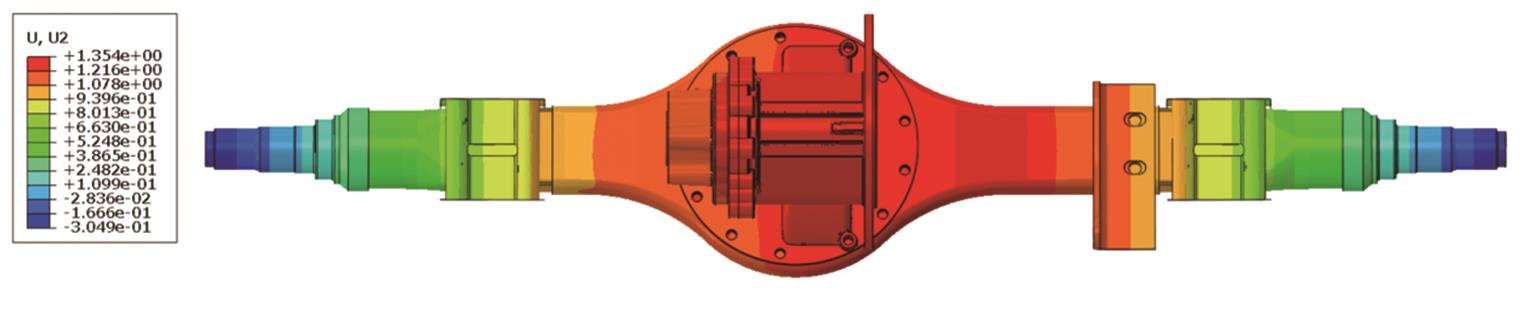
Figure 9. Deformation of the axle shell assembly under double axle load.
5.2. Strength Simulation of The Electric Drive Axle Shell Assembly
5.2.1. Establish Model
- (1) Assuming that the material of the bridge shell is uniform and isotropic;
- (2) Assuming that the material properties of each welded part in the bridge shell has no change;
- (3) Neglecting small features such as inlet and outlet ports, sealing gaskets, and bolt holes;
- (4) Neglecting small accessory components and features on the bridge shell that do not affect the structure;
- (5) Simplifying the fillet and chamfer characteristics in the bridge shell into right angle features;
- (6) The size of the solid mesh is generally chosen as 2 mm, and it is recommended to use a second-order mesh for tetrahedrons, at least four layers of grid in the thickness direction, and at least three layers of grid in the rounded area;
- (7) The bolt positions are connected using a rigid rbe2 element, and all welds are simulated using a shell element model, which is connected to the base material at a common node;
Simplifying the constrained boundary into a simply supported beam structure, constrain the wheel center of the axle shell assembly and leaf spring center. Apply three parts of load to the strength load boundary of the axle shell assembly, 1) 2.5 times rear axle load. 2) Double the maximum input torque, establishing a dynamic simulation model, extract the bearing forces corresponding to twice the maximum input torque. 3) Maximum motor acceleration.
5.2.2. Results and Evaluation Standard
Generally, the maximum equivalent stress of each component should be less than the material yield strength. Taking the reducer shell as an example, except for the bolt holes, the stress of the main reducer shell is less than the yield limit of material QT450 of 310MPa, meeting the strength requirements, as shown in Figure 10.
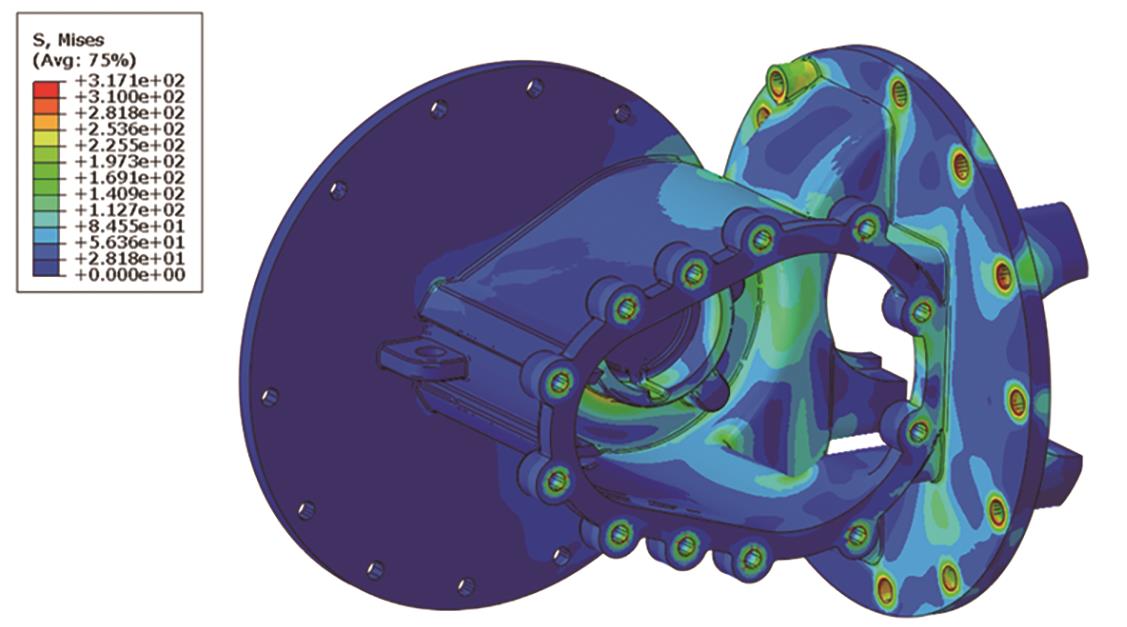
Figure 10. Stress cloud diagram of reducer shell.
5.3. Modal Simulation of Electric Drive Bridge System
5.3.1. Establish Model
Noise, Vibration, and Harshness (NVH) represent pivotal concerns for both domestic and international automotive manufacturers and component enterprises. It is a research direction for designing vehicle noise and vibration control and ride comfort, directly affecting the texture of a car. By adeptly circumventing modes of each order during the nascent stages of design, one can effectively mitigate the deleterious effects of NVH. The electric drive rear axle system assumes a pivotal role as a dynamic constituent and a vital conduit for transmitting road excitation, thereby underscoring the paramount significance of evading modal frequencies specific to this entity.
- (1) Assuming that the material of the bridge shell is uniform and isotropic;
- (2) Assuming that the material properties of each welded part in the bridge shell has no change;
- (3) Neglecting small features such as inlet and outlet ports, sealing gaskets, and bolt holes;
- (4) Neglecting small accessory components and features on the bridge shell that do not affect the structure;
- (5) Simplifying the fillet and chamfer characteristics in the bridge shell into right angle features;
- (6) The size of the solid mesh is generally chosen as 2 mm, and it is recommended to use a second-order mesh for tetrahedrons, at least four layers of grid in the thickness direction, and at least three layers of grid in the rounded area;
- (7) The bolt positions are connected using a rigid rbe2 element, and all welds are simulated using a shell element model, which is connected to the base material at a common node;
- (8) Requires tire static pressure stiffness and rolling radius;
- (9) The model sets the dynamic stiffness parameters of the front and rear ends of the leaf spring, the upper and lower ends of the shock absorber rubber bushings;
- (10) The quality of the simulation model is equivalent to that of the actual drive axle assembly;
The tire grounding point, plate spring, and shock absorber body end constrain all degrees of freedom, necessitating a comprehensive analysis of the model's constraint modes.
5.3.2. Results and Evaluation Standard
A comprehensive analytical model is established for the rear suspension system of the electric drive axle, yielding five distinct modes: Hop, Tramp, Fore aft IP, Fore aft OP, and Pitch. In order to fulfill the NVH requirements, it is imperative to mitigate the Pitch mode along with the remaining fourth-order suspension mode, ensuring that their frequencies exceed a minimum threshold of 3 Hz.
Using a twin-tire light truck model as our illustrative example, we observe the following natural frequencies: Hop mode at 9.782 Hz, Tramp mode at 14.09 Hz, Fore aft OP mode at 31.23 Hz, and Fore aft IP mode at 33.82 Hz. Notably, the Pitch mode registers at 43.57 Hz, thus satisfying the prescribed frequency avoidance criterion of 3 Hz, as shown in Figure 11 to Figure 12.
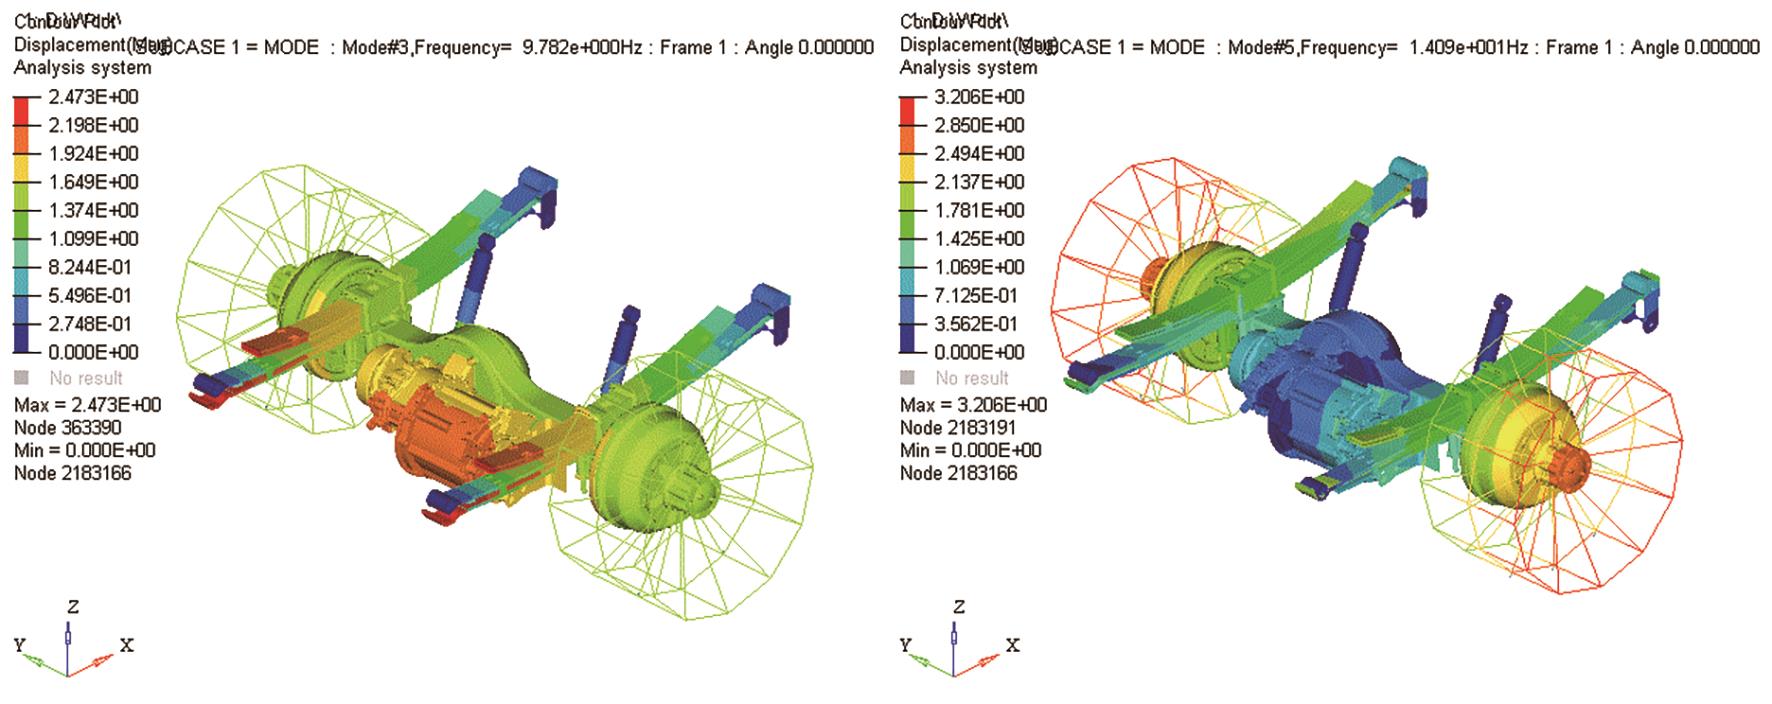
Figure 11. Hop and Tramp vibration modes.

Figure 12. Fore aft IP and Fore aft OP vibration modes.
6. Conclusion
In order to cultivate a culture of autonomous exploration and attain mastery over crucial technological competencies, our firm ardently directs its resources towards independent simulation, design, and collaborative development initiatives pertaining to powertrain experiments. As a result, we have achieved significant breakthroughs in the realm of reliability assessment for pivotal components. Based on this, we have successfully established an all-encompassing framework for appraising the dependability of varied power systems. With this innovative system in place, we possess the expertise to facilitate cutting-edge powertrain advancements and refine the design of crucial subsystems and components, thus enabling unparalleled optimization.
The following is an example of applying the power system developed in this article to enterprise vehicle products:
- (1) The developed Tengbao turbocharged diesel powertrain is applied to light trucks and Baodian pick-up trucks;
- (2) Developed G501 direct injection turbocharged gasoline engine applied to SUV;
- (3) The developed Duratorq turbocharged diesel engine is applied to Yuhu pick-up trucks and light passenger cars;
- (4) The modified JX493 turbocharged diesel engine is applied to Teshun light passenger car and light truck;
- (5) The developed E820 electric drive bridge is applied to pure electric light trucks.
At the same time, the project achievements were successfully promoted and applied, obtained practical applications in cooperative enterprises such as Shanxi Yunnei Power Corporation, Jiangxi Isuzu Engine Corporation, and Guangdong Zhaoqing Power Metal Corporation. By extending our support to the aforementioned endeavors, we have played an instrumental role in fostering autonomous design and development of reliable systems. This concerted effort has not only propelled technological advancements within the industry but has also yielded substantial societal benefits, underscoring our significant impact on the broader landscape.
Author Contributions: Conceptualization, X.Z. and X.S.; methodology, G.W.; software, Y.L.; validation, D.L., Y.F. and Z.L.; formal analysis, X.Z.; investigation, X.Z.; resources, J.L.; data curation, X.Z.; writing—original draft preparation, X.Z.; writing—review and editing, G.W.; visualization, L.Z.; supervision, T.W.; project administration, J.L. All authors have read and agreed to the published version of the manuscript.
Funding: This research received no external funding
Data Availability Statement: Not applicable.
Conflicts of Interest: The authors declare no conflict of interest
References
- Miao, R.; Zeng, X.; Cao, L.; et al. Experimental Study on the Mechanism of Super Detonation and Detonation Suppression in Supercharged Direct Injection Gasoline Engines. Vehicle Engine 2021, (6), 1-8. (in Chinese) DOI: 10.3969/j.issn.1001-2222.2021.06.001.
- Zeng, X.; Luo, X.; Wei, T.; et al. Development and Application of an Engine Analysis Platform Based on Thermal Balance and Structural Strength. Computer Aided Engineering 2017, 26(05), 29–35,40. (in Chinese) DOI: 10.13340/j.cae.2017.05.006.
- Zeng, X.; Luo, X.; Wei, T.; et al. Innovative research and its applications based on engine thermal equilibrium and structural strength. SAE Technical Paper 2019, No. 2019-01-0770. DOI: https://doi.org/10.4271/2019-01-0770
- Zou, P.; Jing, G.; Zeng, X.; et al. Prediction of Engine Cylinder Head Thermal Engine Fatigue Life Based on Sehitoglu Model. Mechanical Strength 2021, 44(5), 1184–1190. (in Chinese) DOI: 10.16579/j.issn.1001.9669.2021.05.023.