Downloads
Download


This work is licensed under a Creative Commons Attribution 4.0 International License.
Article
A Visual Study on of HCB/Gasoline Dual-Fuel Combustion Strategy and Premix Ratio in a Diesel Engine
Qian Wang *, Botian Guo, Lixuan Cao, Xu Liu, Yi Jiang, and Jiawei Yao
School of Energy and Power Engineering, Jiangsu University, Zhenjiang 212013, China
* Correspondence: qwang@ujs.edu.cn
Received: 8 November 2023
Accepted: 22 January 2024
Published: 30 January 2024
Abstract: This study investigates the combustion characteristics of hydrogen catalysed biodiesel (HCB) ignited gasoline in an optical engine using the Reactivity Controlled Compression Ignition (RCCI) combustion model. The experiment uses a single injection strategy to determine the optimum injection timing for gasoline ignition by varying the HCB injection timing (-30 to -15° CAATDC) and the ratio of high to low reactivity fuel energy (10% to 30%), to investigate the gasoline premix ratio, and to analyse the flame development characteristics. The results indicate that as the HCB energy ratio increases, the in-cylinder pressure and heat release rate increase significantly, and the in-cylinder combustion temperature improves significantly. As the injection timing is delayed, the combustion phase shifts back, and when the injection timing is close to the upper stop, the in-cylinder combustion pressure and heat release rate increase first increase and then decrease. Based on the results, it can be concluded that optimising the HCB injection timing and energy ratio can effectively control the distribution of the fuel-air mixture in the combustion chamber, thereby improving combustion efficiency and emission performance. By strategically adjusting the injection timing, an ideal balance between fuel stratification and flame propagation can be achieved, which ultimately improves the overall combustion process. The results of this study provide valuable insights for the further development of combustion control strategies and contribute to the development of more efficient and environmentally friendly engine technologies.
Keywords:
reactivity controlled compression ignition (RCCI) optical engine hydrogen catalysed biodiesel (HCB) premix ratio injection timing visualization research1. Introduction
As global car ownership continues to grow, the energy crisis and environmental pollution problems are worsening making energy saving and emission reduction measures in the combustion engine industry a global priority [1]. In this context, the development of new combustion modes is not only a key strategy for addressing the energy crisis, but also an important means of reducing engine pollutant emissions. At the same time, it is essential to study the in-cylinder combustion process of internal combustion engines. This research includes optimising injection strategies, exploring alternative fuel combinations, and assessing the impact of various operating parameters on combustion performance. Understanding the complex interactions between fuel, air, and combustion processes can lead to improved engine efficiency, reduced emissions, and improved overall performance. In addition, studying the combustion characteristics of different fuel blends and alternative fuels can provide valuable insights into their suitability for use in internal combustion engines, thereby promoting sustainable and environmentally friendly transport [2‒4].
Low temperature combustion (LTC) has received considerable attention in the research of novel combustion modes. LTC [5] refers to the combustion process that occurs at lower temperatures and with lower peak flame temperatures compared to conventional combustion modes. It offers several advantages, including reduced nitrogen oxide (NOx) and particulate matter (PM) emissions, improved fuel efficiency, and enhanced combustion stability. The investigation of LTC includes the study of various techniques such as homogeneous charge compression ignition (HCCI), premixed charge compression ignition (PCCI), has been proposed as a way to achieve better emissions compared to conventional diesel combustion modes. HCCI has higher thermal efficiency, lower heat loss [6], and shorter combustion duration, while PCCI uses an early or late injection strategy to improve fuel mixing prior ignition and to overcome problems such as high HCCI heat release rate and pressure rise rate. However, both HCCI and PCCI have limitations in controlling ignition timing [7] and adapting to different loads, which may hinder their practical application.
To overcome the challenges associated with the combustion concepts mentioned above, Reitz et al. [8] pioneered the concept of Reactivity Controlled Compression Ignition (RCCI) dual-fuel combustion in 2010 at the University of Wisconsin-Madison. They successfully enhanced combustion phase control through this approach. Reactive Controlled Compression Ignition (RCCI) is a dual-fuel premixed combustion mode that can operate at full speed and full load, offering advantages not available from other combustion modes. It can provide high combustion efficiency while reducing fuel consumption. By adjusting the ratio of compression ignition fuel to homogeneous charge fuel, combustion efficiency improved and fuel consumption can be reduced. In addition, RCCI combustion can significantly reduce emissions of nitrogen oxides (NOx) and particulate matter (PM). By thoroughly mixing the fuels and controlling the combustion process, the formation of harmful gases can be effectively minimised. RCCI achieves high thermal efficiency, low emissions, and controllable combustion phase separation over a wide load range by injecting low reactivity fuel into the intake port and high reactivity fuel into the cylinder, creating fuel concentration gradients and reactivity gradients within the cylinder [9‒11]. The RCCI combustion mode offers greater flexibility in controlling the combustion phase, resulting in fewer knock [12,13]. Compared to conventional combustion modes, RCCI has lower particulate emissions in terms of concentration, but higher mass concentrations. Ren et al. [14] conducted research on a heavy-duty RCCI engine to investigate the effect of compression ratio on combustion and emissions. The study found that reducing the compression ratio of the RCCI engine resulted in a decrease in the maximum cylinder temperature and pressure, making it easier to expand to high loads, solving rough combustion problems, and resulting in lower NOX and soot emissions. Zhu et al. [15,16] investigated the effect of injection strategy on diesel-induced gasoline RCCI spray combustion and found that changing the injection timing within the range of 30° to 40° before the top dead center (TDC) caused a delay in combustion and an increase in the stall period. Rahnama et al. [17] found that the large reactivity gradient between the two fuels allowed a lower rate of pressure rise and peak pressure values at high loads.
While new combustion technologies are being explored, the use of cleaner fuels is also an effective way to reduce emissions. Research shows that highly reactive fuels are crucial for controlling combustion [17]. The molecular structure, cetane number, and oxygen content of oxygenated fuels play an important role in the engine combustion process [17]. Hydrocatalytic biodiesel [18] (HCB) is a renewable energy source produced primarily from waste animal and vegetable fats and oils through catalytic hydroprocessing. HCB is a promising renewable energy source with a degradation rate four times faster than diesel [19]. Due to its high cetane number, HCB has a high reactivity that can significantly improve engine ignition and emission characteristics [20,21].
Xuan et al. [22] conducted a study in a constant volume combustion bomb, to investigate the spray combustion characteristics of methanol/n-octanol/hydrogenated catalytic biodiesel (HCB) blends with different methanol blend ratios. They compared and analysed the spray combustion characteristics at different ambient temperatures and injection pressures. The study found that the addition of HCB resulted in a reduction in flame lift-off length, and its combustion resulted in the most pronounced liquid phase evaporation. Zhong et al. [23] found that an increase in HCB content resulted in earlier combustion, with the appearance of initial soot occurring at an earlier time. In addition, the ignition delay period time was reduced as the fuel injection pressure increased. These studies demonstrate the significant advantages of HCB in improving low-load combustion in internal combustion engines. Therefore, further fundamental research on the in-cylinder combustion process of HCB under low-load operating conditions is required. Given the high reactivity of HCB, it can address the challenges of ignition difficulties at low load conditions and high premixing ratios. However, most of the research has been carried out on high performance engines, so additional visualisation studies on optical engines are needed to provide comprehensive theoretical explanations of the experimental results regarding flame generation and evolution in the engine cylinder. High-speed photography is a fundamental means of studying the combustion process, which can directly measure the key parameters in the flame development process and evaluate the combustion process in terms of flame development [24,25].
The above research shows that highly active fuel has significant benefits in improving the performance of dual-fuel engines, but the proportion of high and low active fuel and appropriate injection timing have a great impact on dual-fuel combustion. Early or too late injection timing is not conducive to combustion. Too high or too low energy ratio will make combustion rough or deteriorate, and the actual combustion process in the cylinder is not clear. Therefore, this article uses high-speed photography to capture the self-illumination image of the flame when HCB ignites gasoline in the cylinder. The purpose is to analyze the impact of different energy proportions and injection timings of HCB on the combustion and flame propagation characteristics of ignition gasoline under low load conditions. Providing reference for the expansion of RCCI low-load operating conditions and future energy conservation and emission reduction.
2. Test Device and Design Scheme
2.1. Optical Engine Facility
This paper describes an experimental study carried out on a Jiangling Group VM2.5T four-cylinder direct injection diesel engine. The third cylinder was modified by lengthening its block and piston to convert it into an optical engine with a fully transparent window [26]. Table 1 outlines the main parameters of the optical engine, while Figure 1 illustrates the diagram of the optical engine test bench. The test bench contains two injection systems: direct injection of high activity fuel in the cylinder and gasoline injectors in the intake tract to inject low activity fuel in the intake stroke. A high-pressure fuel pump pressurizes the fuel. The engine flywheel disc is connected to an electric dynamometer by a coupling, with the dynamometer reverse speed adjustable from 0 to 2000 rpm. The intake air heating system and cooling water temperature control system maintain the intake air and circulating water, respectively. The data acquisition system ECU is connected to the computer to manage the fuel injection signal, speed signal, camera synchronization trigger signal, etc.
Table 1. Parameters of the optical engine bench.
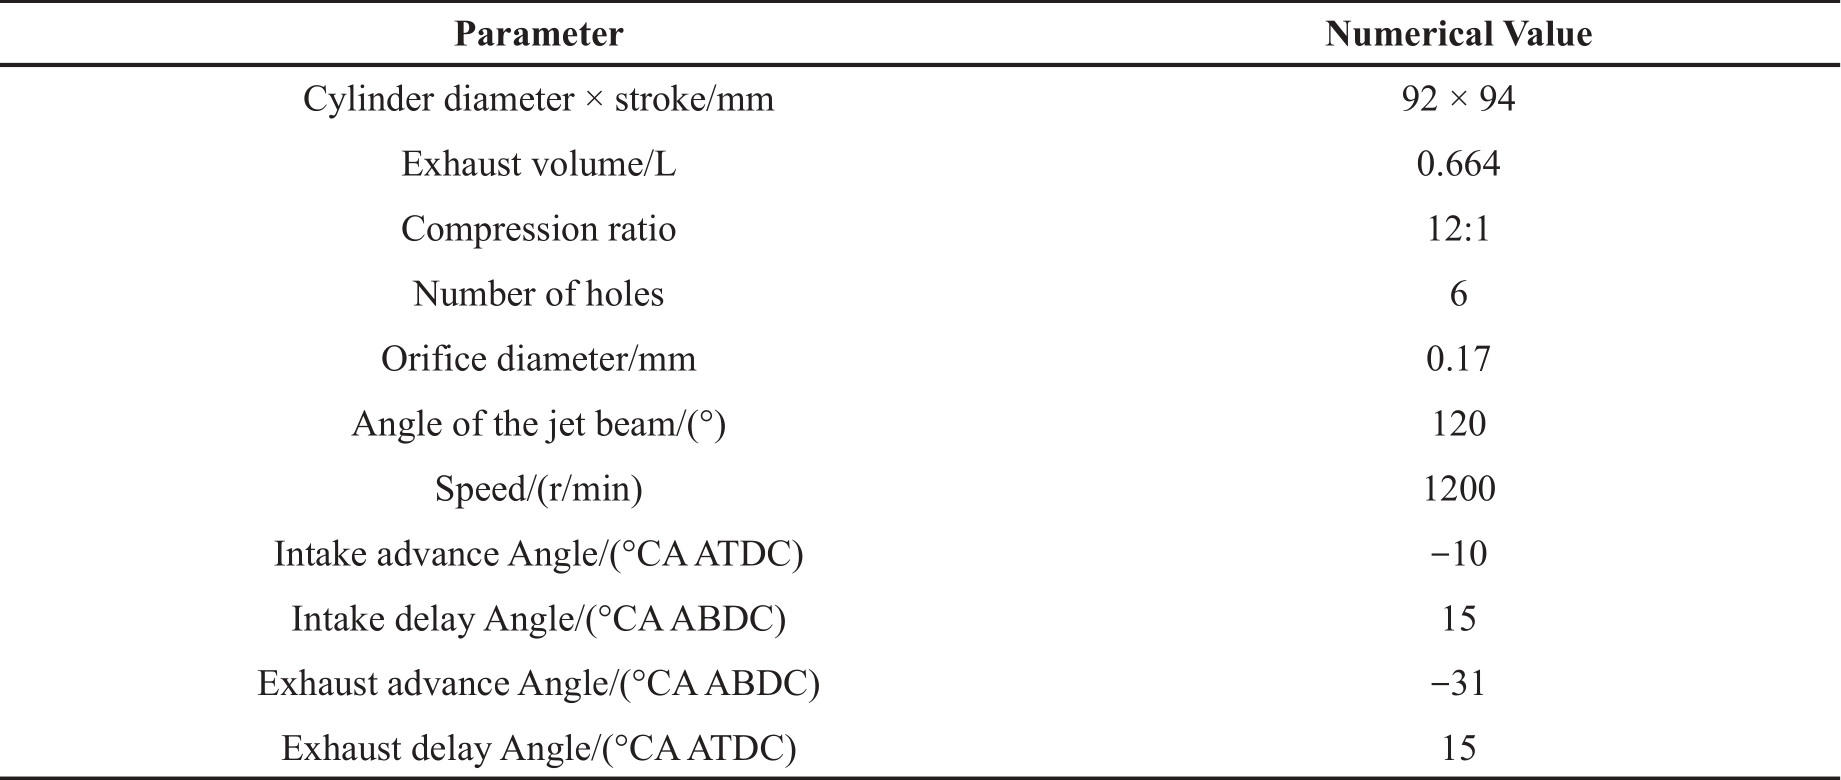
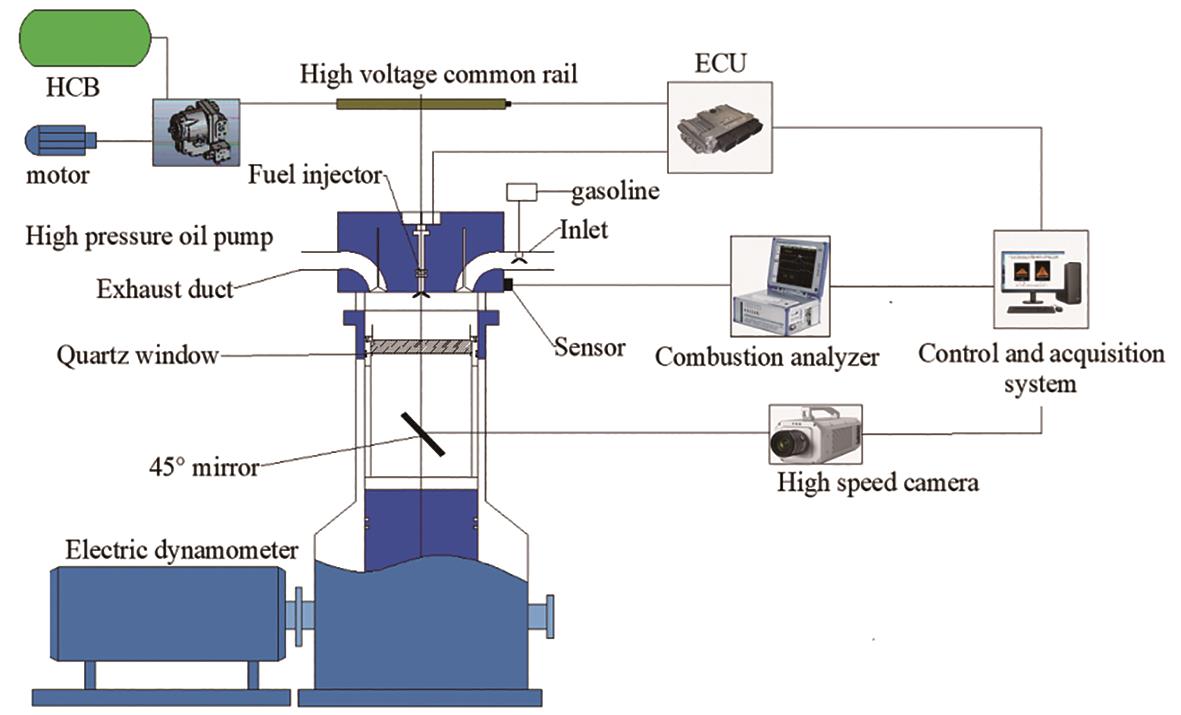
Figure 1. Schematic diagram of engine visualization system.
2.2. Data Acquisition and Analysis
In this work, the instantaneous cylinder pressure was recorded using a cylinder pressure sensor (KISTLER 6082A) and used in conjunction with a combustion analyzer (DEWE-800). The instantaneous cylinder pressure data was recorded with a resolution of 0.5°CA. To ensure the accuracy of the experiments, a multi-cycle averaging method was used to calculate the heat release rate (HRR), combustion duration, and combustion phases from the raw cylinder pressure data.
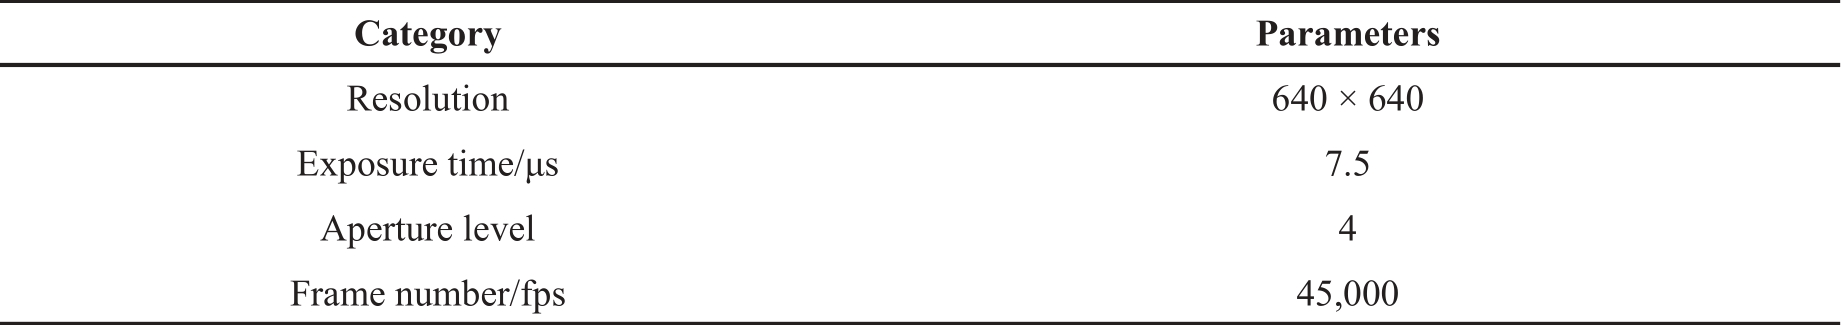
During the test, a quartz window at the top of the elongated piston captures the light signal in the combustion chamber, which is then reflected by a reflector and captured by a high speed camera. The Photron FASTCAM SA-Z is the high-speed camera used in this experiment, which comes equipped with a 200mm medium telephoto macro lens, an aperture setting of f/4, a frame rate of 45000 fps (0.16°CA at 1200 r/min), an exposure time of 7.5 µs, and a photo resolution of 640 × 640. The camera resolution is 640 × 640, and the bit depth is 16-bit. Table 2 shows the relevant parameters of the test equipment.
Table 2. The key parameters of the high-speed camera.
To better understand the influence of injection strategies on the combustion of self-igniting flames, the combustion chamber was illuminated with a mercury lamp to capture spray images inside the engine cylinder. The spray morphology was observed at 30% energy ratios of HCB to analyze the effect on the combustion of the autoignition flame based on the differences in spray morphology. Figure 2 shows the development process of -25°CAATDC spray in the cylinder.
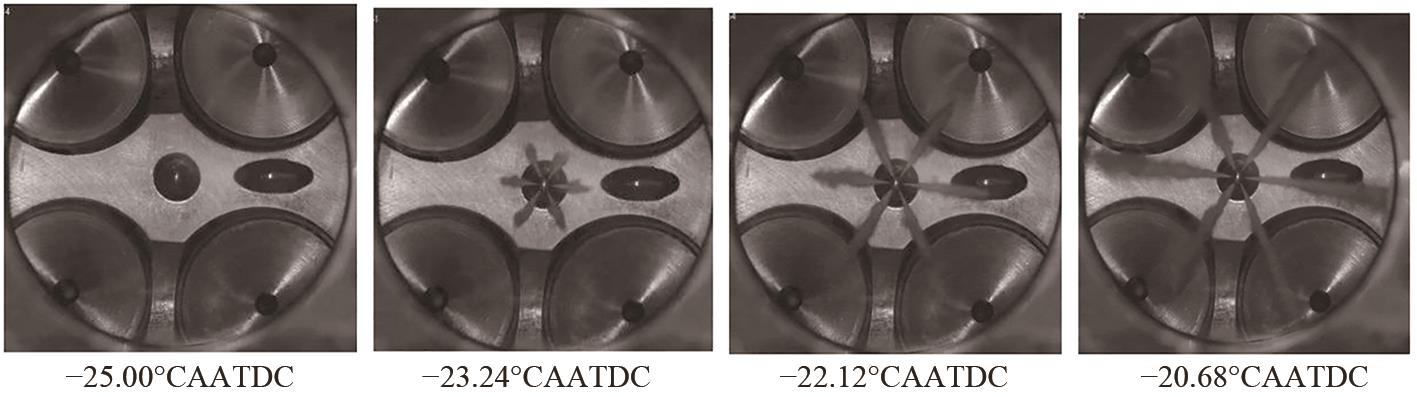
Figure 2. The spray development process inside the cylinder.
To facilitate the analysis of the self-luminous flame development pattern and carbon smoke generation characteristics, the original image is cropped to remove the background light processing. A pseudo-color processing technique using the jet colour band is applied to the image based on the pixel point gray value. This processing allows a more intuitive observation of the flame development pattern and carbon smoke generation characteristics. The original photo has a resolution of 640 × 640, while the processed photo has a resolution of 512 × 512. Figure 3 shows the original image, the cropped image, the pseudo-colour processed image, and the edge detection image.
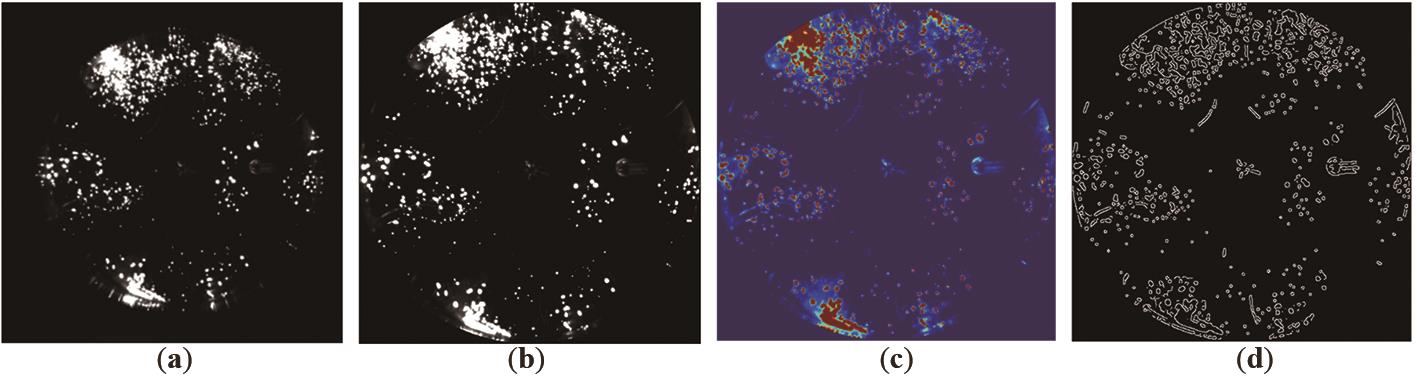
Figure 3. Process of image processing. (a) original image; (b) cropped image; (c) pseudo-colour processed image; (d) edge detection image.
To further investigate the influence of in-cylinder flame combustion on flame luminescence intensity, flame area, and carbon soot radiant area, an analysis was performed. Flame intensity was measured using cropped grayscale images, and pixels with a maximum intensity value of 5% or more were selected for calculation. The calculation method is as follows:
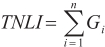
where  is the intensity of flame luminescence, n is the total number of selected pixels, and
  is the grayscale value of the corresponding pixel.
To calculate the flame area, it is necessary to calibrate the pixel size in real dimensions. After measurement, it was found that at a resolution of 512 × 512, 1 cm in real size corresponds to approximately 8.05 pixels, which means that the size of a single pixel is approximately 0.124 mm, denoted as  . To further verify the accuracy of the pixel size, the accumulated sum of pixel sizes in the radial direction was found to be 31.744 mm, while the true radius was 32 mm, resulting in an error of 0.8%. Similarly, pixels with a maximum intensity value of 5% or more were selected for calculation. The calculation method is as follows:

where S is the flame area,  is the total number of selected pixels, and is the pixel size.
Due to the high brightness of carbon soot radiation, it is typically in the overexposure or near overexposure range, which is different from the brightness of premixed combustion flames. Therefore, pixels with a maximum intensity value of 90% or above are selected to approximate the high-intensity carbon soot radiation points, aiming to explore the proportion of the high-intensity carbon soot radiation area (referred to as the carbon soot radiation area) to the flame area. The calculation method is the same as the flame area calculation method.
To calculate the average flame propagation velocity, the original images were subjected to edge detection processing. Based on the definition of average flame velocity [27], the calculation method is as follows:

where  is the increment of the flame area, L is the perimeter of the flame boundary contour, and
  t is the time interval between the two images. Since the time interval between the two images is very short, the increment in L can be neglected. Therefore, when calculating the average flame propagation velocity, the value of L is taken from the previous image.
To further analyze the regions of high soot enrichment in the engine, the visual field was divided into equivalent circles. The center of the visual field was identified using a Matlab program. The pixel grayscale values of the highlighted regions were then accumulated along the radial direction for each circular ring. This process was carried out for all images taken during the entire burn cycle. This provided a quantitative relationship between the region of high soot enrichment and the variation in crankshaft angle. The visual area division is shown in Figure 4, while Figure 5 shows a cloud map showing the temporal variation of the high soot enrichment region.
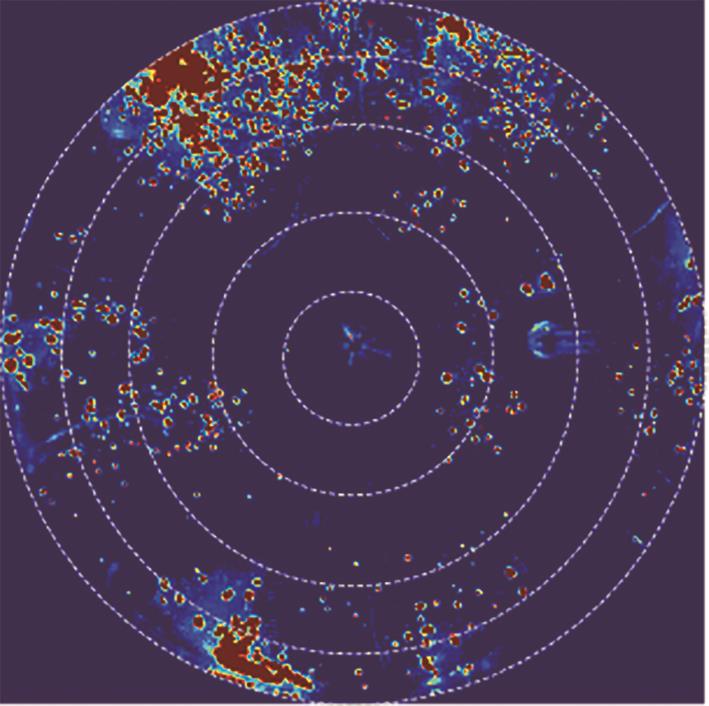
Figure 4. Visualization area division diagram.
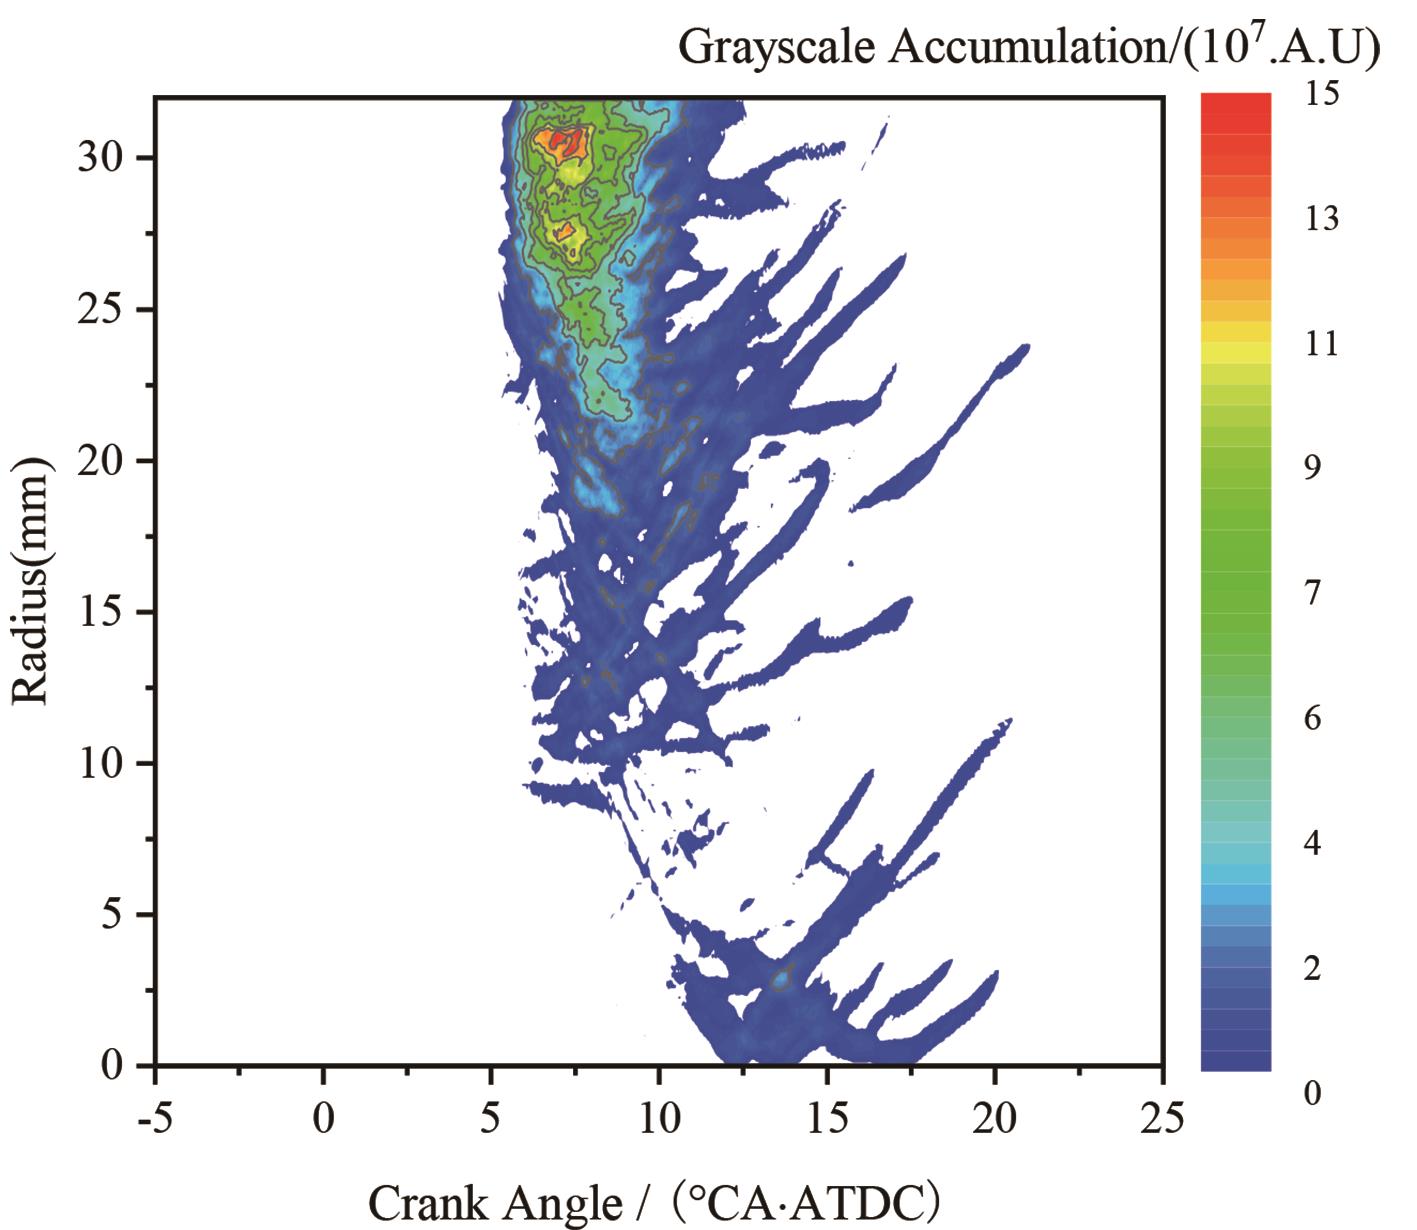
Figure 5. Cloud image of high carbon smoke enrichment area over time.
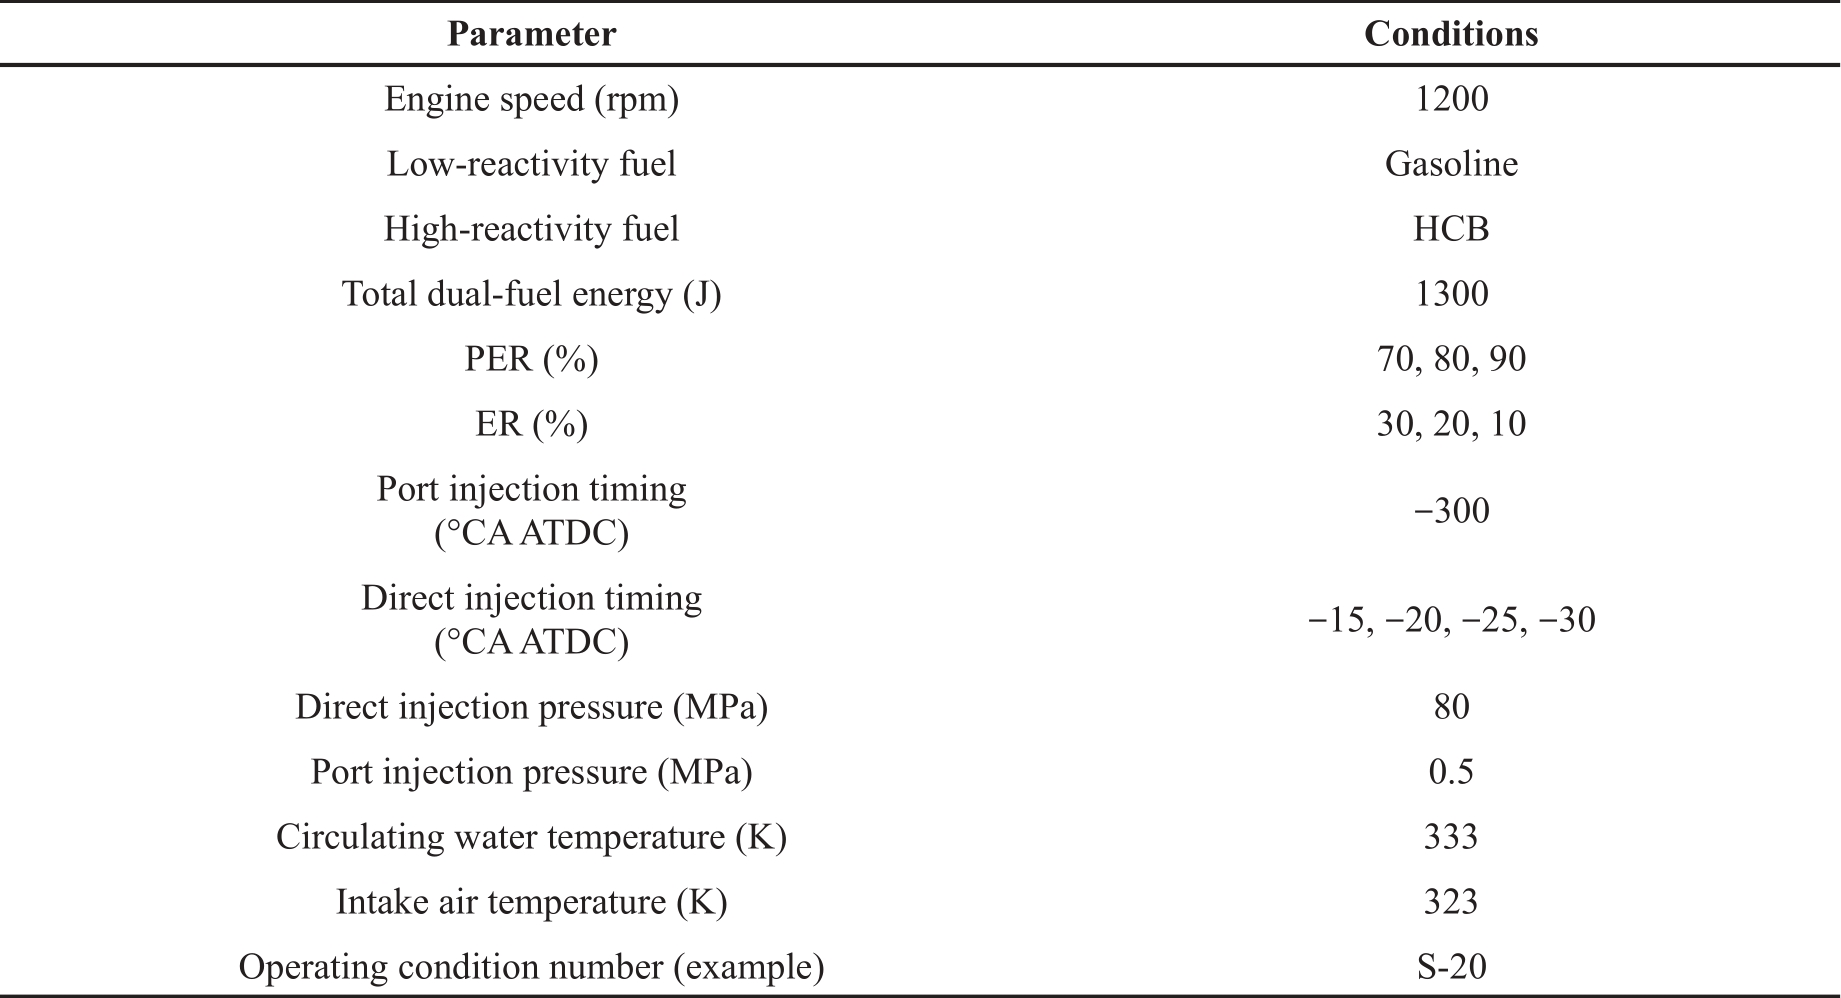
2.3. Test Operation Conditions
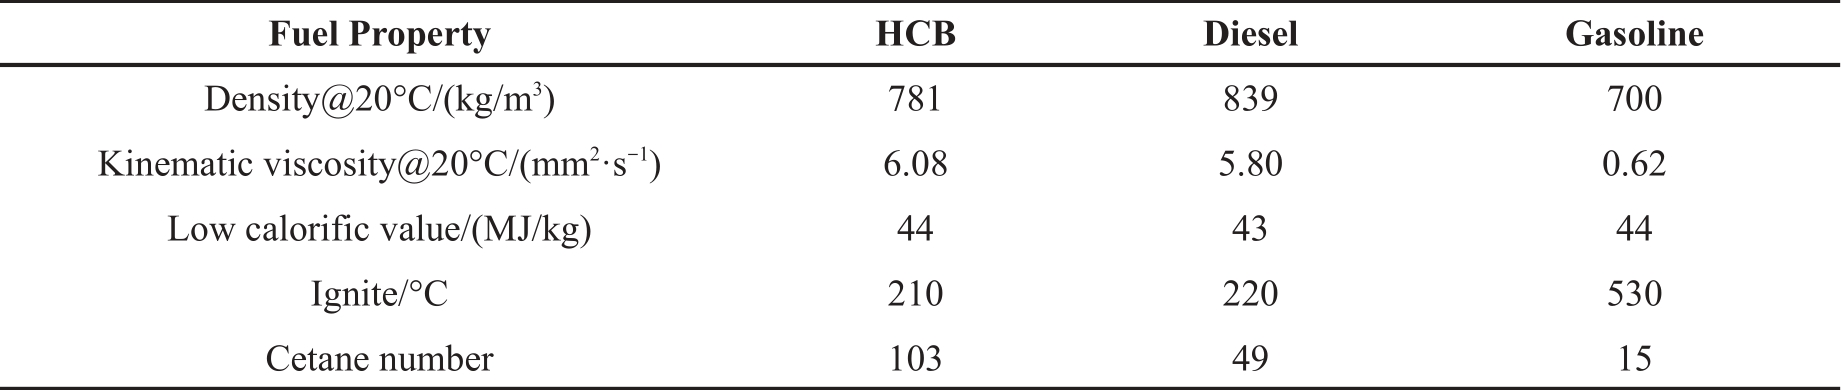
In this test, the total energy of the fuel cycle was set at 1300 J, and the fuel injection quality and the corresponding fuel injection volume were calculated based on the low calorific value of the fuel. The dynamometer speed was set at 1200 rpm. The in-cylinder direct injection pressure was set at 80 Mpa, while the air port injection pressure was set at 0.5 Mpa. The air port injection time was fixed at -300°CAATDC, and the intake air temperature and cooling water temperature were set at 323 K and 333 K, respectively. Table 3 shows the primary physicochemical properties of the test fuels used in the experiment.
Table 3. Main physical and chemical properties of the fuel.
In this work, the influence of varying the premixed energy ratio (PER) of the intake port injection on the ignition and combustion characteristics of the engine, including in-cylinder pressure, heat release rate, combustion centroid, combustion duration, and flame luminosity, was investigated. For RCCI engines, the premixed energy ratio (PER) is commonly used to represent the ratio of the heat released by the low-reactivity fuel injected into the intake port per cycle to the total heat released by the injected fuel per cycle [28]. The proportion of highly active fuel is expressed by ER. The expression for PER and ER are given by:
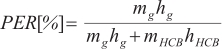

In the equation, the variables are defined as follows:  represents the mass of injected fuel "g";
  represents the lower heating value of fuel "g";
  represents the mass of injected fuel HCB;
  represents the heating value of fuel HCB.
In this work, the combustion characteristics of hydrogenated catalytic biodiesel (HCB) igniting gasoline were studied by varying the energy ratio of HCB/gasoline premixed fuel and the HCB injection timing using a single injection strategy. Details of the experimental design are given in Table 4. The single injection strategy for HCB is designated S-30, where "S" indicates single injection and "-30" represents the HCB injection timing.
Table 4. Test scheme of different hydrogen catalysed biodiesel (HCB) injection strategies.
3. Test Results and Analysis
3.1. Effect of Different Injection Timings of HCB on Ignition Gasoline Combustion
In this section, the energy content of the HCB was kept constant at 30%, and the effect of different HCB injection timings on gasoline combustion ignition was studied. Figure 6 illustrates the cylinder pressure, heat release rate, and combustion phase curves at different injection timings for HCB. It is observed that with the delay of injection timing, both the peak cylinder pressure and heat release rate shift to the right. The peak values of cylinder pressure and heat release rate increase initially and then decrease. At -30°CA, the earlier injection timing extends the pre-mixing time of the in-cylinder mixture, leading to a reduction in the reactivity and weakening of concentration stratification, resulting in suboptimal ignition for gasoline. At -25°CA, the maximum cylinder pressure is 3.71 MPa, and the heat release rate curve exhibits a clear double-peak phenomenon, with a symmetrical distribution near the upper dead center. The analysis shows that HCB and gasoline have better premixing time in S-25, and the overall fuel uniformity of the combustion chamber is improved while the local concentration and activity gradient are higher, and the balance between the overall reactivity and local reactivity is taken into account. At -15°CA, the injection timing is close to the upper dead center, reducing the pre-mixing time of the gas, causing the combustion phase to move away from the upper dead center. Combustion occurs during the downward stroke of the piston, leading to a decrease in cylinder pressure. The majority of heat release is concentrated after top dead center (TDC), which increases heat loss and reduces the effective utilization of heat. Additionally, an overly rich mixture is prone to cracking and generating soot [29]. At -20°CA, the heat release rate reaches its peak, demonstrating excellent heat release performance. Figure 6 also presents the combustion phasing at four different injection timings, where CA10, CA50, and CA90 represent 10%, 50%, and 90% of total heat release, respectively. It is observed that with the delay of injection timing, the combustion centroid gradually moves away from the upper dead center, and the ignition point also delays accordingly. The combustion centroid shifts from 0.24°CA to 7.72°CA. As the injection timing is delayed, the ignition delay period shortens, leading to a reduction in the pre-mixing time of the in-cylinder mixture. Consequently, the combustion phase continuously delays, with combustion primarily occurring during the late stages of combustion.
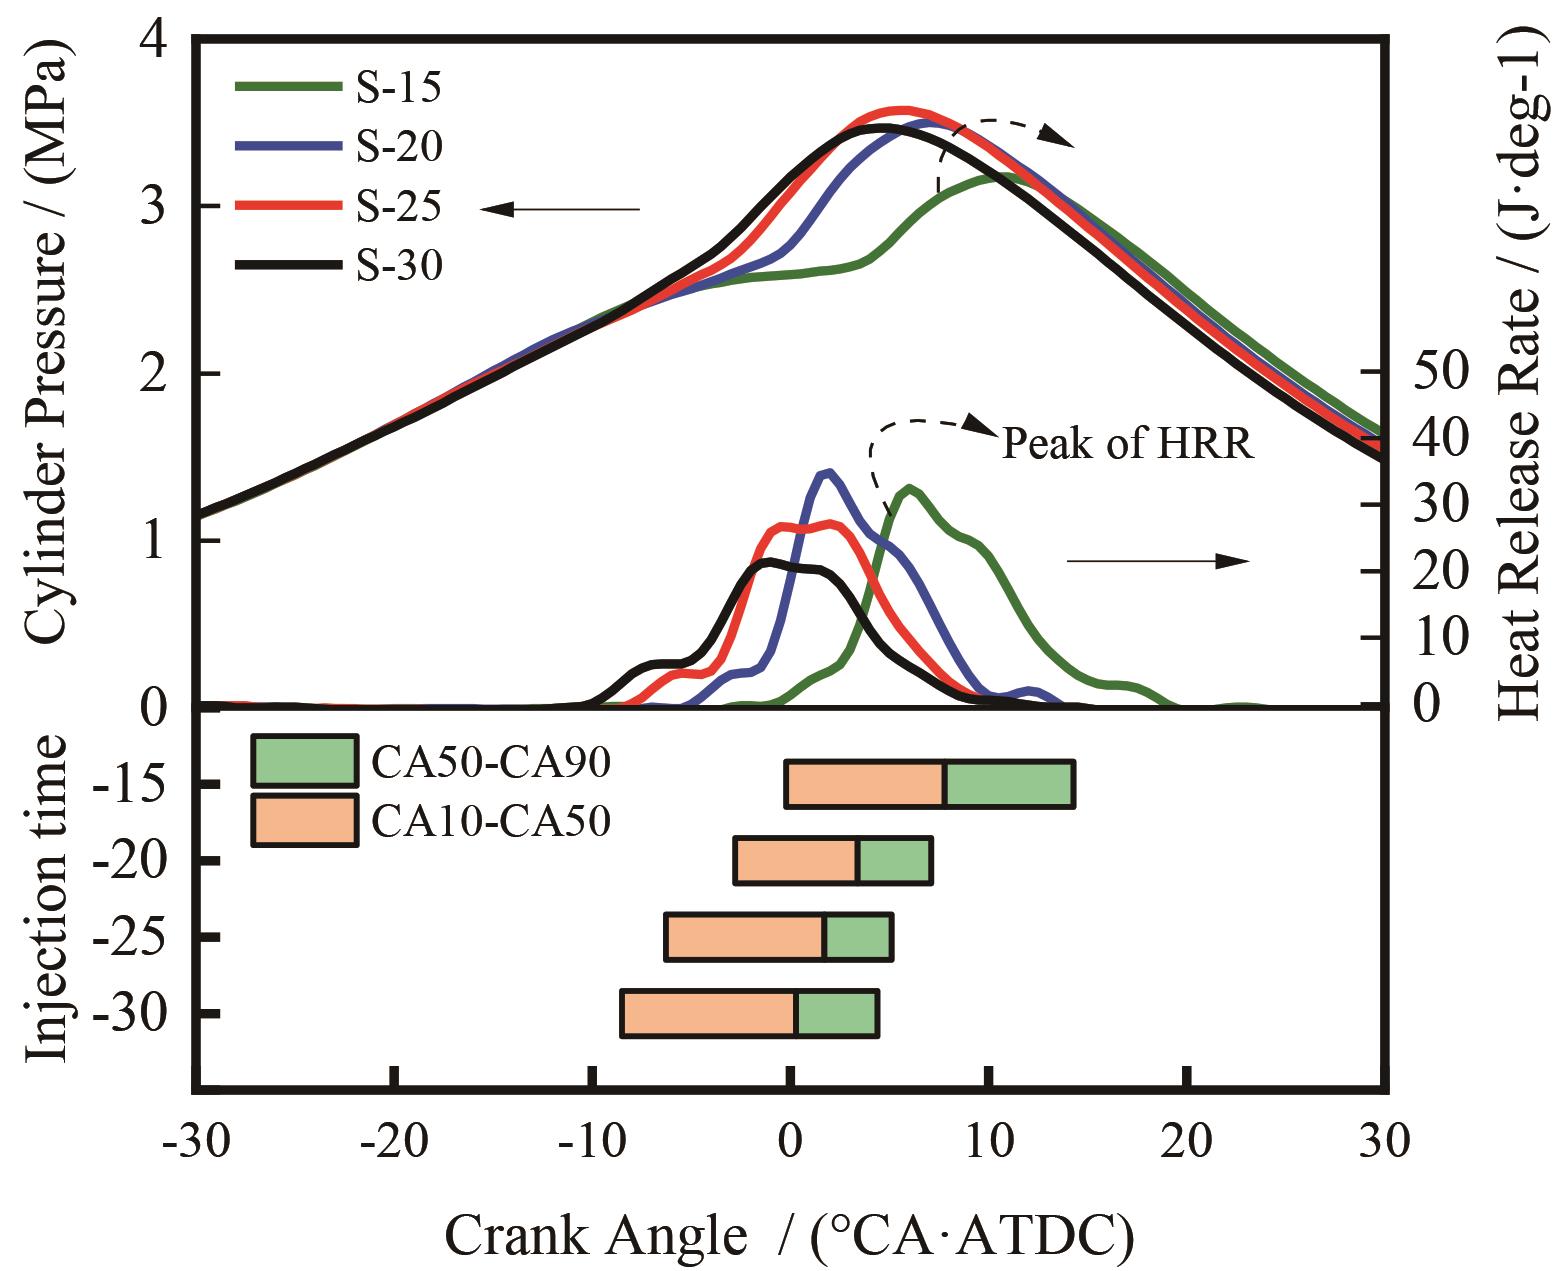
Figure 6. Cylinder pressure and heat release rate at different at different hydrogen catalysed biodiesel (HCB) injection moments.
Figure 7 illustrates the effect of HCB injection timing on cylinder temperature and pressure rise rate. It can be seen from the graph that as the injection timing is delayed, the peak cylinder temperature is also delayed. At -30°CA ATDC, the prolonged premixing time leads to poor combustion, resulting in lower cylinder temperatures. As the injection timing is delayed, the instantaneous pressure rise rate shows a decreasing trend, corresponding to the cylinder pressure curve shown in Figure 4. At -15°CA ATDC, the temperature rise curve has higher values throughout the crankshaft angle variation compared to other injection timings. Although the peak pressure rise rate is the lowest at this timing, the temperature rise reaches its maximum value.
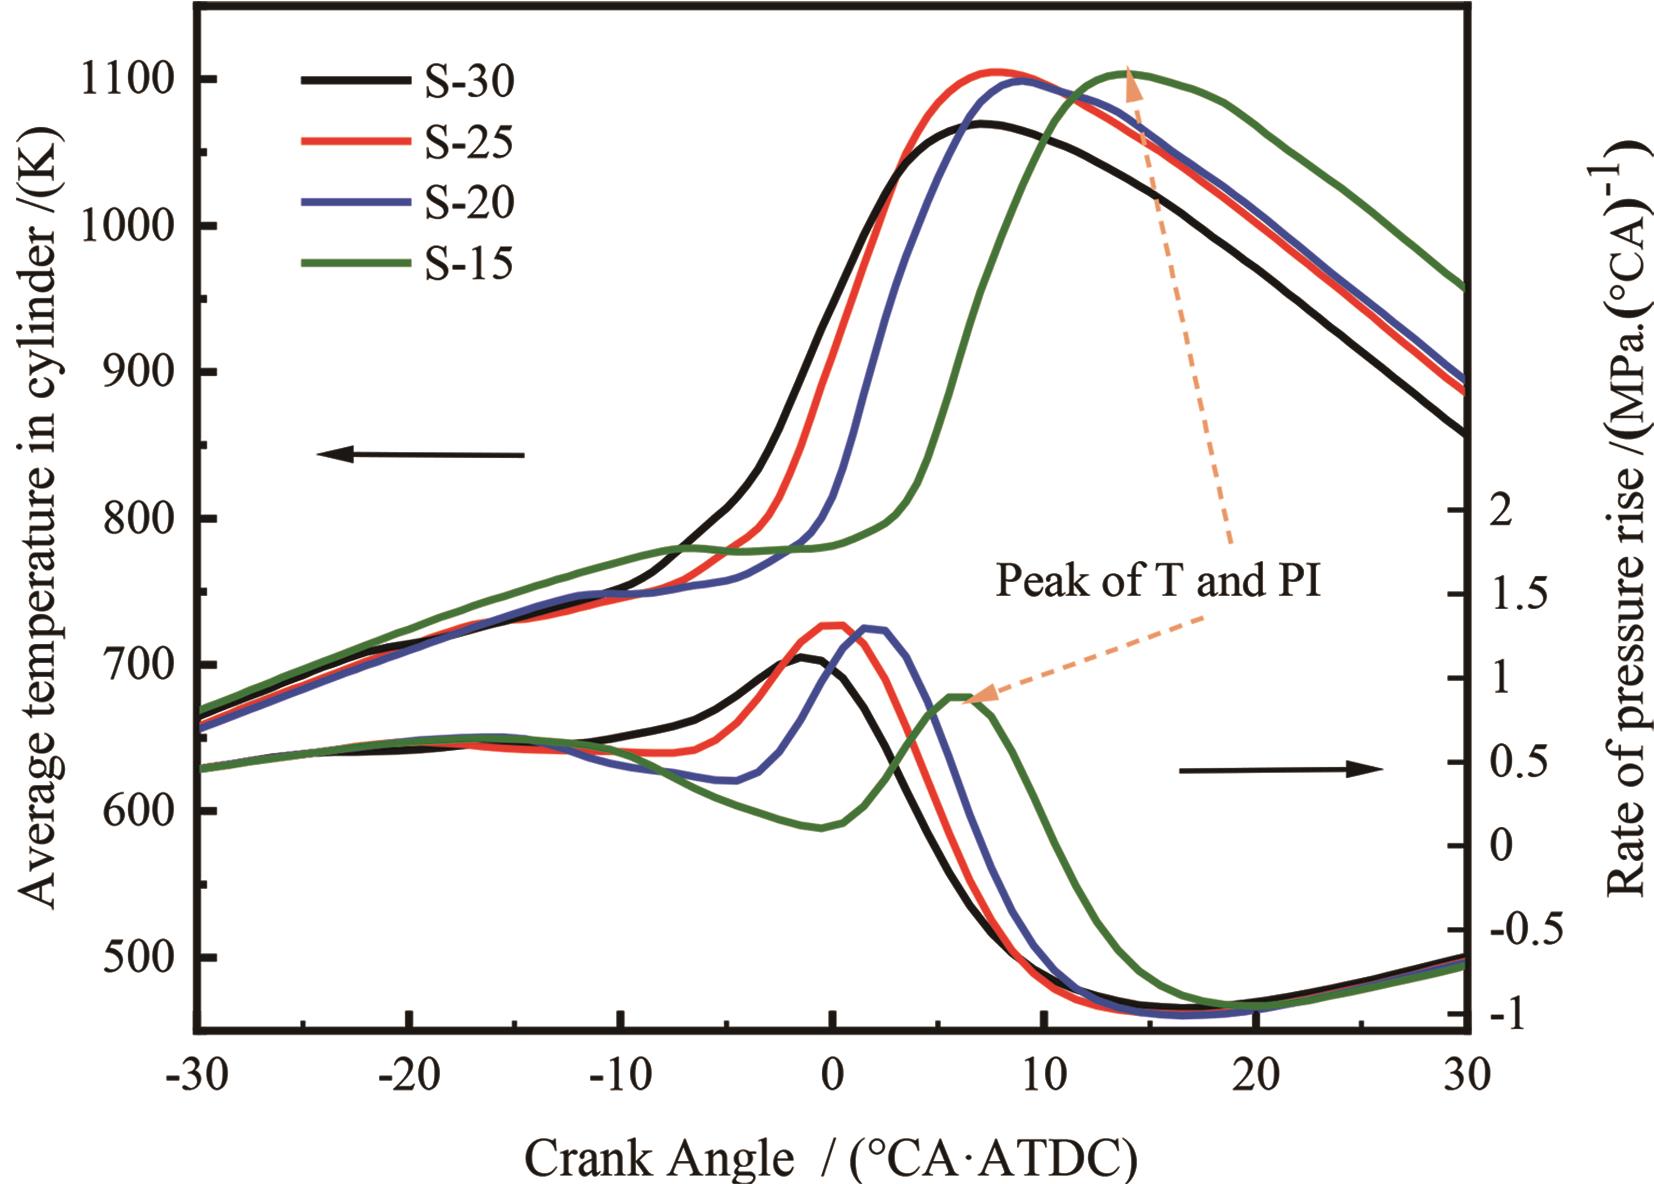
Figure 7. Increase rate of temperature and pressure in cylinder HCB injection timings.
Figure 8 shows the effect of HCB injection timing on cycle heat release. The cycle heat release is highest when the HCB energy is 30%, the cycle heat release is the highest. Compared to -30°CAATDC, the cycle heat release increases by 15.21%, 17.23%, and 27.06% as the injection timing. Although the injection timing of -15°CAATDC gives the highest cycle heat release, it is close to the top dead centre (TDC) of the engine. The combustion centre occurs after the TDC, which means that some of the heat is used inefficiently and increases heat losses.
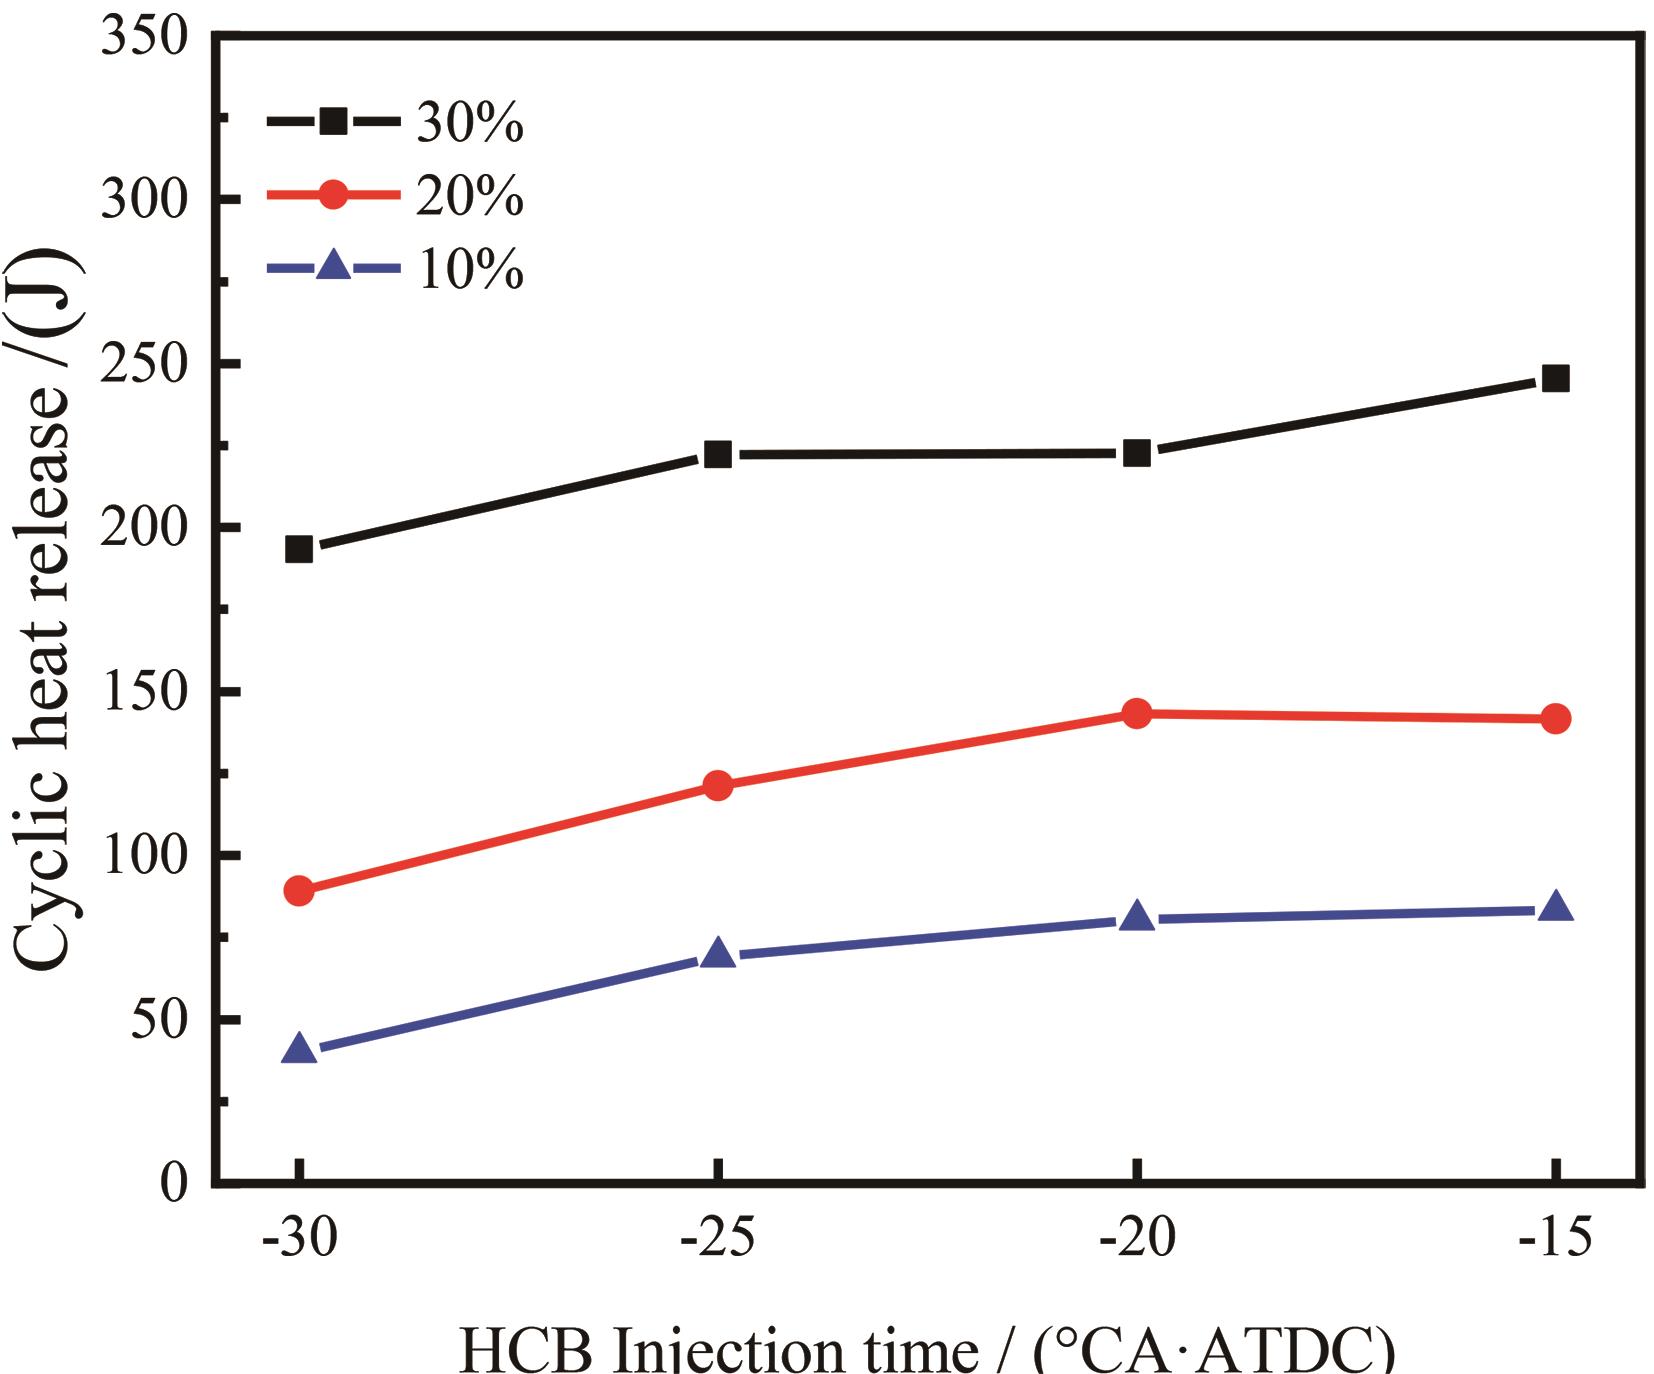
Figure 8. Effect of different ratio and different HCB.
3.2. Effect of Different Injection Timings of HCB on the Flame Development Characteristics of Ignited Gasoline
To visually analyze the flame propagation process throughout the entire cycle, high-speed photography was employed to capture spontaneous luminescent images of the in-cylinder flame under different HCB injection timings. The second image corresponds to the single-frame maximum intensity image with an intensity value of 80%. The remaining images correspond to crank angles CA10, CA50, and CA90. Figure 9 presents high-speed combustion images under different HCB injection timings (for simplicity, the notation ° is used to represent °CAATDC). It is observed that as the HCB injection timing is delayed, the initial point of combustion in the cylinder also delays. The initial position of the flame shifts from the periphery of the combustion chamber to the center, indicating that the high-equivalence ratio region within the combustion chamber is moving from the periphery towards the center. Furthermore, the in-cylinder flame transitions from multi-point auto-ignition around the combustion chamber to diffusion auto-ignition along the oil stream direction from the center of the combustion chamber. This shift suggests a transition from premixed combustion to diffusion combustion. The region near the periphery of the combustion chamber exhibits higher intensity values, attributed to the mixture's proximity to the theoretical stoichiometric ratio, resulting in higher flame temperatures [30]. This area is also the primary region for soot generation.
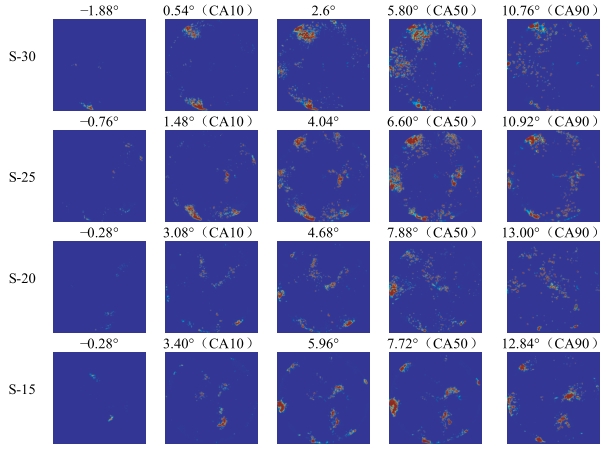
Figure 9. High-speed imaging of combustion at different HCB injection timings.
Figure 10a shows a comparison of the fuel heat release delay period and the glow ignition delay period at different injection timings. The heat release delay period  is defined by the heat release rate (from the injection timing to when 10% of the total heat release is achieved), while the luminous ignition delay period is defined by the luminous intensity (from the injection timing to the peak rate of increase in luminous intensity, which represents the chemiluminescence ignition delay period), which is further subdivided into the chemiluminescent ignition delay period
  and the soot ignition delay period
  . The research shows that:
  <
< <
< [31]. From Figure 9, it can be seen that the largest difference between the heat release ignition delay and the luminous ignition delay occurs at -15°CA ATDC. In addition, as the injection timing is delayed, the fuel reactivity and local equivalence ratio in the combustion chamber increase, resulting in an accelerated combustion rate and a shortened ignition delay period.
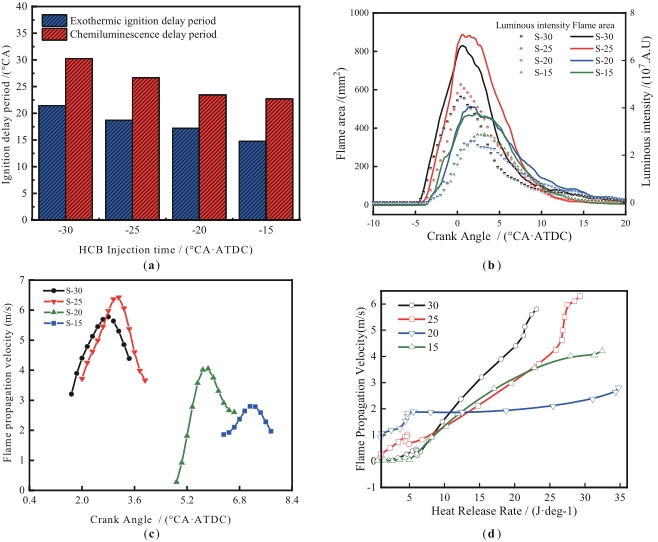
Figure 10. (a) Fuel exothermic ignition delay and luminous ignition delay. (b) Variation of flame area and luminous intensity. (c) The variation of flame propagation velocity. (d) Flame propagation speed and heat release rate.
Figure 10b shows the variation of flame area and luminous intensity with crank angle for different injection timings. As the injection timing is delayed, the peak luminous intensity of the flame first increases, then decreases, and then increases again. Similarly, the peak flame area first increases, and then decreases. Comparing the injection timing of -20°CA ATDC to -15°CA ATDC, it can be seen that although the peak luminous intensity is lower at -20°CA ATDC, the peak flame area is higher. This indicates that as the injection timing approaches top dead centre, the stratification of fuel concentration in the cylinder becomes more pronounced, resulting in a higher local fuel equivalence ratio at the ignition point. At an injection timing of -25°CA ATDC, both the luminous intensity and flame area reach their highest peaks, corresponding to the combustion heat release capability. The peak flame area is 840.02 mm2, which is approximately 26.11% of the total combustion chamber area of 3216.99 mm2. This indicates that the injection timing of -25°CA ATDC is optimal compared to other injection timings.
Figure 10c shows the variation in flame propagation velocity for four different injection timings. As the injection timing is delayed, the peak flame propagation velocity first increases, then decreases, and then increases again. The injection timing of -25°CA ATDC shows the highest peak flame propagation velocity. Comparing the injection timing of -20°CA ATDC with -15°CA ATDC, the peak flame propagation velocity decreases. It is analyzed that at -15°CA ATDC, there is a higher local fuel equivalence ratio in the engine cylinder, which leads to concentrated combustion heat release and accelerates the flame propagation velocity. However, as the combustion center is located after the top dead centre, during the downward stroke of the piston, the cylinder pressure and temperature decrease, resulting in a lower flame propagation velocity compared to the injection timings of -30°CA ATDC and -25°CA ATDC.
Figure 10d shows the relationship between flame propagation speed and heat release rate at different injection times. Due to the proximity of the flame front to the engine cylinder wall, the flame propagation speed decreases due to the reflection of pressure waves from the wall [32]. Therefore, the data in the figure is taken before the peak heat release rate, corresponding to the time before the flame spreads throughout the combustion chamber [33]. It can be observed that the heat release rate and the flame propagation speed show a positive correlation trend at different injection times. At -25°CA ATDC, the flame propagation speed is approximately 6.3 m/s. The peak heat release rate corresponds to the peak flame propagation. However, there are significant differences in the evolution trend of flame propagation speed at different injection timings, which can be attributed to the influence of in-cylinder turbulence. The variation of in-cylinder temperature and pressure at different injection timings can change the corresponding flame propagation speed [34].
Figure 11 shows a quantitative correlation cloud map illustrating the variation of high carbon soot enrichment zones with crankshaft angle. The luminous sources of the in-cylinder combustion flame consist of both chemiluminescence and incandescence from carbon particles. The intensity of the carbon glow is approximately 4 to 5 orders of magnitude greater than that of chemiluminescence. It can therefore be concluded that the self-emission of the flame is solely due to the incandescence of carbon particles [31].
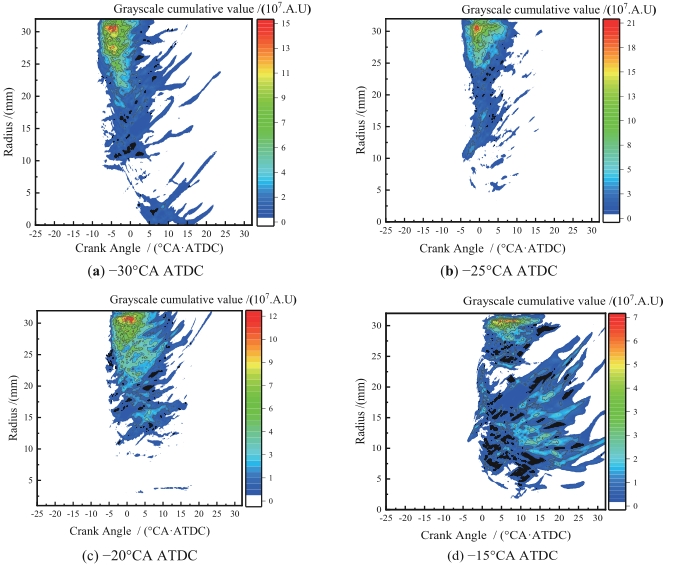
Figure 11. The variation of high-carbon soot enrichment zones with crankshaft angle.
For all four injection timings, the soot-rich region is predominantly concentrated near the periphery of the combustion chamber. The amount of soot first increases and then decreases as the injection timing is delayed, while the soot radiating area first decreases and then increases. With the -25°CA ATDC injection timing, the combustion heat release is more concentrated in the engine cylinder. The distribution of soot is limited to the crank angle range of -2° to 7°, and there is little soot generation within the radial distance of 0–5 mm. The soot rich region is mainly concentrated around the edges of the combustion chamber, and the soot radiation area is relatively small compared to other injection timings, indicating a more concentrated heat release during combustion.
At the -20°CA ATDC and -15°CA ATDC injection timings, the soot area gradually increases while the soot amount decreases. This can be attributed to the combustion center occurring after top dead centre, as the downward movement of the piston promotes better mixing of fuel and air, resulting in increased turbulence and improved soot oxidation. In addition, cylinder pressure and temperature drop at these injection points, inhibiting early soot formation. However, a small amount of soot is observed within the radial distance of 0‒5 mm. This can be explained by the proximity of these injection timings to the top dead centre, where combustion tends to transition to diffusion combustion. In contrast, at the -30°CA ATDC injection timing, early injection leads to a more uniform fuel-air mixture, resulting in regionally premixed combustion. This results in the formation of soot in the radial direction.
3.3. Effects of Different Energy Ratios of HCB on Gasoline Ignition and Combustion
In this section, the HCB injection timing was fixed at -25°CA ATDC to investigate the effect of different HCB energy ratios on the ignition and combustion of gasoline. Figure 12 shows the cylinder pressure and heat release curves for different HCB energy ratios. As the HCB energy ratio decreases, the peak cylinder pressure and heat release rate decreases, and the heat release tends to level off, indicating that the combustion conditions in the cylinder are not good. Analysis shows that as the gasoline premix ratio increases, the in-cylinder mixture becomes more homogeneous, and excessive latent heat of vaporization leads to lower in-cylinder temperature, resulting in poor combustion. Figure 8 shows that as the HCB energy ratio decreases, the cycle heat release also decreases significantly. Cylinder pressure, heat release rate, and cycle heat release all reach their maximum at a 30% ratio. Compared to a 20% and 10% HCB energy ratio, the cycle heat release at a 30% ratio increases by 45.21% and 68.92% respectively when the main injection timing is -25°CAATDC.
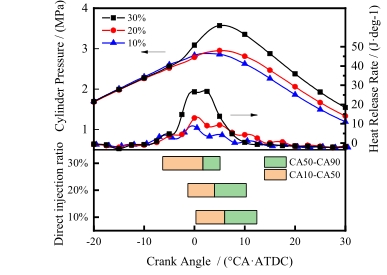
Figure 12. Cylinder pressure and heat release of HCB with different energy ratio.
Figure 13 shows the in-cylinder temperature and pressure rise rates at the corresponding HCB energy ratio. The in-cylinder temperature and pressure rise rate increased significantly as the HCB energy ratio increased, and the in-cylinder temperature and pressure rise rate leveled off at 20% and 10% ratios.
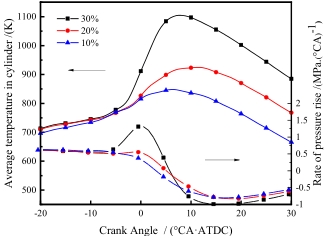
Figure 13. In-cylinder temperature and pressure rise rates for different energy ratios of HCB.
Figures 14 and 15 show the peak cylinder pressure curves for different injection timings and HCB energy ratios. In Figure 14, when the HCB energy ratio is 20%, the peak cylinder pressure at -20°CA ATDC injection timing is higher than that at -25°CA ATDC. However, when the HCB energy ratio is 30%, the peak cylinder pressure at -20°CA ATDC is lower than the peak cylinder pressure at the main injection timing of -25°CA ATDC. In Figure 15, it can be seen that the peak cylinder pressure first increases and then decreases as the HCB injection timing is delayed. In addition, the peak cylinder pressure at 30% HCB energy ratio is significantly higher than that at 20% and 10% HCB energy ratio, suggesting that increasing the HCB energy ratio is beneficial for gasoline ignition.
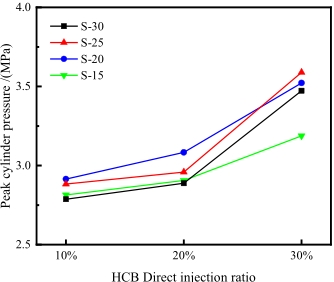
Figure 14. Peak in-cylinder pressure for different energy ratios of HCB.
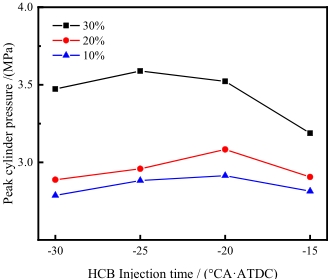
Figure 15. Peak in-cylinder pressure at different injection timings.
3.4. Effect of Different Energy Ratios of HCB on the Flame Development Characteristics of Ignited Gasoline
To better understand the influence of the energy ratio on the auto-ignition flame, spray images inside the cylinder were compared at different energy ratios of HCB. The imaging process involved illuminating the combustion chamber with a mercury lamp, and the spray morphology at -25°CA ATDC injection timing is shown in Figure 16. The red dashed area shows the process of the spray front hitting the combustion chamber walls. With the total energy per engine cycle held constant, an increase in the premixing ratio means a reduction in the mass of direct injected homogeneous charge combustion (HCB). It is evident that the reduction in the HCB spray pulse width reduces the intensity of the spray front impinging on the combustion chamber walls.
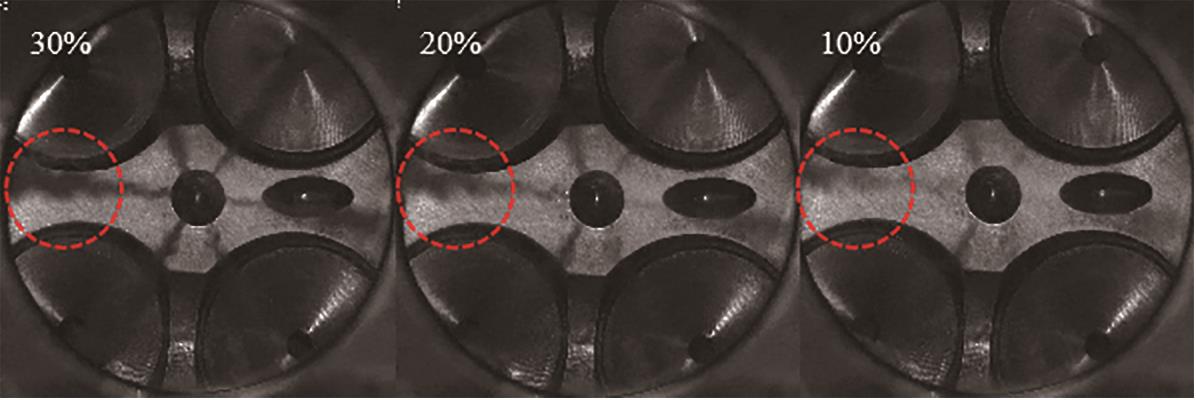
Figure 16. Spray image of HCB with different energy ratio.
The high speed combustion patterns at different HCB energy percentages are shown in Figure 17. As the HCB energy percentage decreases, the initial flame appearance time inside the engine cylinder is continuously delayed. The results indicate that the initial position of the flame is close to the combustion chamber wall at the 30% HCB energy percentage. As the combustion progresses, the flame appears around the combustion chamber with a large area of multi-point spontaneous combustion, and the flame development trend goes from the periphery of the combustion chamber to the central oil injection area, which is more inclined to the characteristics of premixed combustion. The flame of the whole combustion process under 10% HCB energy content was concentrated in the peripheral area of the combustion chamber and appeared in the form of multi-point spontaneous combustion, but due to the low percentage of HCB energy content, the whole flame area was small and the incomplete combustion phenomenon was more serious.
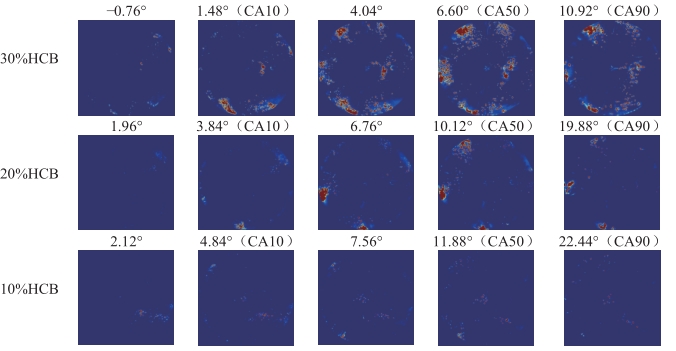
Figure 17. High-speed imaging of combustion with different energy share of HCB.
Figure 18a shows the comparison between the heat release ignition delay and the luminous ignition delay of HCB at different energy percentages. From the figure, it can be seen that as the energy percentage decreases, both the heat release ignition delay and the luminous ignition delay increase following the same trend. The greatest difference between the two occurs at an energy percentage of 10%. The reduction in HCB leads to a decrease in the reactivity of the fuel mixture in the cylinder, resulting in a lower combustion rate.
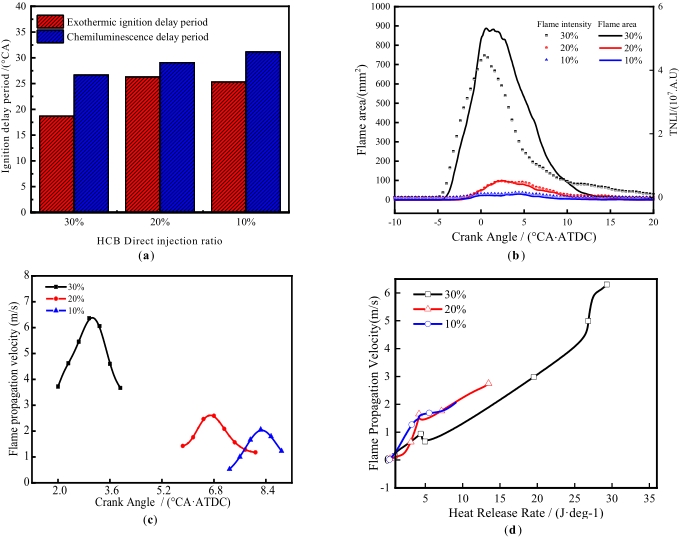
Figure 18. (a) The heat release ignition delay and the luminous ignition delay of HCB. (b) The variation of flame area and luminous intensity. (c) The flame propagation speed. (d) Flame propagation speed and heat release rate.
Figure 18b shows the variation of flame area and luminous intensity with crank angle at different percentages of energy. As the energy ratios of HCB decreases, both flame luminous intensity and flame area decrease. In addition, the peak values of flame luminous intensity and flame area are delayed. At 10% energy ratios of HCB, both flame luminous intensity and flame area are very low, and their peak values are less than 15% of those at 30% energy ratios of HCB. This further indicates significant incomplete combustion phenomena at low energy ratios of HCB. Combined with the high speed combustion imaging, it can be observed that the bright red flame regions (higher luminosity) are more prominent in the 20% and 10% energy ratios of HCB, while the pale blue flame regions (lower luminosity) are less prominent. However, in the case of 30% energy ratios of HCB, the pale blue flame regions increase significantly, indicating better performance of the homogeneous mixture combustion in the cylinder. Therefore, the increase of HCB energy ratio enhances the dual-fuel combustion condition, which is conducive to the improvement of combustion in terms of light intensity and flame area, but there is a high equivalent ratio area in the oil beam area of HCB injection, and a small amount of carbon smoke may be generated locally.
Figure 18c shows the flame propagation speed at different energy ratios. As the ratio decreases, the peak flame propagation speed gradually decreases and shifts to the right. At 20% and 10% energy ratios of HCB, the flame propagation speed decreases significantly. This is due to the increased proportion of gasoline energy, which increases the latent heat of evaporation in the engine cylinder and worsens the combustion conditions of HCB. As a result, combustion is more concentrated in regions with high local fuel equivalence ratios, leading to a decrease in flame propagation speed.
Figure 18d shows the relationship between flame propagation speed and heat release rate at different energy ratios. At 20% and 10% energy ratios, the peak flame propagation speeds correspond to peak heat release rates of 2.84 m/s and 2.1 m/s, respectively, with heat release rates of 14.2 J/°C and 9.8 J/°C. At an energy ratio of 30%, the heat release rate is still increasing and has not reached its peak. During this process, the mixed gas evaporates and releases heat at the same time. Therefore, before a heat release rate of 15 J/°C is reached, the flame propagation speed is lower than that of the 20% and 10%. Another reason is that the proportion of direct injection in the combustion chamber decreases, so that combustion only occurs in localized regions with high equivalence ratios. In these regions, the fuel evaporates rapidly and undergoes combustion, releasing heat. As a result, the flame propagation speed is relatively faster in this area.
Figure 19 shows the quantified relationship cloud map of the high soot enrichment region as a function of crank angle. Under three different ratios, both the soot area and the soot mass gradually decrease. At a 20% ratio, the soot enrichment region is mainly located at the edges of the combustion chamber. However, at a 10% ratio, the soot enrichment region appears near the injector. Analyzing the spray images in conjunction with this observation, it can be concluded that at a 10% ratio, the amount of directly injected HCB is significantly reduced. This results in a decrease in the spray penetration distance spray the quality and height of the spray. As a result, the spray is primarily concentrated in the central region of the combustion chamber.
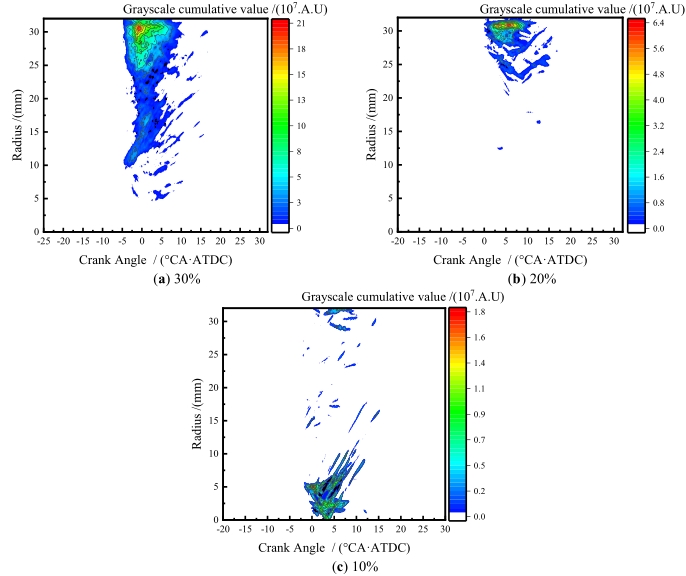
Figure 19. The variation of high-carbon soot enrichment zones with crankshaft angle.
4. Conclusions
In this study, an optical engine setup combined with high-speed photography was used to investigate the influence of HCB on gasoline ignition using a single injection strategy. By adjusting the HCB injection timing and energy ratio, the combustion and flame evolution characteristics were analyzed under different experimental conditions. The main conclusions were as follows:
(1) Ignition and combustion characteristics were significantly affected by HCB injection timing. The peak cylinder pressure and heat release rate varied with different injection timings, indicating the importance of precise control of injection timing for optimal combustion performance. At a constant HCB energy ratio of 30%, the pressure rise rate at -25°CA ATDC shows a relatively steady increase without abrupt peaks, and reaches a maximum pressure peak with a smooth pressure rise.
(2) The energy ratio had a significant effect on ignition delay and combustion duration. Higher energy ratio resulted in shorter ignition delay and combustion duration, indicating improved combustion efficiency. When the energy ratio of HCB was 30%, the heat release increased by 45.21% and 68.92%, respectively, compared to 20% and 10%. The results show that increasing the energy ratio of HCB is beneficial to the ignition of gasoline.
(3) The energy ratio of the HCB affects flame development. As the energy ratio of HCB decreases, the flame area and flame intensity decrease, and the flame area and flame intensity peak delay. This indicates that the lower the energy ratio of HCB, the higher the local fuel equivalent ratio, and the higher the degree of incomplete combustion.
(4) As the energy ratio of HCB decreases, the flame propagation speed decreases, and the flame peak propagation speed decreases and shifts to the right along the crank angle. This is due to the increase in the latent heat of vaporization of relatively high-energy gasoline, which leads to poor combustion conditions, and combustion is concentrated in the area with relatively high local fuel equivalent.
Author Contributions: Conceptualization, L.C. and X.L.; methodology, Y.J.; software, J.Y.; validation, B.G.; formal analysis, B.G.; investigation, B.G.; resources, B.G.; data curation, B.G.; writing—original draft preparation, B.G. and L.C.; writing—review and editing, B.G.; visualization, B.G.; supervision, Q.W.; project administration, Q.W.; funding acquisition, Q.W. All authors have read and agreed to the published version of the manuscript.
Funding: This work was supported by the National Natural Science Foundation of China (Nos.51876083).
Data Availability Statement: Not applicable.
Conflicts of Interest: The authors declare no conflict of interest.
References
- Birol, F. Key World Energy Statistics; International Energy Agency: Paris, France, 2017.
- Korakianitis, T.; Namasivayam, A.M.; Crookes, R.J. Diesel and rapeseed methyl ester (RME) pilot fuels for hydrogen and natural gas dual-fuel combustion in compression-ignition engines. Fuel 2011, 90(7), 2384–2395. DOI: https://doi.org/10.1016/j.fuel.2011.03.005
- Nora, M.D.; Lanzanova, T.D.M.; Zhao, H. Investigation of performance and combustion characteristics of a four-valve supercharged two-stroke DI engine fuelled with gasoline and ethanol. Fuel 2018, 227, 401–411. DOI: https://doi.org/10.1016/j.fuel.2018.04.078
- Du, J.K.; Sun, W.C.; Wang, X.D.; et al. Experimental study on combustion and particle size distribution of a common rail diesel engine fueled with GTL/diesel blends. Applied Thermal Engineering 2014, 70(1), 430–440. DOI: https://doi.org/10.1016/j.applthermaleng.2014.05.037
- Dec, J.E. Advanced compression ignition engines:understanding the in-cylinder processes. Proceedings of the Combustion Institute 2009, 32(2), 2727–2742. DOI: https://doi.org/10.1016/j.proci.2008.08.008
- Sharma, T.K.; Rao, G.; Murthy, K.M. Homogeneous charge compression ignition (HCCI) engines: A Review. Archives of Computational Methods in Engineering 2015, 23(4), 1–35. DOI: https://doi.org/10.1007/s11831-015-9153-0
- Yao, M.; Zheng, Z.; Liu, H. Progress and recent trends in homogeneous charge compression ignition(HCCI) engines. Progress in Energy & Combustion Science 2009, 35(5), 398–437. DOI: https://doi.org/10.1016/j.pecs.2009.05.001
- Reitz, R.D.; Duraisamy, G. Review of high efficiency and clean reactivity controlled compression ignition (RCCI) combustion in internal combustion engines. Progress in Energy and Combustion Science 2015, 46, 12–71.
- Kokjohn, S.L; Hanson, R.M.; Splitter, D.A.;et al. Experiments and modeling of dual-fuel HCCI and PCCI combustion using in-cylinder fuel blending. SAE International Journal of Engines 2010, 2, 24–39. DOI: https://doi.org/10.4271/2009-01-2647
- Kokjohn, S.L.; Hanson, R.M.; Splitter, D.A.; et al. Fuel reactivity controlled compression ignition (RCCI): a path way to controlled high efficiency clean combustion. International Journal of Engine Research 2011, 12(3), 209–226. DOI: https://doi.org/10.1177/1468087411401548
- Reitz, R.D. Review of high efficiency and clean reactivity controlled compression ignition (RCCI) combustion in international engines. Progress in Energy and Combustion Science 2015, 46(2), 12–71.
- Thongchai, S.; Lim, O. Investigation of the combustion characteristics of gasoline compression ignition engine fueled with gasoline-bio diesel blends. Journal of Mechanical Science and Technology 2018, 32(2), 959–967. DOI: https://doi.org/10.1007/s12206-018-0146-9
- Reitz,Duraisamy, G., R.D. Review of high efficiency and clean reactivity controlled compression ignition (RCCI)combustion in internal combustion engines. Progress in Energy and Combustion Science 2015, 46, 12–71. DOI: https://doi.org/10.1016/j.pecs.2014.05.003
- Ren, S.; Guo, Y.; Yan, Y.; et al. Experimental study on the effect of compression ratio on the full working conditions of dual-fuel combustion. Journal of Engineering Thermophysics 2021, 42(6), 1591–599.
- Zhu, J.; Wang, Q.; Wang, S. Experimental study on the spray characteristics of gasoline/diesel blended fuel with two-stage injection. Internal Combustion Engine Engineering 2020, 41(2), 1–7.
- Ma, S.; Zheng, Z.; Liu, H.; et al. Experimental investigation of the effects of diesel injection strategy on gasoline/diesel dual-fuel combustion. Applied Energy 2013, 109(1), 202–212. DOI: https://doi.org/10.1016/j.apenergy.2013.04.012
- Rahnama, P.; Paykani, A.; Bordbar, V.; et al. A numerical study of the effects of reformer gas composition on the combustion and emission characteristics of a natural gas/diesel RCCI engine enriched with reformer gas. Fuel 2017, 209(1), 742–753. DOI: https://doi.org/10.1016/j.fuel.2017.07.103
- Zheng, Z.; Li, S.; Liu, H.; et al. Mechanisms of n-butanol fuel properties on low-temperature combustion in diesel engines. Journal of Internal Combustion Engines 2013, 31(2), 97–102.
- Liu, R. Advanced Technology of Diesel Engine; Chemical Industry Press: Beijing, China, 2020.
- Qiu, Y.N. Development of the second generation biodiesel technology. Shanxi Science and Technology 2015, 30(6), 57–59.
- Zhao, X. Study on Combustion and Emission Characteristics of Biodiesel/Gasoline Blends. Thesis, Ph.D.,Chang'an University,Xi'an,China, 2017.
- Xuan, T.; Sun, Z.; Mi, Y.; et al. Methanol/octyl alcohol/HCB mixed fuel spray combustion characteristics. Journal of Internal Combustion Engine 2022, 40(3), 216–224.
- Zhong, W. Visualization of Combustion Characteristics and Carbon Soot Generation Process of Second Generation Biodiesel Spray. Thesis, Ph.D.,Jiangsu University,Zhenjiang,China, 2016.
- Song, H.; Peng, Z.; Quinton, K.S.; et al. An Experimental Study on Effects of Fuel Oxygenates on Diesel Engine Combustion. Energy Procedia 2015, 66, 17–20. DOI: https://doi.org/10.1016/j.egypro.2015.02.009
- Nithyanandan, K.; Gao, Y.; Wu, H.; et al. An Optical Investigation of Multiple Diesel Injections in CNG/Diesel Dual-Fuel Combustion in a Light Duty Optical Diesel Engine. SAE Technical Paper 2017, 2017(1), 755. DOI: https://doi.org/10.4271/2017-01-0755
- He, X.; Zeng, W.; Shang, Y.; et al. Transparent Diesel Engine Design and Its Application in Visualization Research. Chinese Internal Combustion Engine Engineering 2014, 35(2), 42–47.
- Ma, X.; Xu, H.; Jiang, C.; et al. Ultra-high speed imaging and OH-LIF study of DMF and MF combustion in a DISI optical engine. Applied Energy 2014, 122(5), 247–260.
- Dong, S. Mode Test and Numerical Simulation of Ethanol/Diesel Dual Fuel Premixed Low Temperature Combustion. Thesis, Ph.D.,Huazhong University of Science and Technology,Wuhan,China, 2018.
- Internal Combustion Engine Teaching and Research Department,Xi 'an Jiaotong University. Principles of Internal Combustion Engine; China Agricultural Machinery Press: Beijing, China, 1981.
- Zhang, H.; Sun, W.; Guo, L.; et al. Combustion visualization for coal-based synthetic fuel and its mixture with oxygenated fuels achieved using two-color method. Energy Procedia 2019, 160, 372–380. DOI: https://doi.org/10.1016/j.egypro.2019.02.170
- Zhang, P.; Tang, Q.L.; Chen, B.L.; et al. Study of flame autoluminescence in diesel engines burning different oxygen-doped fuels. Journal of Internal Combustion Engines 2014, 32(6), 489–495.
- Tian, G.; Li, H.; Xu, H.; et al. Spray characteristics study of DMF using phase doppler particle analyzer. SAE Technical Paper 2010, 1, 1505. DOI: https://doi.org/10.4271/2010-01-1505
- Wilson, T.S.; Xu, H.; Richardson, S.; et al. An experimental study of combustion initiation and development in an optical HCCI engine. SAE Technique Paper 2005, 1, 2129. DOI: https://doi.org/10.4271/2005-01-2129
- Ma, X.; Xu, H.; Jiang, C.; et al. Ultra-high speed imaging and OH-LIF study of DMF and MF combustion in a DISI optical engine. Applied Energy 2014, 122, 247–260. DOI: https://doi.org/10.1016/j.apenergy.2014.01.071