The fatigue performance of a three-axle truck chassis is an important consideration for ensuring structural reliability under variable road-induced loading. This study presents a numerical investigation of the fatigue behavior of a three-axle truck chassis using finite element analysis in ANSYS. A three-dimensional chassis model was developed in SolidWorks and evaluated under static loading, modal analysis, and dynamic road excitation corresponding to ISO 8608 Class D and Class E road profiles at a vehicle speed of 20 km/h. The fatigue life and fatigue damage were predicted using the Goodman, Gerber, and Soderberg mean-stress correction criteria under identical material and loading conditions. The static analysis identified the rear suspension mounting region as the critical structural area, with a maximum von Mises stress of 382.39 MPa, while the minimum predicted fatigue lives under Class D were 8338.5, 8290.4, and 8338.5 cycles for the Goodman, Gerber, and Soderberg criteria, respectively. Under the more severe Class E road profile, the corresponding minimum predicted fatigue lives were 6349.9, 6306.2, and 6349.9 cycles, indicating that road excitation severity has a greater influence on the predicted fatigue life than the selection of the mean-stress correction criterion under the present loading conditions.
- Open Access
- Article
Fatigue Analysis of Vehicle Chassis for Three-Axle Truck Using Ansys Software
- Dien Nguyen Qui,
- Anh Nguyen Hoang * and
- Dat Pham Le Xuan
Author Information
Received: 22 July 2026 | Revised: 14 September 2026 | Accepted: 13 October 2026 | Published: 27 October 2026
Abstract
Keywords
1. Introduction
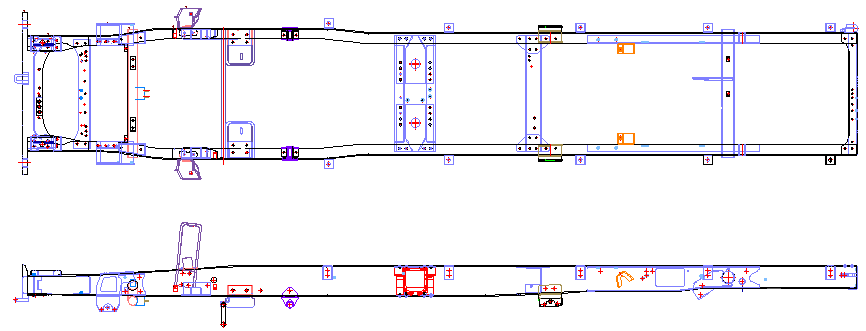
The chassis is considered the backbone of the car, connecting and bearing the vehicle’s loads, including the tires, engine, drivetrain, and suspension. Among these, the chassis supports and fixes the vehicle’s components [1]. In addition, the chassis must be strong enough to withstand shock, torsion, vibration, and other stresses [2]. The chassis consists of side bars attached to a series of crossbars. Stress analysis using the Finite Element Method (FEM) can be used to determine the location of the highest stress [3]. This critical point is one of the factors that can cause fatigue failure [4]. Stress magnitude can be used to predict the lifespan of a truck chassis. The accuracy of the predicted lifespan of a truck chassis depends on the results of its stress analysis. Due to different purposes, uses, and diverse and complex load regimes, the requirements for the chassis are high rigidity, high fracture strength, and high fatigue strength [4]. Figure 1 illustrates the main load-bearing components of the vehicle chassis and their structural arrangement.
Under operational conditions, the vehicle chassis is exposed to complex cyclic stresses from the suspension system, engine vibrations, and the inertia of the cargo, which eventually lead to microcrack initiation and structural fatigue failure [5]. Static and modal finite element analyses (FEA) have been the traditional approaches for evaluating structural integrity. Still, they cannot assess cumulative damage over time due to transient and random dynamic excitations [6]. To address this limitation, fatigue life estimation uses stress-life (S-N) curves and mean-stress correction methods to estimate the lifetime of materials under variable stress [5,7]. The three most traditional theories for predicting the fatigue limit under non-zero mean stresses are those of Goodman, Gerber, and Soderberg [7].
The Soderberg model uses the material yield strength (σy) rather than the ultimate tensile strength (σu), making it the most conservative design limit. This is especially advantageous for ductile constructions prone to failure and where it is vital to avoid any plastic deformation [5,7]. In general, in mechanical and automotive engineering, the most commonly used formulation is the Goodman theory, which assumes a linear relationship between the stress amplitude and the mean stress normalized by the ultimate tensile strength [7,8]. In contrast, the Gerber hypothesis can give less conservative estimates than Goodman’s, but is based on a parabolic relation which is often better correlated with experimental fatigue data for ductile steels at moderate tensile mean stresses [7]. By merging these three notions into the virtual prototypes, designers may define safety margins for a range of operating conditions [8].
Several scholarly publications have addressed the problem of predicting and improving the durability of truck chassis. Classic research in this field focuses mainly on structural optimization under static constraints—Patel and Patel [4] accomplished weight reduction by geometric changes. Rajappan and Vivekanandhan [9] validated that the static safety factors were enough. However, current heavy trucks are operated in very challenging terrains where dynamic fatigue is the major failure mechanism and static safety margins are insufficient [10]. For this reason, researchers have started to include dynamic load-time histories in the fatigue solvers. Abd Rahman et al. [11] showed that the crossbar joints of heavy-duty vehicles are commonly subjected to high stress concentrations that exceed the fatigue limit under varying cargoes, resulting in premature failure.
Recent research has begun using standardized road profiles based on ISO 8608, which describes the road input in terms of a power spectral density (PSD) [10,12], in an effort to replicate realistic road conditions. Van Luong et al. [2] carried out experimental tests to determine the exact axle forces of a multi-purpose forestry vehicle, while Nguyen et al. [3] analyzed the effect of the frequency of these dynamic loads on the life of the chassis structure.
Previous studies have investigated fatigue behavior and fatigue-life estimation of automotive chassis components under different loading conditions [13]. Other research has also addressed crack development and structural failure using numerical approaches [14]. In addition, the durability and fatigue life of multi-axle off-road vehicle chassis under severe terrain conditions have been investigated [15]. These studies demonstrate the importance of considering dynamic loading and fatigue behavior in the structural assessment of automotive chassis.
However, several aspects remain insufficiently addressed. First, although fatigue analyses have been conducted for commercial vehicle chassis and multi-axle off-road vehicles [14,15], the fatigue response of the specific three-axle chassis configuration considered in this study under severe random road excitation requires further investigation. Second, previous studies do not sufficiently quantify the differences in predicted fatigue life and damage obtained from the Goodman, Gerber, and Soderberg mean-stress correction criteria under identical dynamic loading conditions. Third, the combined application of ISO 8608 Class D and Class E random road profiles with a direct comparison of these three fatigue criteria for a three-axle chassis has not been sufficiently investigated.
Accordingly, the novelty of the present study lies in the integrated comparative assessment of a three-axle vehicle chassis subjected to severe random road excitation represented by ISO 8608 Class D and Class E road profiles, using the Goodman, Gerber, and Soderberg fatigue criteria under the same loading and material conditions. This approach enables the influence of the selected fatigue criterion and road roughness level on the predicted fatigue life and fatigue damage of the chassis to be quantitatively evaluated.
Directly addressing these deficiencies, this study conducts a fatigue analysis of a three-axle the chassis subjected to ISO Class D and E road excitations using the Soderberg, Goodman, and Gerber criteria, providing a vital reference for the design of robust specialized heavy equipment.
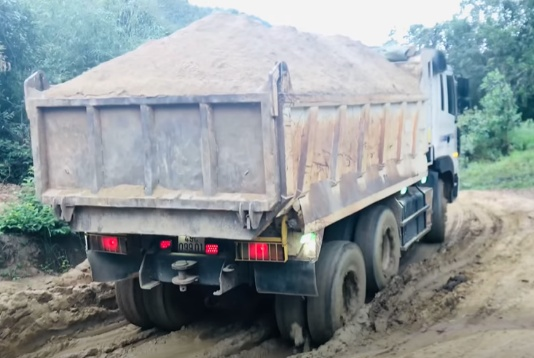
Figure 2 illustrates the fully loaded three-axle truck considered in this study, showing the overall vehicle configuration and the cargo-loading region.
2. Designing a Chassis Model
2.1. Chassis Geometry
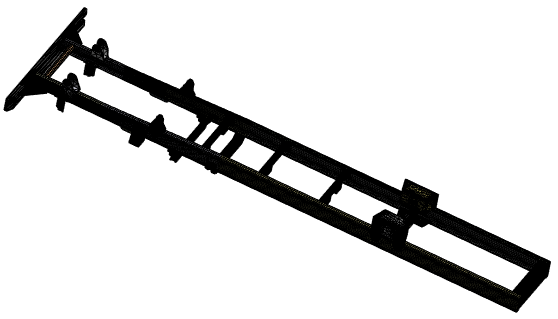
Three-axle truck chassis (Figure 3) is the vehicle’s bearing component. where the engine is installed the transmission system assemblies, the operative part, the control mechanism, the lodge, and the load. Three-axle chassis has a total length of 7280 mm, consisting of 9 horizontal bars and 2 major bars. Each side’s primary bar structure consists of double-channel section chassis, from behind the chassis, the inner main bar is 5540 mm long and the outside main bar is 7130 mm long [16].
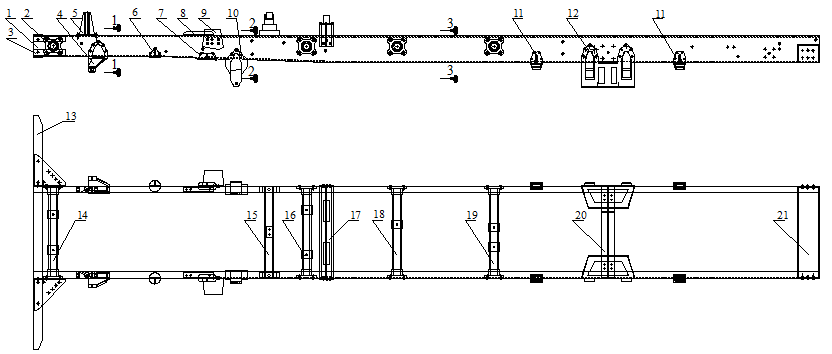
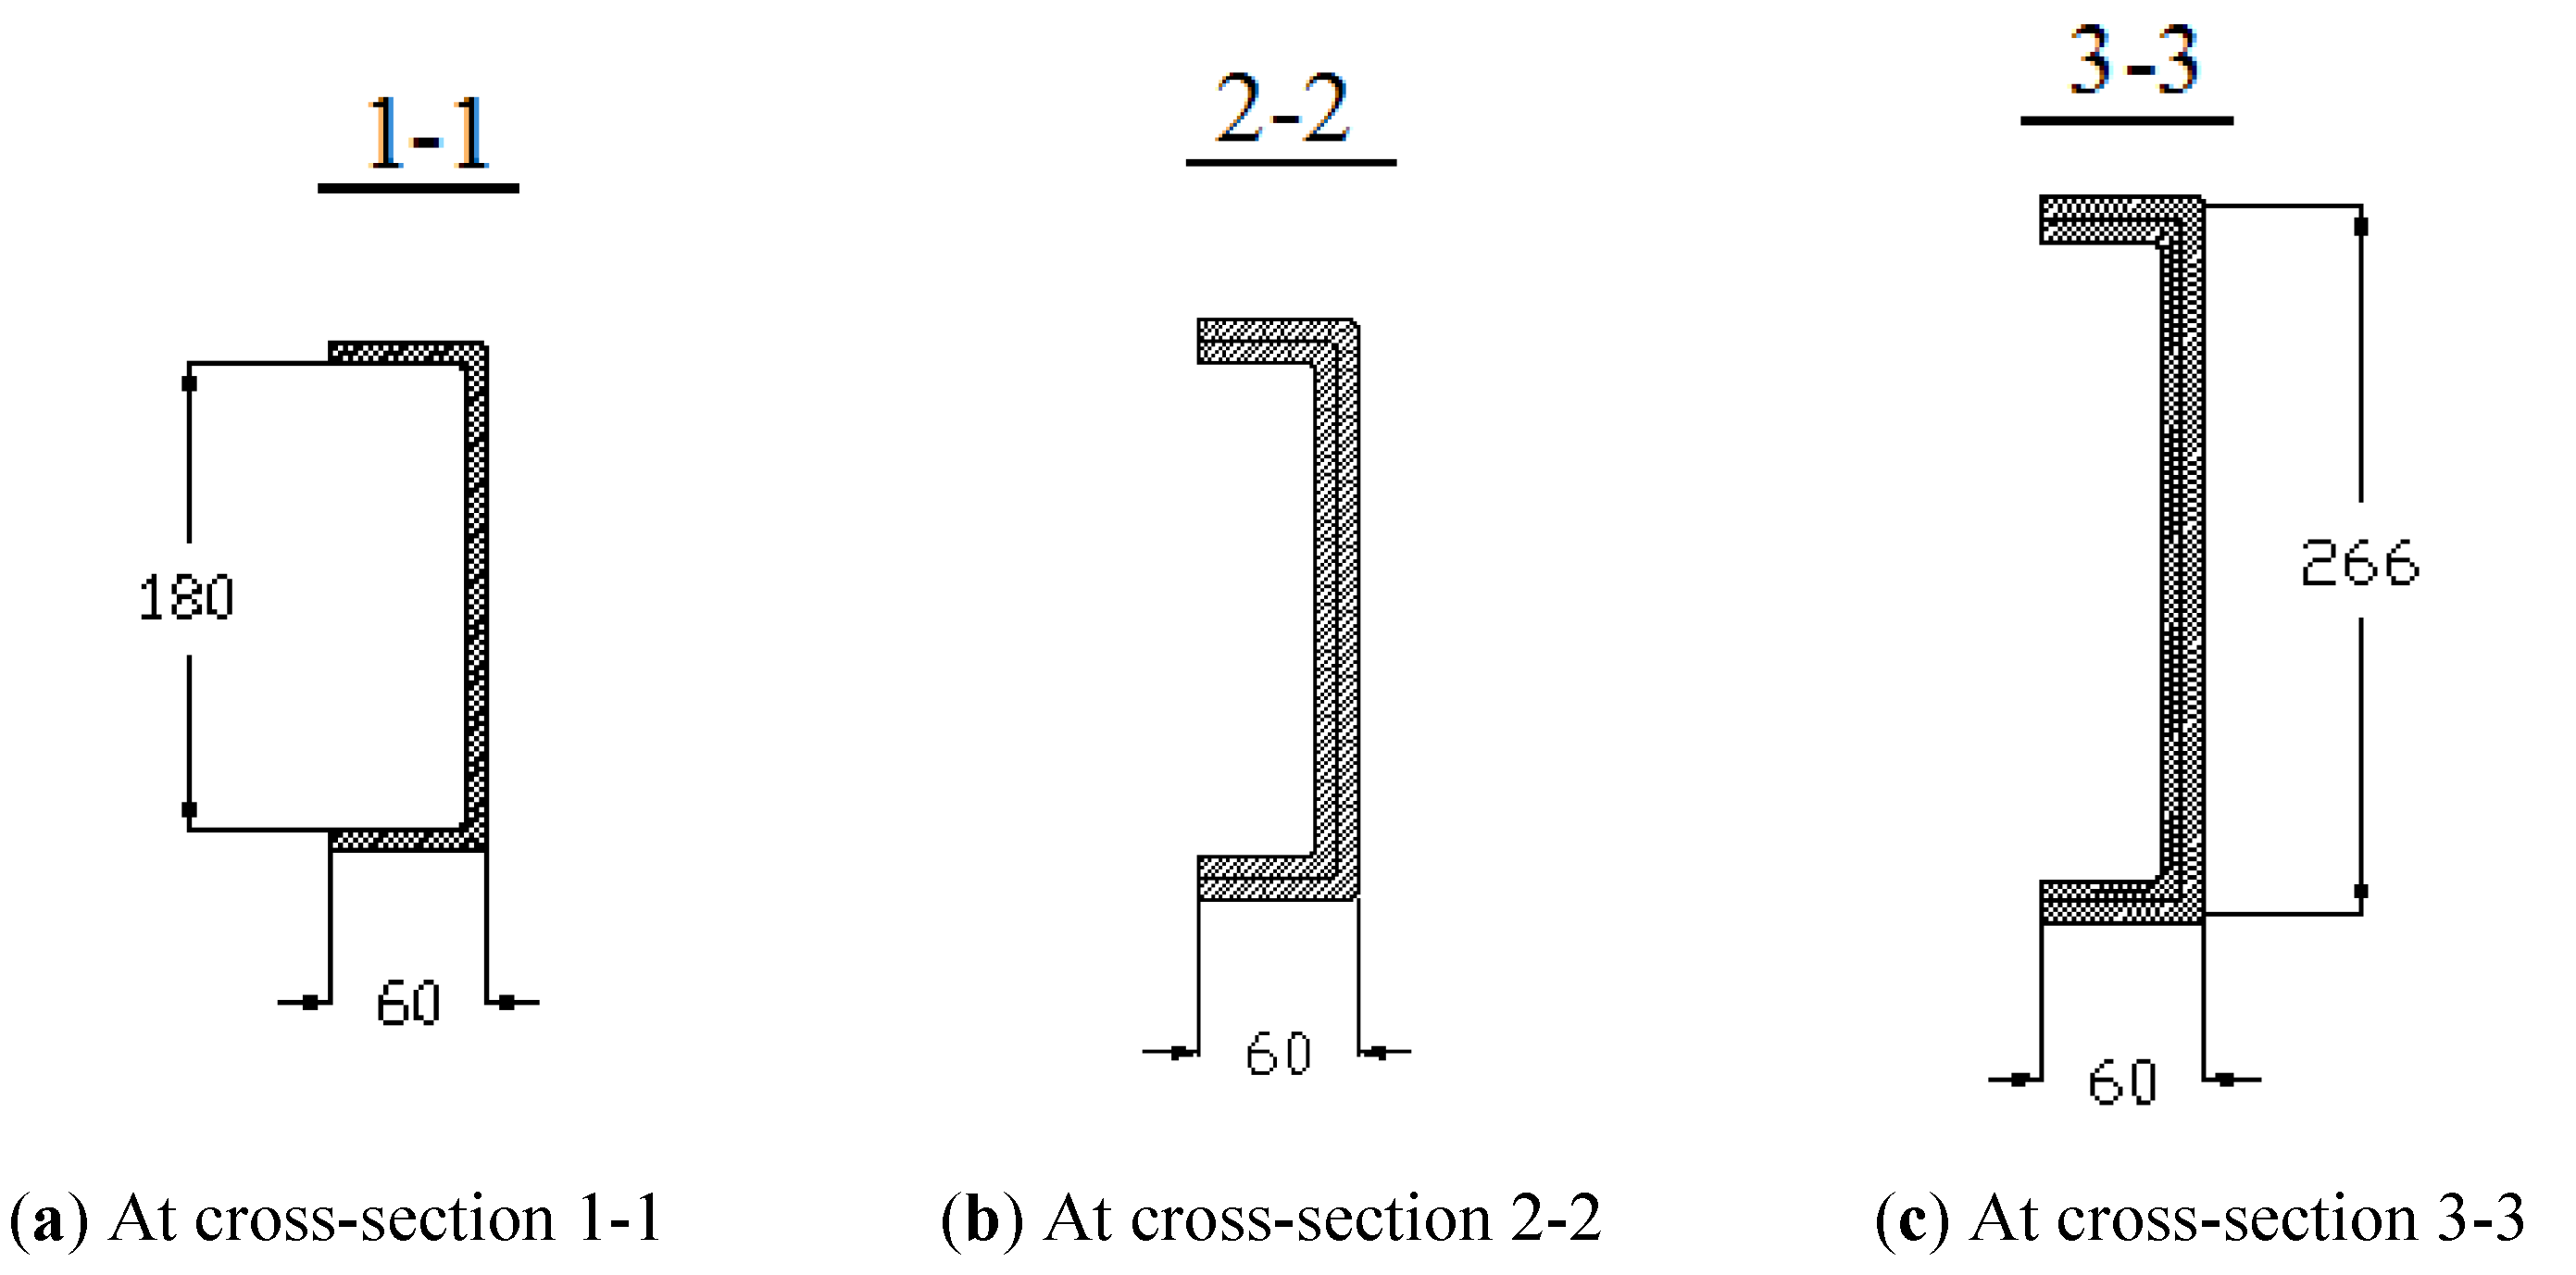
Figure 4 depicts the main bar No. 1’s structure at the cross-sections.
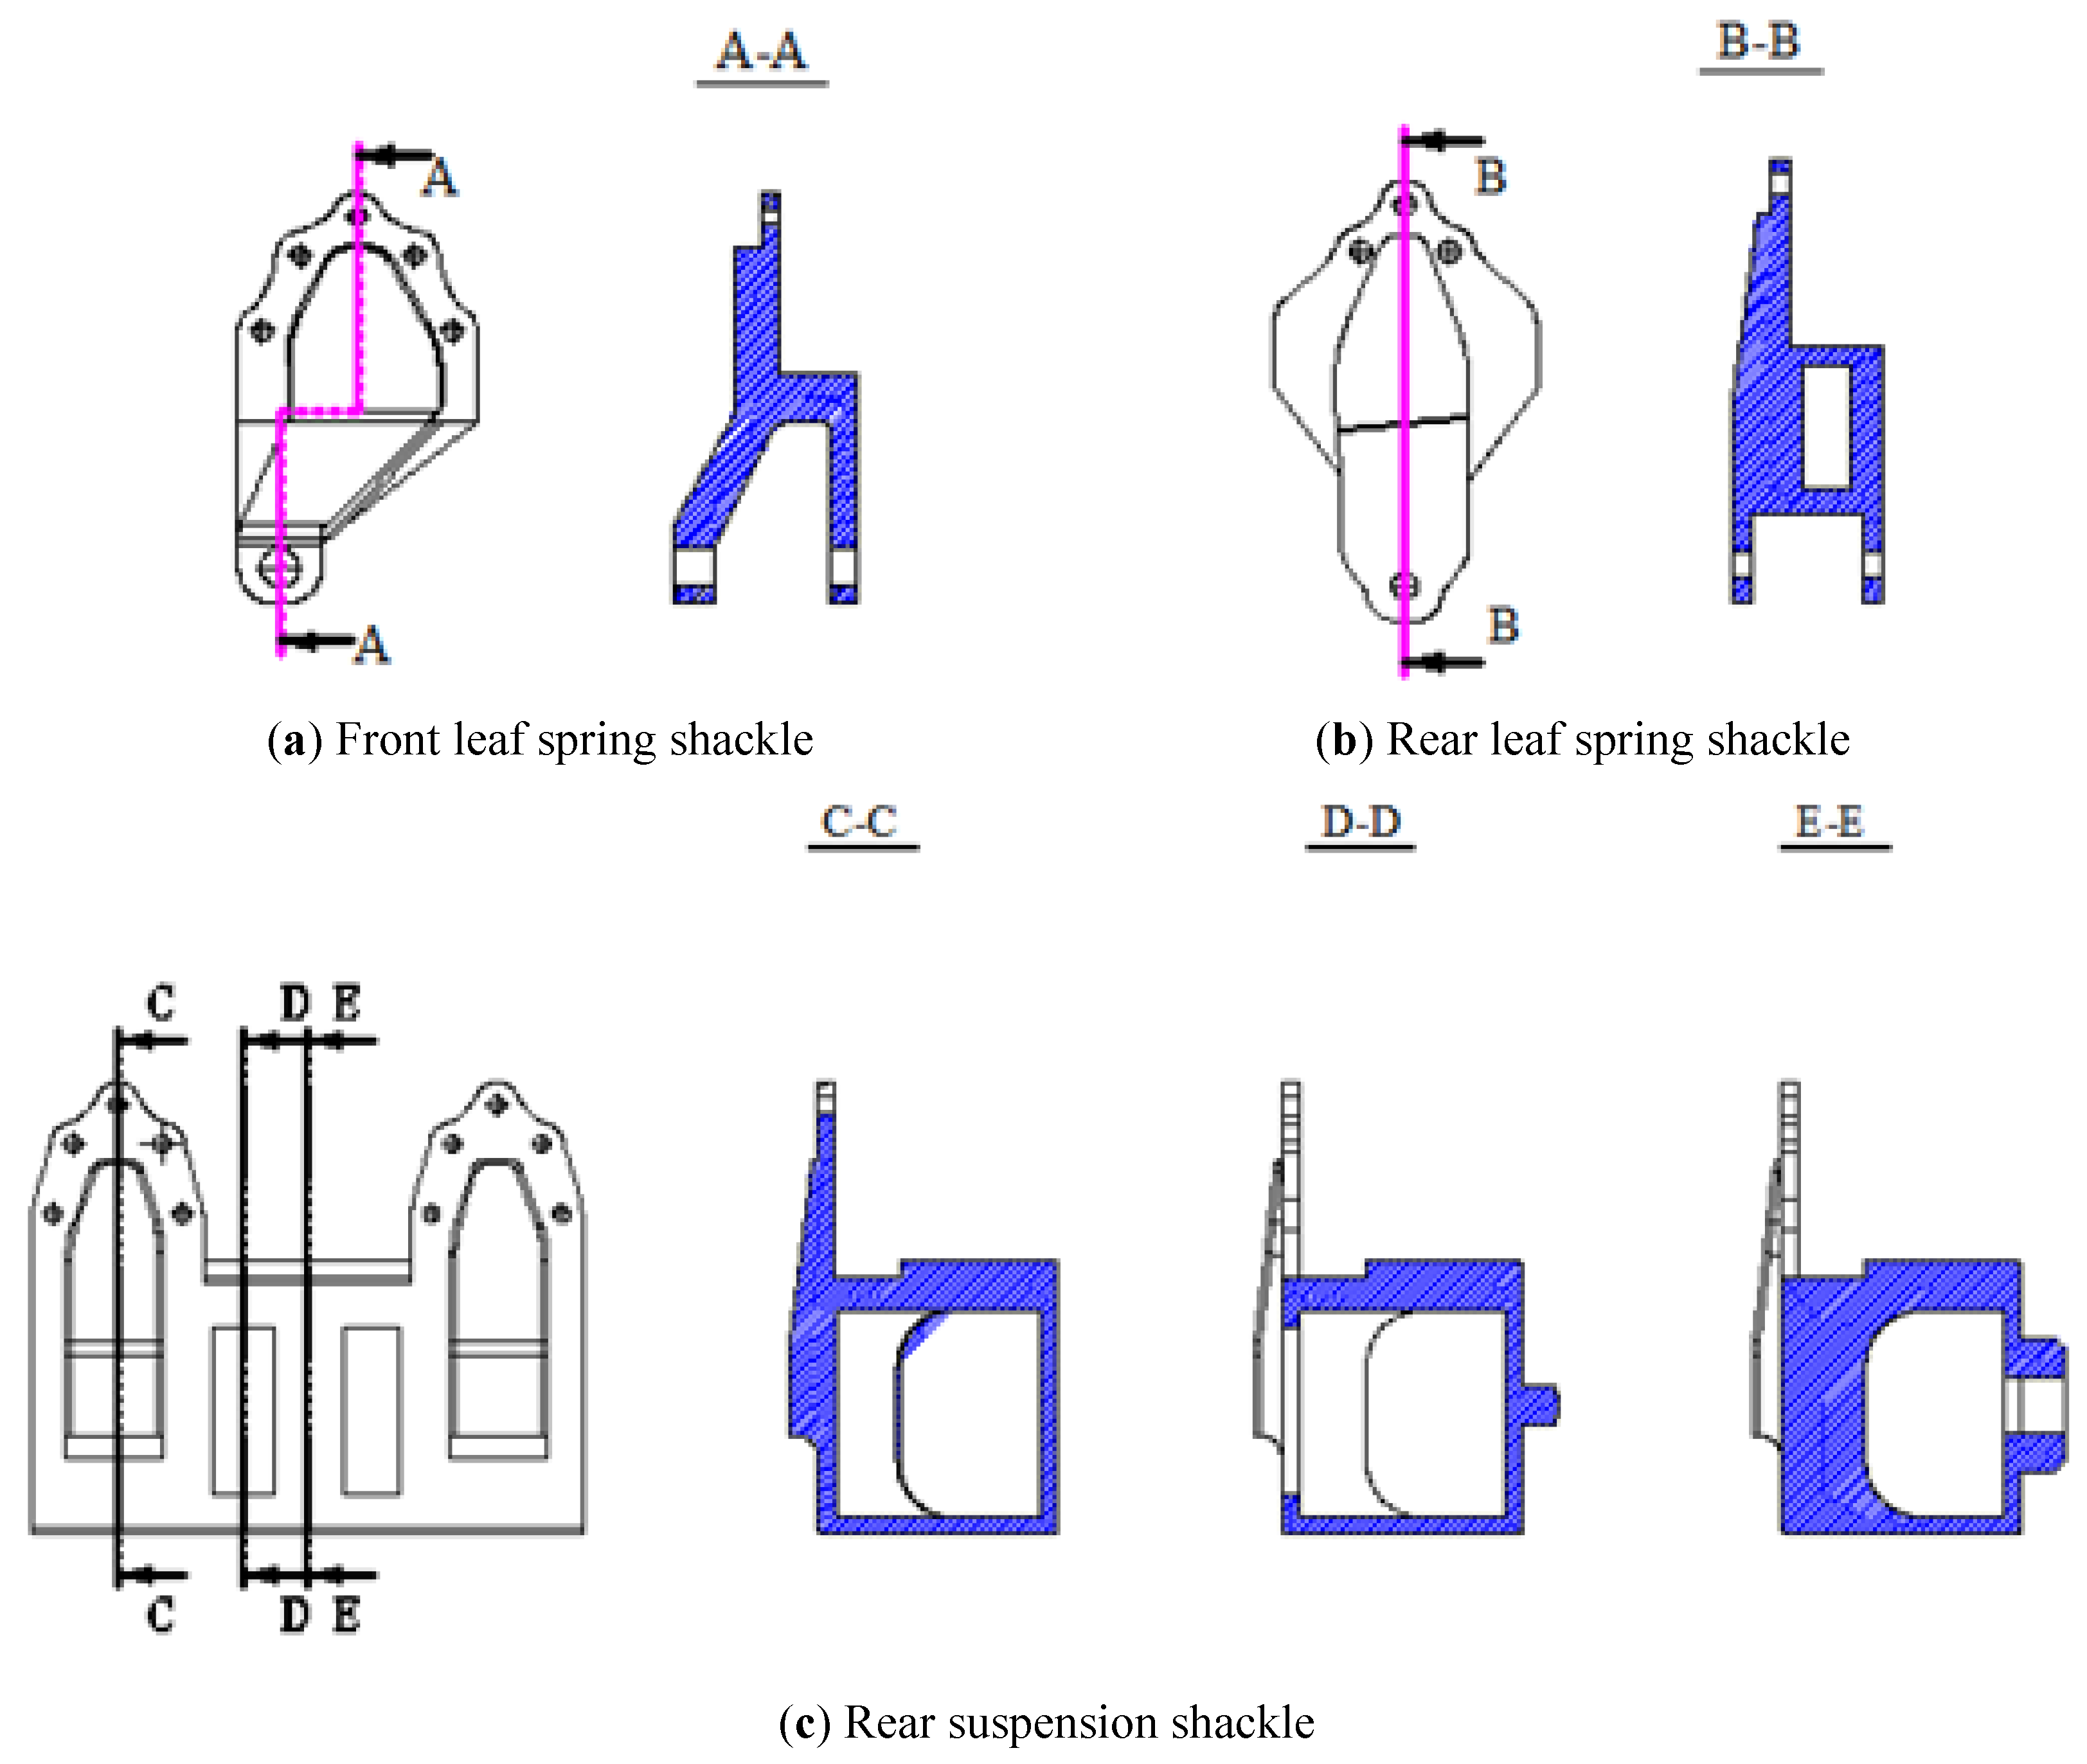
Crossbar 13 is connected to the main frame via components 2 and 3. The front-leaf-spring front shackle (4), (10), and rear-leaf-spring rear shackle (12) connect the vehicle frame to the suspension system. Figure 5 shows their designs.
Details 5 and 8 are mounting points for installing the engine onto the chassis frame, while detail 9 serves as a support for the vehicle cabin.
The cross members 14, 16, 18, and 19 in Figure 3 are used to increase the stiffness of the chassis frame and to provide mounting points for various auxiliary components. These members have a circular tubular cross-section and are connected to the longitudinal beams through flanges bolted to the side walls of the frame rails. Cross member 15 is used to mount the transfer gearbox support. It has a C-shaped cross-section and is connected to the longitudinal beams via C-shaped plates bolted to the frame’s side walls. Cross member 17 in Figure 3 supports the rear part of the cabin and is connected to the longitudinal beams using bolted joints. Cross member 20 in Figure 3 enhances the structural rigidity of the chassis at the mounting location of the rear suspension equalizer axle bracket. It consists of two C-shaped members connected to the main cross member through cover plates and I-shaped brackets. These cover plates and I-shaped brackets are connected to the rear leaf-spring shackle using bolts, while the cover plates are welded to the main member. Cross member 21 in Figure 3, which forms the rear end beam of the chassis. It has a C-shaped cross-section and is connected to the main frame members using rivets.
2.2. Finite Element Model
A mesh convergence study was performed before the final numerical simulations to determine an appropriate finite element discretisation and to ensure that the numerical results were sufficiently independent of the mesh density. Four mesh configurations with progressively refined characteristic element sizes were investigated. The geometry, material properties, boundary conditions, and applied loads were kept identical for all mesh configurations so that the influence of mesh density could be evaluated independently.
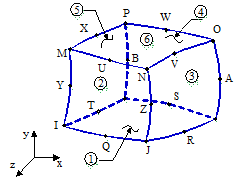
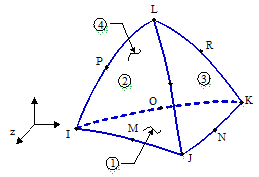
SOLID186 and SOLID187 were selected according to the geometrical characteristics of the chassis components. Both are second-order (quadratic) three-dimensional structural solid elements. SOLID186 is a 20-node structural solid element and was primarily used in regular regions with relatively simple geometries, whereas SOLID187 is a 10-node tetrahedral structural solid element and was employed in geometrically complex regions where tetrahedral discretisation provides greater flexibility for representing irregular and curved features. The combination of the two element types provides a suitable balance between geometric representation, numerical accuracy, and computational efficiency. At the interfaces between the SOLID186 and SOLID187 regions, geometric connectivity was maintained through shared nodes between adjacent elements, ensuring continuous displacement and load transfer across the element-type transition.
The mesh convergence was evaluated using the maximum von Mises stress and the maximum total deformation obtained from the static structural analysis. The relative variation between two consecutive mesh configurations was calculated as
Table 1 presents the results obtained during the mesh verification process. As the mesh was progressively refined, the calculated stress and deformation approached stable values. The final mesh was selected when the variation of the principal response between two consecutive mesh configurations satisfied the adopted 5% criterion while maintaining a reasonable computational cost. The final model consisted of 174,223 elements and 376,982 nodes (Figure 6).
Mesh convergence study.
| Element Size (mm) | Elements | Nodes | Max. von Mises Stress (MPa) | Max. Deformation (mm) | Variation (%) |
|---|---|---|---|---|---|
| 25 | 83616 | 199743 | 391.27 | 5.472 | - |
| 20 | 96221 | 230301 | 387.94 | 5.418 | 0.85 |
| 15 | 129235 | 310836 | 375.28 | 5.231 | 3.26 |
| 10 | 174223 | 376982 | 382.39 | 5.325 | 1.89 |
All mesh refinement steps resulted in a variation of less than 5% in the maximum von Mises stress. For the final refinement from a 15 mm to a 10 mm element size, the variation was only 1.89%, indicating that the numerical results had reached satisfactory mesh convergence. Therefore, the 10 mm mesh was selected for the subsequent numerical analysis, with 174,223 elements and 376,982 nodes. The corresponding maximum von Mises stress and maximum deformation were 382.39 MPa and 5.325 mm, respectively.
The study used the combination of element models SOLID186 (Figure 7) and SOLID187 (Figure 8). In complex locations, angled corners use the SOLID187 element model for better geometric accuracy. The SOLID186 element model for straight bars is used to speed up computation. The mesh parameters of the three-axle truck chassis, including the number of elements, nodes, and mesh quality indicators, are summarized in Table 2. The mechanical properties of 40Cr steel used for the chassis, including density, elastic modulus, Poisson’s ratio, yield strength, and ultimate tensile strength, are presented in Table 3.
Mesh parameters of three-axle truck.
| Evaluation Criteria | Value |
|---|---|
| Elements | 174,223 |
| Nodes | 376,982 |
| Element Quality | 0.72 |
| Orthogonal Quality | 0.71 |
| Skewness | 0.42 |
| Aspect ratio | 2.65 |
| Jacobian ratio | 0.89 |
Material Property of 40Cr Steel.
| Parameter | Unit | Value |
|---|---|---|
| Density | kg/m3 | 7850 |
| Elastic Modulus | GPa | 205 |
| Poisson’s Ratio | 0.29 | |
| Yield Strength | MPa | 785 |
| Ultimate Tensile Strength | MPa | 980 |
Research by Teo Han Fui [17] and Monika S. Agrawal [18] has proposed a method for static strength testing of truck frames and a corresponding approach for defining boundary conditions. The leaf spring mounts serve to constrain frame displacement in the three translational directions (x, y, z) and rotational directions; therefore, fixed supports are applied at these mounting locations. In the present finite element model, the suspension mounting locations were simplified as fixed constraints rather than explicitly modeling the suspension components and their stiffness characteristics. Thus, the translational and rotational degrees of freedom at these mounting locations were constrained.
We reduce the forces acting on the vehicle frame to specific locations based on the respective force groups. In reality, the frame is subjected to numerous forces acting in complex longitudinal and transverse directions; for the sake of simplicity, we categorize them into the following primary groups of forces:
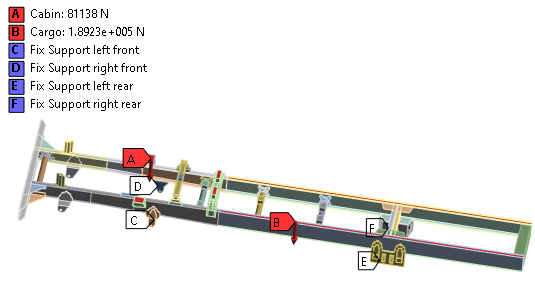
Cabin assembly: Comprising the engine, transmission, and cabin, this unit exerts a vertical load on the chassis evenly distributed across both sides with a weight of 81,138 N (Figure 9).
Cargo unit: The total mass of the cargo box and its mounted components; when fully loaded, this assembly exerts force on the entire rear section of the vehicle body. The weight of the cargo box is evenly distributed across the surfaces of the rear frame rails on both sides, with a load value of 189,323 N (Figure 9).
3. Results and Discussion
3.1. Static Structural Analysis
Before the dynamic and fatigue assessments, the structural integrity and load-bearing capacity of the three-axle truck chassis were evaluated under maximum static loads using ANSYS static structural analysis. The present analysis aims to determine the critical stress distribution, stress concentration zones, and the maximum deformation of the chassis structure. The resulting static stress levels provide a fundamental baseline for assessing whether the structural material remains within its allowable yield limits and are a necessary input for subsequent modal and dynamic fatigue evaluations.
Figure 10 illustrates the deformation of the chassis under maximum static load. Analysis shows that the maximum deformation reaches 5.325 mm at the rear of the vehicle due to deflection under the maximum load. This deformation is relatively small compared to the overall length of the 3-axle chassis, ensuring static rigidity.
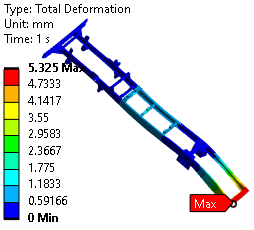
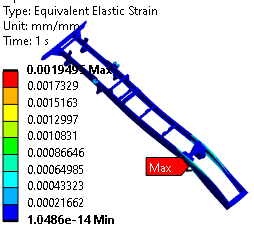
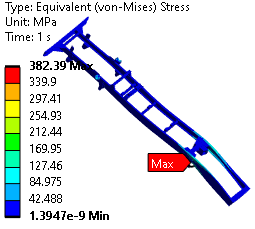
Figure 11 and Figure 12 illustrate the strain and stress of the chassis under maximum static load. Analysis results show that the maximum von Mises stress is 382.39 MPa and the maximum elastic strain is 0.001949 mm/mm at the rear suspension mounting area, which is the weakest point in the vehicle’s chassis structure. The concentration of stress at the rear suspension mounting region can be physically attributed to the load-transfer characteristics of the chassis. The suspension mounting points provide the main load-transfer path between the road-induced axle forces and the longitudinal frame members. Consequently, these regions simultaneously experience vertical reaction forces, local bending, and torsional effects generated by the uneven distribution of loads between the axle and the two longitudinal members. In addition, the presence of suspension hangers, cross-member connections, bolted joints, and changes in local cross-sectional geometry introduces local stiffness discontinuities. These geometric and load-path discontinuities promote stress concentration and make the rear suspension mounting region more critical than the relatively uniform portions of the longitudinal members. This interpretation is consistent with previous numerical studies of truck chassis structures, which have reported that stress concentrations commonly occur near suspension mounting and cross-member connection regions [9,11,15].
The maximum deformation, equivalent elastic strain, and von Mises stress of the chassis under maximum static loading are summarized in Table 4.
Maximum deformation, strain, and stress on the chassis under maximum static load.
| Deformation (mm) | Strain (mm/mm) | Stress (MPa) | |
|---|---|---|---|
| Max | 5.325 | 0.001949 | 382.39 |
3.2. Modal Analysis of the Chassis
Modal analysis was performed using the finite element model developed in ANSYS Mechanical to determine the natural frequencies and corresponding mode shapes of the three-axle truck chassis. The modal characteristics were obtained by solving the undamped eigenvalue problem expressed as [16,17,18]:
The same structural constraints as those used in the static structural analysis were retained for the modal analysis, with the leaf-spring mounting locations constrained to represent the chassis–suspension connections.
The structural mass of the chassis was determined from the finite element model using the density of the 40 Cr material, with ρ = 7850 kg/m3. An undamped modal analysis was performed; therefore, damping was not included in the eigenvalue extraction. The extracted eigenvectors were normalized according to the modal normalization procedure used in ANSYS. Therefore, the deformation values displayed for the individual modes represent normalized relative modal amplitudes for visualization of the corresponding mode shapes and should not be interpreted as actual physical displacement amplitudes under operational loading. The modal results are therefore used to identify the natural frequencies and compare the relative deformation patterns of the different vibration modes.
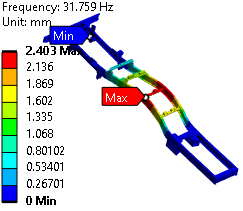
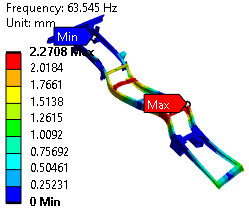
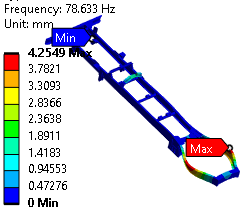
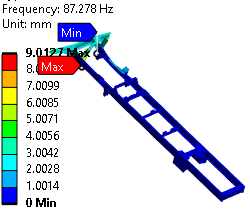
Table 5 provides the results of the analysis of the mode of vibration and mode of the chassis’s vibration by Ansys software.
The form and frequency of individual vibration of chassis.
| Mode | Frequency (Hz) | Deformation (mm) | Mode | Frequency (Hz) | Deformation (mm) |
|---|---|---|---|---|---|
| 1 | 17.882 | 3.4786 | 6 | 63.545 | 2.2708 |
| 2 | 31.759 | 2.403 | 7 | 64.404 | 4.5384 |
| 3 | 54.209 | 4.0859 | 8 | 78.633 | 4.2549 |
| 4 | 58.849 | 11.061 | 9 | 80.149 | 9.4568 |
| 5 | 62.387 | 12.788 | 10 | 87.278 | 9.0127 |
The first natural frequency is 17.882 Hz, with a maximum modal displacement of 3.4786 mm. At mode 2 (31.759 Hz, Figure 13), the structure predominantly exhibits a combination of global bending and torsional distortion, yielding a localized relative deformation of 2.4030 mm. Between Modes 3 and 7 (54.209Hz to 64.404 Hz), the modes form complex coupled bending-torsion modes. This is evident from large modal displacements of 11.0610 mm and 12.7880 mm for Modes 4 (58.849 Hz) and 5 (62.387 Hz), respectively. This indicates higher structural vulnerability to dynamic excitation in this mid-frequency range. Mode 6 (63.545 Hz, Figure 14) is a localized bending mode with a relative deformation of 2.2708 mm. At higher frequencies (Modes 8–10, ranging from 78.633 Hz to 87.278 Hz), local structural resonances become predominant. The largest relative displacements are localized at the rear crossmembers and front chassis overhangs, reaching up to 9.0127 mm as shown in Figure 15 (Mode 8, 78.633 Hz) and Figure 16 (Mode 10, 87.278 Hz). The modal results further support the identification of these regions as structurally important. The coupled bending and torsional modes observed in the intermediate-frequency range indicate that the chassis does not deform purely in global bending; instead, local structural regions near the cross-members and suspension interfaces participate significantly in the vibration response. In particular, the rear cross-member and suspension-support regions are subjected to repeated relative deformation under dynamic excitation. Therefore, these regions are more susceptible to cyclic stress accumulation than regions undergoing mainly rigid-body-like motion. This provides a physical link between the modal response and the subsequent fatigue results under random road excitation.
3.3. Access the Fatigue Strength of Chassis
The dynamic load values placed on the chassis are taken based on the moving vehicle model [19]. In this study, the fatigue strength of the chassis is investigated when vehicles are moving on D and E roads based on ISO 8608:2016 [12].
3.3.1. Fatigue Criteria
In this study, the fatigue strength of the three-axle chassis is evaluated using the Goodman, Gerber, and Soderberg mean-stress correction criteria. These criteria are used to account for the effect of mean stress on the fatigue strength of the chassis under cyclic loading. The alternating stress and mean stress are calculated from the maximum and minimum stresses as follows [16]:
Figure 17 shows the isolife curves at the fatigue limit according to 3 criteria. The values of the 3 criteria are determined as follows [16,20]:
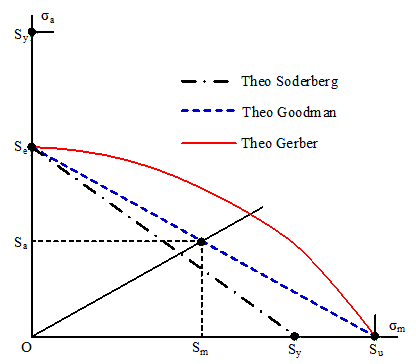
The top three lines represent the fatigue strength limit, and they all share the same features: the fatigue failure zone lies to the right of the limit line after a specific number of impact cycles, and the safe zone lies to the left of the limit line (no fatigue failure). Any point on these lines represents the limiting values of stress, where Sa is the limit value of σa, and Sm is the limit value of σm.
Assuming that n is a safety factor, we have Sa = n.σa and Sm = n.σm. The conditions are expressed as follows [16]:
3.3.2. Road Model according to ISO 8608:2016
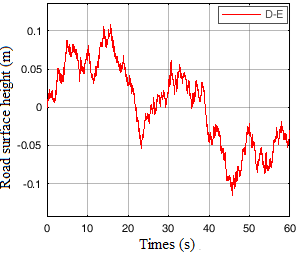
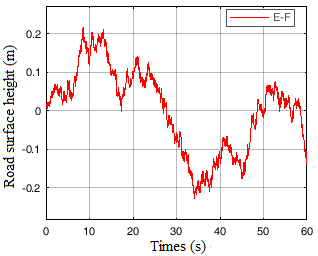
ISO 8608:2016 [12] is the most commonly used pavement standards in automobile dynamics calculations. This standard distinguishes the linearly according to the density of the energy spectrum (PSD) and divides them into 8 categories with conventional symbols A through H. In this study, two types of roads according to ISO 8608:2016 have been tested, including D (bad) and E (very bad) curves, which were tested. These are also the actual types of roads that small trucks regularly operate. Road bumpers are placed evenly on 2 wheel tracks. Figure 18 and Figure 19 show the road surface profile over a length of 250 m. The vehicle is moving straight an evaluation speed of 20 km/h, additionally, this is the speed at which the car typically travels on the road.
3.3.3. Assess Fatigue Strength When Vehicles Are Moving on the D Road
Figure 20, Figure 21 and Figure 22 describe the total amount of fatigue life that appear within the chassis as the vehicle travels along the D road according to Goodman, Gerber, Soderberg standards, the findings indicate that the maximum fatigue life according to the three criteria above are all 106 cycles, minimum fatigue life under standard Goodman and Soderberg is 8338.5 standard cycle, the fewest cycle count of tiredness under standard Gerber is 8290.4, the damaged chassis due to fatigue is about 2074 km. Figure 23, Figure 24 and Figure 25 describe the fatigue damage appearing on the chassis when the car moves on the D road according to Goodman, Gerber, Soderberg standards, the results show that the smallest fatigue damages according to the above three standards is equal to 1000, the largest fatigue damages according to Goodman standard and Soderberg standard is 1.1993 × 10⁵, the largest fatigue damages according to Gerber standard is 1.2062 × 10⁵.
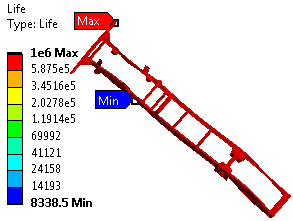
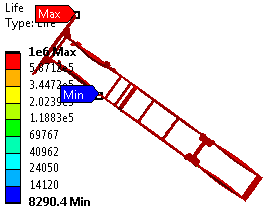
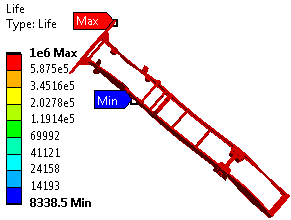
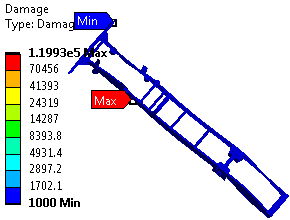
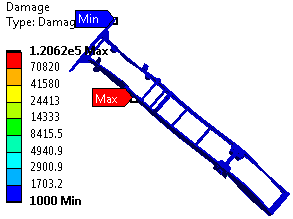
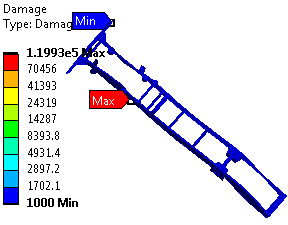
Table 6 shows results obtained from Fatigue analysis D road in three fatigue theories, the results of the minimum number of fatigue life, and the maximum fatigue damage to Goodman and Soderberg standards are the same. The smallest number of fatigue life of Gerber standard is smaller than that of Goodman standard, the largest fatigue damage to Gerber standard is larger than Goodman standard.
Results for Fatigue analysis D road.
| Theory | Fatigue Life | Fatigue Damage | ||
|---|---|---|---|---|
| Max | Min | Max | Min | |
| Goodman | 106 | 8338.5 | 1.1993 × 10⁵ | 1000 |
| Gerber | 106 | 8290.4 | 1.2062 × 10⁵ | 1000 |
| Soderberg | 106 | 8338.5 | 1.1993 × 10⁵ | 1000 |
3.3.4. Assess Fatigue Strength When Vehicles are Moving on the E Road
As the automobile travels along the E road, the dynamic load acting the chassis has larger than as it travels along the D road, in this study also determines the number of cycles and fatigue damage as in the case of the automobile traveling through D road. The findings (see Figure 26, Figure 27, Figure 28, Figure 29, Figure 30 and Figure 31) indicate that the maximum fatigue life according to the above three standards is equal to 106 cycles, the minimum number of fatigue life according to Goodman standard and Soderberg standard is 6349.9 cycles, the smallest amount of fatigue life as Gerber standard is 6306.2, the damaged chassis due to fatigue is about 1557 km. The smallest fatigue damages according to the above three standards is equal to 1000, the largest fatigue damages according to Goodman standard and Soderberg standard is 1.5748 × 10⁵, the largest fatigue damages according to Gerber standard is 1.5857 × 10⁵.
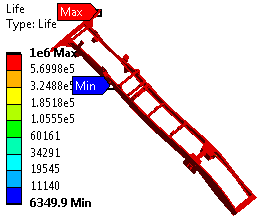
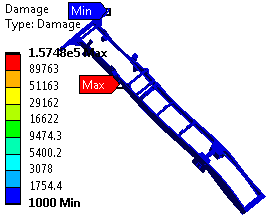
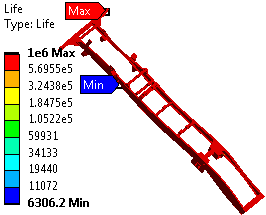
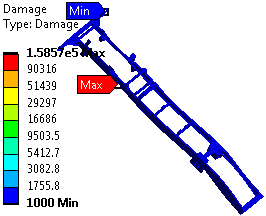
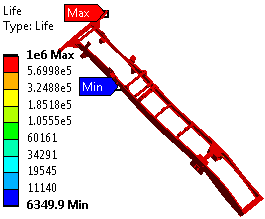
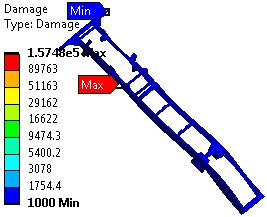
Table 7 shows results obtained fatigue analysis E road in three fatigue theories, if the automobile keeps moving on the E road, the amount of damage is greater, the smallest number of endurance cycles is smaller than if the vehicle is traveling while on the D road.
Results for Fatigue analysis E road.
| Theory | Fatigue Life | Fatigue Damage | ||
|---|---|---|---|---|
| Max | Min | Max | Min | |
| Goodman | 106 | 6349.9 | 1.5748 × 10⁵ | 1000 |
| Gerber | 106 | 6306.2 | 1.5857 × 10⁵ | 1000 |
| Soderberg | 106 | 6349.9 | 1.5748 × 10⁵ | 1000 |
Overall, the results indicate that road roughness has a stronger influence on the predicted fatigue life than the selection among the three mean-stress correction criteria for the present chassis and loading conditions. Increasing the road class from D to E reduces the minimum fatigue life from 8338.5 to 6349.9 cycles for the Goodman and Soderberg criteria, corresponding to a reduction of approximately 23.8%. A similar reduction is obtained with the Gerber criterion. This behavior is physically reasonable because the Class E profile generates more severe dynamic excitation and consequently larger cyclic stresses in the chassis. In contrast, the differences among Goodman, Gerber, and Soderberg remain below 1% for the minimum predicted fatigue life. Therefore, for the present stress state, the road-induced dynamic loading is the dominant factor governing the fatigue-life prediction, whereas the choice of mean-stress correction criterion has a comparatively minor effect.
4. Conclusions
There is a need for fatigue analysis of a three-axle chassis, in light of chassis breakdown brought on by repeated exposure to heavy loads. In this paper, using the modeling program Solidworks, a three-axle chassis model is produced, FEA are used to conduct the analysis, under various load situations D and E road Goodman, Gerber, and Soderberg are three authors with various theories regarding fatigue. Using the findings from the analysis, the following claims are made:
-
The minimum fatigue life for vehicle traveling on the D road according to Goodman and Soderberg standards is the same 8338.5 cycles, Gerber standard is 8290.4 cycles. The biggest damage, according to Goodman and Soderberg standards is the same 1.1993 × 10⁵, the Gerber standard is 1.2062 × 10⁵.
-
Vehicles moving on E road, the smallest number of fatigue life according to Goodman and Soderberg standards is the same 6349.9 cycles, Gerber standard is 6306.2 cycles, minimum fatigue lifeis smaller than the minimum number of fatigue life on the D road, this represents the rule. The biggest damage according to Goodman and Soderberg standards is the same 1.5748 × 10⁵, Gerber standard is 1.5857 × 10⁵.
-
The results show that when the vehicle is moving on D or E, the minimum number of fatigue life is less than 106.
The stress distribution indicates that the rear suspension mounting region is the most critical structural area because it represents a major load-transfer path between the suspension system and the longitudinal chassis members and contains local geometric and connection discontinuities. The fatigue analysis further demonstrates that the severity of the road excitation has a more pronounced influence on the predicted fatigue life than the choice of the Goodman, Gerber, or Soderberg criterion under the present loading conditions.
Future research will focus on experimental validation of the numerical model using measured strains, stresses, and natural frequencies under representative operating conditions.
Nomenclature
| Symbol/Abbreviation | Definition | Unit |
|---|---|---|
| E | Elastic (Young’s) modulus | GPa |
| ν | Poisson’s ratio | – |
| ρ | Material density | kg/m³ |
| σy | Yield strength | MPa |
| σu | Ultimate tensile strength | MPa |
| σa | Stress amplitude | MPa |
| σm | Mean stress | MPa |
| Sa | Fatigue strength amplitude | MPa |
| Sm | Mean stress corresponding to the fatigue limit | MPa |
| Se | Endurance limit | MPa |
| n | Safety factor | – |
| N | Number of fatigue cycles / fatigue life | cycles |
| D | Fatigue damage | – |
| v | Vehicle speed | km/h |
| f | Frequency | Hz |
| Gq(n) | Road surface elevation power spectral density | m³ |
| nr | Spatial frequency of the road profile | cycles/m |
| PSD | Power Spectral Density | – |
| FEM | Finite Element Method | – |
| FEA | Finite Element Analysis | – |
| ANSYS | Engineering simulation and finite element analysis software | – |
| ISO | International Organization for Standardization | – |
| S–N | Stress–life relationship/curve | – |
| 40Cr | Chromium-containing structural alloy steel designation | – |
| D | ISO 8608 Class D road profile | – |
| E | ISO 8608 Class E road profile | – |
| x, y, z | Global coordinate directions | – |
| Re | Yield strength | MPa |
| Rm | Ultimate tensile strength | MPa |
Author Contributions
D.N.Q. and A.N.H.: conceptualization, methodology, software; D.N.Q.: data curation, writing—original draft preparation; A.N.H.: visualization, investigation; D.P.L.X.: supervision; A.N.H.: software, validation; D.N.Q and D.P.L.X.: writing—reviewing and editing. All authors have read and agreed to the published version of the manuscript.
Funding
This research received no external funding.
Institutional Review Board Statement
Not applicable.
Informed Consent Statement
Not applicable.
Data Availability Statement
Not applicable.
Conflicts of Interest
The authors declare no conflict of interest.
Use of AI and AI-Assisted Technologies
No AI tools were utilized for this paper.
References
- 1.
Patil, H.B.; Kachave, S.D.; Deore, E.R. Stress Analysis of Automotive Chassis with Various Thicknesses. IOSR J. Mech. Civ. Eng. 2013, 6, 44–49. https://doi.org/10.9790/1684-0614449.
- 2.
Van Luong, V.; Quang Nguyen, T.; Quan Le, H.; Anh Le, V.; Hoa Tran, P.; Nguyen, X.H.; Tran Van, T. Determination of Dynamic Loads from the Road Surface Acting on the Chassis by Experimental Methods. IOP Conf. Ser. Mater. Sci. Eng. 2020, 886, 012008. https://doi.org/10.1088/1757-899x/886/1/012008.
- 3.
Nguyen, X.H.; Van Luong, V.; Quang Nguyen, T.; Tran Van, T. Assessment on Effect of Load Frequency to Durability of Chassis of the Multi-Purpose Forest Fire Fighting Vehicle. IOP Conf. Ser. Mater. Sci. Eng. 2020, 886, 012007. https://doi.org/10.1088/1757-899x/886/1/012007.
- 4.
Vijaykumar, P.; Patel, R.I. Structural Analysis of Automotive Chassis Frame and Design Modification for Weight Reduction. Int. J. Eng. Res. Technol. 2012, 1, 1–6.
- 5.
Salvati, E. Evaluating fatigue onset in metallic materials: Problem, current focus and future perspectives. Int. J. Fatigue 2024, 188, 108487. https://doi.org/10.1016/j.ijfatigue.2024.108487.
- 6.
Chen, J.S.; Hwang, H.Y. All Terrain Vehicle Flexible Multibody Dynamic Simulation for Fatigue Prediction. Adv. Mech. Eng. 2013, 5, 725315. https://doi.org/10.1155/2013/725315.
- 7.
Dowling, N. Mechanical Behavior of Materials: Engineering Methods for Deformation, Fracture, and Fatigue; Pearson Prentice Hall: Upper Saddle River, NJ, USA, 2012.
- 8.
Mi, C.; Gu, Z.; Yang, Q.; Nie, D. Frame fatigue life assessment of a mining dump truck based on finite element method and multibody dynamic analysis. Eng. Fail. Anal. 2012, 23, 18–26. https://doi.org/10.1016/j.engfailanal.2012.01.014.
- 9.
Rajappan, R.; Vivekanandhan, M. Static and Modal Analysis of Chassis by Using FEA. Int. J. Eng. Sci. 2013, 2, 63–73.
- 10.
Ghodake, A.P.; Patil, S.J. Fatigue Life Prediction of Automotive Chassis Frame: A Review. Int. J. Eng. Res. Technol. 2018, 7, 112–118.
- 11.
Abd Rahman, R.; Tamin, M.N.; Ojo, K. Stress Analysis of Heavy Duty Truck Chassis as a Preliminary Data for its Fatigue Life Prediction using FEM. J. Mek. 2008, 26, 76–85.
- 12.
ISO 8608:2016; Mechanical Vibration—Road Surface Profiles—Reporting of Measured Data. International Organization for Standardization: Geneva, Switzerland, 2016.
- 13.
Najafiyan, M.; Zabihola, B.; Rabiee, R.; Mohammadi, H.D.; Ghasemi, A. Analysis of Dynamic Crack Development and Crack Surface Connection in Single Region Boundary Element Method. World Appl. Sci. J. 2013, 27, 288–292.
- 14.
Shivakumar, M.M.; Nirmala, L. Fatigue Life Estimation of Chassis Frame FESM Bracket for Commercial Vehicle. Int. J. Sci. Res. 2014, 3, 441–447.
- 15.
Zhang, Y.; Chen, L. Durability Analysis and Fatigue Life Estimation of Multi-Axle Off-Road Vehicle Chassis under Severe Terrain Conditions. J. Terramech. 2022, 102, 45–58.
- 16.
Van Van, L.; Phi, C.H.; Quang, N.T. Application of air suspension system to improve the durability of chassis of multi-purpose forest fire fighting vehicle. Int. J. Interact. Des. Manuf. 2024, 18, 3725–3738. https://doi.org/10.1007/s12008-023-01666-1.
- 17.
Teo, H.F.; Abd Rahman, R. Statics and dynamics structural analysis of a 4.5 ton truck chassis. J. Mek. 2007, 24, 56–67.
- 18.
Agrawal, M.S. Finite Element Analysis of Truck Chassis Frame. Int. Res. J. Eng. Technol. 2015, 2, 1949–1956.
- 19.
Hoang, A.N.; Qui, D.N. Evaluating the impact of tyre stiffness on dynamic load in three-wheel vehicles. Proc. Inst. Mech. Eng. Part D J. Automob. Eng. 2026, 240, 5869–5883. https://doi.org/10.1177/09544070251377840.
- 20.
Atig, A.; Ben Sghaier, R.; Seddik, R.; Fathallah, R. Reliability-based high cycle fatigue design approach of parabolic leaf spring. Proc. Inst. Mech. Eng. Part L J. Mater. Des. Appl. 2019, 233, 588–602. https://doi.org/10.1177/1464420716680499.

This work is licensed under a Creative Commons Attribution 4.0 International License.