- Open Access
- Article
Enhancing Myocardial Infarction Prediction in Type 2 Diabetes: A Novel Model for Diagnostic and Targeted Treatment
- Yanwei Zhang 1,†,
- Yanqing Zhang 2,†,
- Yun Liu 3,
- Kun Xu 4,
- Yanhong Liu 2,
- Wenqian Ye 5,
- Jianli Zhao 6,
- Yajing Wang 6,*
Author Information
Received: 29 Oct 2024 | Revised: 02 Dec 2024 | Accepted: 02 Dec 2024 | Published: 15 Dec 2025
Abstract
1.Introduction
Type 2 diabetes mellitus (T2DM) poses significant public health challenges globally, particularly due to its association with serious complications such as myocardial infarction (MI), which stands as one of the leading causes of mortality among T2DM patients [1]. This stark reality highlights the critical need for early identification and assessment of MI risk factors in T2DM management. Proactively identifying high-risk patients and implementing timely interventions becomes paramount to mitigating the risk of coronary events and enhancing patient outcomes.
The emergence of the post-genome era, along with the concept of precision medicine, has led to the incorporation of multigene variation information into risk prediction models to enhance their accuracy [2]. Recent genome-wide association studies (GWAS) focused on myocardial infarction (MI) have explored gene expression and heredity within families, identifying several candidate genes and single nucleotide polymorphisms (SNPs) associated with the condition [3–5]. Notably, GWAS of cardiovascular disease have pinpointed multiple loci, including nine that are robustly linked to coronary artery disease, such as those located at 9p34 and 9p31, suggesting that genetic variation plays a role in mediating hyperlipidemia. However, despite these advancements, risk prediction for MI using SNPs alone remains insufficiently accurate at this time.
The polygenic risk score (PRS) method, which combines traditional risk factors with genetic variation information, enhances the accuracy of disease risk predictions and identifies additional targets for preventive treatments. However, there are two significant limitations to consider. First, most, if not all, studies on myocardial infarction (MI) risk prediction using PRS have been conducted primarily in European and American populations, predominantly focusing on Caucasian individuals [6,7]. Consequently, a PRS model tailored for MI risk prediction in the Asian population is lacking. Second, previous studies have predominantly involved non-diabetic patients. Given that type 2 diabetes mellitus (T2DM) is a critical risk factor for MI, there is an urgent need for a new MI risk prediction model specifically for patients with T2DM. This study aims to utilize the PRS approach to establish an MI risk prediction model in the Chinese Han diabetic population. It will also assess whether integrating clinical risk factors with genetic variation information can improve the model’s accuracy and offer potential therapeutic strategies.
2.Materials and Methods
2.1.Study Subjects
A total of 645 T2MD patients were enrolled in this study. Of these, 175 were diabetic with MI (case group), and 470 were diabetic without MI. Blood samples from MI patients were collected within 6 h of acute MI in the Department of Cardiology, the First Affiliated Hospital of Shanxi Medical University, from January 2017 to December 2020. Blood samples from non-MI were collected from patients hospitalized for diseases other than MI during the same period. All study protocols were approved by the Ethics Committee of Shanxi Medical University (protocol number: CI-147). Written informed consent was obtained from all subjects before study inclusion. T2DM was diagnosed per American Diabetes Association criteria: a fasting blood glucose (FBG) ≥ 126 mg/dL, or 2-h blood glucose (after standard oral glucose tolerance test) exceeding or equaling 200 mg/dL, or random (non-fasting) blood glucose ≥ 200 mg/dL or HbA1c > 6.5%.
The inclusion and exclusion criteria for enrolling patients were derived from the prospective cardiovascular Munster and Framingham Heart studies. Diabetic patients aged between 20 and 75 years, with or without myocardial infarction (MI) as confirmed by cardiac catheterization, were enrolled. Inclusion criteria included controlled or uncontrolled hypertension (e.g., systolic BP ≤ 140 mmHg, diastolic BP ≤ 90 mmHg).
Exclusion criteria for this study were as follows: type 1 diabetics; severe comorbidities such as congestive heart failure, liver disease, malignancy, inflammatory processes, pregnancy; or any factors affecting body weight, such as hyperthyroidism, corticosteroids, or contraceptives. Patients were also excluded for other common comorbidities, such as chronic kidney disease (defined by eGFR thresholds) or retinopathy. Additionally, patients with pre-existing angina were excluded from the control group. Patients on experimental therapies or those who had experienced recent medication changes within the last three months were also excluded.
2.2.Clinical Characterization and Biochemical Analysis
Clinical data, including age, sex, height, weight, history of hypertension, diabetes, hyperlipidemia, coronary heart disease, and family history, were collected by a uniform questionnaire in both groups. 5 mL of peripheral venous blood was collected no later than 6 h after the diagnosis of MI. A clinical chemical assay kit (Beckman Coulter) was used to detect clinical biochemical indicators. HbA1c, BMI, total cholesterol, high-density lipoprotein (HDL) cholesterol, low-density lipoprotein (LDL) cholesterol, triglycerides (TG), total cholesterol (TCH), and glucose were determined by commercial kit via Hitachi 7600 biochemical automatic analyzer (Hitachi, Tokyo, Japan).
2.3.Single Nucleotide Polymorphism Detection
Genomic DNA was extracted from peripheral blood using Wizard genomic DNA purification kit (Promega, Madison, WI, USA) per the manufacturer’s instructions. The quality of the DNA was examined on a Nanodrop spectrophotometer (Thermos, Wilmington, NC, USA). For each sample, 50 μg of genomic DNA was used to generate targets per the MassARRAY genetic analysis system (Sequenom, San Diego, CA, USA) Genomewide Human SNP Array protocol. Targets were prepared if 50 μg of amplified DNA was available and if they were between 250 and 2000 bp and hybridized per the manufacturer’s recommendation.
2.4.Statistical Analysis
In this study, descriptive analysis and the normality of all quantitative variables were conducted using the Shapiro-Wilk test. Normally distributed data are expressed as mean ± SD. A skew distribution is represented by a median with an interquartile range (IQR). Differences between groups were tested using the Mann-Whitney U test for continuous variables. Chi-square tests were used to examine differences in categorical variables’ distributions. Using univariate logistic regression analysis, we calculated the effects of different variables. The association test between SNPs and MI was performed using an additive effect model, which encodes each SNP’s genotype as 1 (the homozygous genotype of the allele with a lower alphabetical order), 2 (the heterozygous genotype), and 3 (the homozygous genotype of the allele with a higher alphabetical order).
After adjusting for other factors, we built among the significant variables noted by univariate analysis to determine potential independent risk factors for diabetic-related MI. Multivariate regression was constructed and performed to identify independent markers and expressed by odds ratio (OR) and 95% confidence interval (CI).
The Youden index was used to optimize the model’s cut-off point, and the predicted probability of being diagnosed with diabetic MI was used to construct receiver operating characteristic (ROC) curves. The area under the ROC curve (AUC) served as an accuracy index evaluating the diagnostic performance of the noted marker. C statistics were constructed and statistically compared between the full prediction model (including clinical and SNP risk factors), clinical risk factor prediction model, and SNP prediction model. In addition, net reclassification improvement of the full model over the models No/Only SNPs was applied to evaluate the advantage by integrating SNPs. Finally, a nomogram was established based on the identified risk factors.
All statistical analyses were conducted with SAS 9.4 and SPSS version 22.0 (SPSS, Chicago, IL, USA). p values less than 0.05 were considered significant.
3.Results
3.1.General Characteristics
Table 1a details the study population’s clinical characteristics data. The age range of the groups was from 35 to 82 years. Within the diabetic MI (Case) group, 57.14% of participants were male, 72% had hypertension, and 48.57% were smokers. Among the diabetic people without MI (control group), 53.19% of individuals were male, 65.53% were diagnosed with hypertension, and 36.17% were patients with a smoking history. Compared to other independent variables, age, smoking, BMI, and T2DM history in the case group are significantly higher than in the control group. At the same time, high-density lipoprotein (HDL) and MetS are significantly lower.
In Table 1b, 58 SNPs were identified and analyzed. 7 SNPs showed difference between diabetes + MI and diabetes-MI, including SNP-rs11206510 (gene PCSk9) locates in chromosome 1, SNP-rs12876411 (gene DPY19L3-DT) locates in chromosome 19, SNP-rs17087335 (gene NOA1) locates in chromosome 4, SNP-rs17514846 (gene FURIN) locates in chromosome 15, SNP-rs9319428 (gene FLT1) locates in chromosome 13, and SNP-rs216172 (SMG6) and SNP-rs46522 (UBE2Z) both localize in chromosome 17. The SNPs’ possible bp and MAF information were provided. The result showed that the minor allele frequency (MAF) in the diabetic MI (case group) is markedly different compared to the control group (Table 1).
Table 1.
(a) Clinical Characteristics for the diabetic patient with/without myocardial infarction. (b) SNPs Characteristics for the diabetic patient with/without myocardial infarction.
(a)
| Independent Factor | Case Group (N = 175) | Control Group (N = 470) | p-Value |
|---|---|---|---|
| Age | 68.15 ± 12.63 | 60.16 ± 13.40 | < 0.0001 * |
| Height (cm) | 165.31 ± 8.24 | 165.40 ± 8.16 | 0.912 |
| Weight (kg) | 68.97 ± 12.50 | 67.18 ± 12.05 | 0.087 |
| Smoking | 85 (48.57%) | 170 (36.17%) | 0.005 * |
| Drink alcohol | 58 (33.14%) | 88 (18.72%) | 0.321 |
| BMI | 25.34 ± 3.69 | 24.56 ± 3.98 | 0.021 * |
| Family history of PCHD | 71 (40.57%) | 168 (35.74%) | 0.262 |
| Fasting blood glucose | 7.59 ± 3.18 | 7.77 ± 3.34 | 0.582 |
| Gender | 100 (57.14%) | 250 (53.19%) | 0.37 |
| HDL | 1.04 ± 0.30 | 1.04 ± 0.31 | 0.005215 |
| Hypertension | 126 (72.00%) | 308 (65.53%) | 0.12 |
| Hypohdl-emia | 63 (36.00%) | 102 (21.70%) | 0.0094 * |
| Triglyceride | 1.90 ± 1.12 | 1.86 ± 1.97 | 0.8053 |
| Total cholesterol | 4.02 ± 1.31 | 4.08 ± 1.33 | 0.6445 |
| MetS | 112 (64.00%) | 207 (44.04%) | < 0.0001 * |
| Number of months of diagnosis of T2DM | 114.66 ± 27.40 | 101.84 ± 24.76 | < 0.0001 * |
(b)
| Independent factor | Case Group (N = 175) | Control Group (N = 470) | p-Value | Gene | Chr | Posi_bp | Whole-Sample MAF (MinorA/MajorA) | Case Group MAF (MinorA/MajorA) | Control Group MAF (MinorA/MajorA) |
|---|---|---|---|---|---|---|---|---|---|
| SNP-rs10840293 | 1.95 ± 0.71 | 2.18 ± 0.69 | 0.11885 | SWAP70 | 11 | 9729649 | 0.442 (A/G) | 0.477 (G/A) | 0.412 (A/G) |
| SNP-rs10947789 | 2.43 ± 0.65 | 2.34 ± 0.73 | 0.883752 | KCNK5 | 6 | 39207146 | 0.317 (C/T) | 0.286 (C/T) | 0.329 (C/T) |
| SNP-rs10953541 | 1.41 ± 0.58 | 1.40 ± 0.62 | 0.578697 | BCAP29 | 7 | 107604100 | 0.201 (T/C) | 0.206 (T/C) | 0.199 (T/C) |
| SNP-rs11203042 | 2.09 ± 0.75 | 2.06 ± 0.75 | 0.749076 | LIPA | 10 | 89229352 | 0.464 (C/T) | 0.454 (C/T) | 0.468 (C/T) |
| SNP-rs11206510 | 2.86 ± 0.34 | 2.88 ± 0.33 | 0.032249 * | PCSK9 | 1 | 55030366 | 0.064 (C/T) | 0.069 (C/T) | 0.062 (C/T) |
| SNP-rs1122608 | 1.19 ± 0.45 | 1.31 ± 0.54 | 0.553762 | SMARCA4 | 19 | 11052925 | 0.138 (T/G) | 0.094 (T/G) | 0.154 (T/G) |
| SNP-rs11556924 | 1.14 ± 0.45 | 1.26 ± 0.56 | 0.368367 | ZC3HC1 | 7 | 130023656 | 0.114 (T/C) | 0.069 (T/C) | 0.131 (T/C) |
| SNP-rs11830157 | 2.39 ± 0.69 | 2.41 ± 0.71 | > 0.999999 | KSR2 | 12 | 117827636 | 0.297 (G/T) | 0.303 (G/T) | 0.295 (G/T) |
| SNP-rs12190287 | 1.89 ± 0.73 | 1.79 ± 0.70 | 0.682227 | TCF21 | 6 | 133893387 | 0.406 (G/C) | 0.443 (G/C) | 0.393 (G/C) |
| SNP-rs12413409 | 2.39 ± 0.79 | 2.38 ± 0.72 | 0.120829 | CNNM2 | 10 | 102959339 | 0.31 (A/G) | 0.306 (A/G) | 0.312 (A/G) |
| SNP-rs12936587 | 2.59 ± 0.62 | 2.62 ± 0.58 | 0.072582 | RASD1/SMCR3/PEMT | 17 | 17640408 | 0.193 (A/G) | 0.206 (A/G) | 0.188 (A/G) |
| SNP-rs12976411 | 1.83 ± 0.70 | 1.81 ± 0.72 | 0.002753 * | DPY19L3-DT | 19 | 32391114 | 0.408 (T/A) | 0.417 (T/A) | 0.404 (T/A) |
| SNP-rs1412444 | 1.85 ± 0.63 | 1.73 ± 0.63 | 0.229461 | LIPA | 10 | 89243170 | 0.38 (T/C) | 0.426 (T/C) | 0.363 (T/C) |
| SNP-rs1561198 | 1.84 ± 0.77 | 1.80 ± 0.74 | 0.718281 | VAMP5 | 2 | 85582866 | 0.406 (T/C) | 0.42 (T/C) | 0.401 (T/C) |
| SNP-rs16986953 | 2.43 ± 0.61 | 2.38 ± 0.67 | 0.082858 | AK097927 | 2 | 19742712 | 0.304 (A/G) | 0.286 (A/G) | 0.311 (A/G) |
| SNP-rs17087335 | 1.79 ± 0.78 | 1.79 ± 0.75 | 0.003089 * | NOA1 | 4 | 56972417 | 0.396 (T/G) | 0.397 (T/G) | 0.396 (T/G) |
| SNP-rs17114036 | 1.08 ± 0.27 | 1.09 ± 0.29 | 0.114819 | PLPP3 | 1 | 56497149 | 0.045 (G/A) | 0.04 (G/A) | 0.047 (G/A) |
| SNP-rs17464857 | 2.96 ± 0.20 | 2.93 ± 0.26 | > 0.999999 | TAF1A | 1 | 222589367 | 0.031 (G/T) | 0.02 (G/T) | 0.035 (G/T) |
| SNP-rs17465637 | 2.17 ± 0.70 | 2.28 ± 0.66 | 0.622193 | MIA3 | 1 | 222650187 | 0.374 (A/C) | 0.414 (A/C) | 0.36 (A/C) |
| SNP-rs17514846 | 2.73 ± 0.53 | 2.58 ± 0.64 | 0.049358 * | FURIN | 15 | 90873320 | 0.191 (A/C) | 0.134 (A/C) | 0.212 (A/C) |
| SNP-rs17609940 | 2.92 ± 0.27 | 2.89 ± 0.31 | 0.486447 | ANKS1A | 6 | 35067023 | 0.05 (C/G) | 0.04 (C/G) | 0.054 (C/G) |
| SNP-rs1878406 | 1.47 ± 0.62 | 1.45 ± 0.64 | 0.280705 | EDNRA | 4 | 147472512 | 0.229 (T/C) | 0.237 (T/C) | 0.227 (T/C) |
| SNP-rs2023938 | 2.97 ± 0.18 | 2.94 ± 0.23 | 0.371735 | HDAC9 | 7 | 18997152 | 0.025 (C/T) | 0.017 (C/T) | 0.028 (C/T) |
| SNP-rs2047009 | 1.90 ± 0.76 | 2.10 ± 0.75 | 0.115451 | CXCL12 | 10 | 44044465 | 0.476 (G/T) | 0.451 (T/G) | 0.449 (G/T) |
| SNP-rs2048327 | 2.12 ± 0.64 | 2.21 ± 0.65 | > 0.999999 | SLC22A3 | 6 | 160442500 | 0.407 (C/T) | 0.44 (C/T) | 0.395 (C/T) |
| SNP-rs2075650 | 1.25 ± 0.54 | 1.25 ± 0.51 | 0.641554 | TOMM40 | 19 | 44892362 | 0.124 (G/A) | 0.126 (G/A) | 0.123 (G/A) |
| SNP-rs216172 | 2.43 ± 0.70 | 2.40 ± 0.65 | 0.008817 * | SMG6 | 17 | 2223210 | 0.296 (C/G) | 0.283 (C/G) | 0.301 (C/G) |
| SNP-rs2252641 | 1.52 ± 0.61 | 1.63 ± 0.68 | 0.125832 | TEX41 | 2 | 145043894 | 0.301 (T/C) | 0.26 (T/C) | 0.317 (T/C) |
| SNP-rs2505083 | 2.45 ± 0.64 | 2.49 ± 0.67 | > 0.999999 | JCAD | 10 | 30046193 | 0.262 (C/T) | 0.277 (C/T) | 0.256 (C/T) |
| SNP-rs264 | 2.58 ± 0.65 | 2.64 ± 0.56 | 0.371466 | LPL | 8 | 19955669 | 0.187 (A/G) | 0.211 (A/G) | 0.178 (A/G) |
| SNP-rs273909 | 1.17 ± 0.53 | 1.13 ± 0.43 | 0.42051 | SLC22A4 | 5 | 132331660 | 0.07 (G/A) | 0.086 (G/A) | 0.064 (G/A) |
| SNP-rs2895811 | 2.45 ± 0.63 | 2.36 ± 0.68 | 0.075834 | HHIPL1 | 14 | 99667605 | 0.309 (C/T) | 0.274 (C/T) | 0.322 (C/T) |
| SNP-rs2954029 | 2.07 ± 0.71 | 2.07 ± 0.72 | 0.172172 | TRIB1 | 8 | 125478730 | 0.466 (A/T) | 0.463 (A/T) | 0.467 (A/T) |
| SNP-rs3184504 | 1.13 ± 0.49 | 1.11 ± 0.47 | 0.106806 | SH2B3 | 12 | 111446804 | 0.059 (T/C) | 0.063 (T/C) | 0.057 (T/C) |
| SNP-rs3217992 | 1.87 ± 0.64 | 2.02 ± 0.65 | 0.410183 | CDKN2B | 9 | 22003224 | 0.488 (T/C) | 0.434 (T/C) | 0.491 (C/T) |
| SNP-rs3798220 | 2.91 ± 0.28 | 2.87 ± 0.33 | 0.349055 | LPA | 6 | 160540105 | 0.057 (C/T) | 0.043 (C/T) | 0.063 (C/T) |
| SNP-rs4252120 | 2.95 ± 0.21 | 2.95 ± 0.22 | 0.790885 | PLG | 6 | 160722576 | 0.025 (C/T) | 0.023 (C/T) | 0.026 (C/T) |
| SNP-rs445925 | 2.75 ± 0.51 | 2.79 ± 0.49 | 0.251276 | APOC1 | 19 | 44912383 | 0.109 (A/G) | 0.123 (A/G) | 0.103 (A/G) |
| SNP-rs46522 | 2.35 ± 0.70 | 2.40 ± 0.70 | 0.00889 * | UBE2Z | 17 | 48911235 | 0.307 (C/T) | 0.323 (C/T) | 0.301 (C/T) |
| SNP-rs4773144 | 1.74 ± 0.70 | 1.63 ± 0.69 | 0.696389 | COL4A1 | 13 | 110308365 | 0.329 (G/A) | 0.371 (G/A) | 0.313 (G/A) |
| SNP-rs4845625 | 1.81 ± 0.74 | 1.90 ± 0.75 | 0.103667 | IL6R | 1 | 154449591 | 0.436 (T/C) | 0.406 (T/C) | 0.448 (T/C) |
| SNP-rs10830963 | 1.70 ± 0.72 | 1.60 ± 0.62 | 0.745593 | MTNR1B | 11 | 92975544 | 0.312 (G/C) | 0.291 (G/C) | 0.319 (G/C) |
| SNP-rs4977574 | 1.96 ± 0.69 | 2.06 ± 0.72 | 0.873734 | CDKN2B-AS1 | 9 | 22098575 | 0.483 (A/G) | 0.48 (G/A) | 0.469 (A/G) |
| SNP-rs501120 | 2.13 ± 0.69 | 2.18 ± 0.67 | 0.579043 | CXCL12 | 10 | 44258419 | 0.416 (C/T) | 0.434 (C/T) | 0.41 (C/T) |
| SNP-rs515135 | 1.41 ± 0.61 | 1.36 ± 0.58 | 0.636827 | APOB | 2 | 21063185 | 0.186 (T/C) | 0.206 (T/C) | 0.179 (T/C) |
| SNP-rs56062135 | 1.12 ± 0.42 | 1.13 ± 0.44 | 0.757882 | SMAD3 | 15 | 67163292 | 0.063 (T/C) | 0.06 (T/C) | 0.064 (T/C) |
| SNP-rs579459 | 2.58 ± 0.60 | 2.64 ± 0.56 | 0.850409 | ABO | 9 | 133278724 | 0.189 (C/T) | 0.211 (C/T) | 0.181 (C/T) |
| SNP-rs646776 | 2.81 ± 0.48 | 2.69 ± 0.60 | 0.87048 | CELSR2 | 1 | 109275908 | 0.14 (C/T) | 0.097 (C/T) | 0.156 (C/T) |
| SNP-rs663129 | 2.51 ± 0.57 | 2.49 ± 0.60 | > 0.999999 | PMAIP1-MC4R | 18 | 60171168 | 0.253 (A/G) | 0.243 (A/G) | 0.257 (A/G) |
| SNP-rs7136259 | 1.83 ± 0.71 | 1.73 ± 0.64 | > 0.999999 | ATP2B1 | 12 | 89687411 | 0.378 (T/C) | 0.414 (T/C) | 0.364 (T/C) |
| SNP-rs7173743 | 2.12 ± 0.71 | 2.11 ± 0.71 | 0.606867 | ADAMTS7 | 15 | 78849442 | 0.442 (C/T) | 0.44 (C/T) | 0.443 (C/T) |
| SNP-rs7692387 | 2.57 ± 0.61 | 2.54 ± 0.61 | 0.747528 | GUCY1A1 | 4 | 155714157 | 0.226 (A/G) | 0.217 (A/G) | 0.229 (A/G) |
| SNP-rs8042271 | 2.22 ± 0.73 | 2.25 ± 0.68 | 0.10355 | MFGE8- ABHD2 | 15 | 89030987 | 0.379 (A/G) | 0.389 (A/G) | 0.376 (A/G) |
| SNP-rs9319428 | 2.25 ± 0.74 | 2.23 ± 0.71 | < 0.000001 * | FLT1 | 13 | 28399484 | 0.383 (A/G) | 0.377 (A/G) | 0.385 (A/G) |
| SNP-rs9515203 | 2.63 ± 0.59 | 2.64 ± 0.62 | 0.9408 | COL4A2 | 13 | 110397276 | 0.181 (C/T) | 0.183 (C/T) | 0.181 (C/T) |
| SNP-rs964184 | 1.49 ± 0.70 | 1.48 ± 0.67 | 0.8794 | ZPR1 | 11 | 116778201 | 0.24 (G/C) | 0.243 (G/C) | 0.238 (G/C) |
| SNP-rs974819 | 2.30 ± 0.69 | 2.30 ± 0.76 | 0.9653 | PDGFD | 11 | 103789839 | 0.35 (C/T) | 0.351 (C/T) | 0.35 (C/T) |
| SNP-rs9982601 | 1.04 ± 0.20 | 1.04 ± 0.20 | 0.9806 | SLC5A3- MRPS6-KCNE2 | 21 | 34226827 | 0.02 (T/C) | 0.02 (T/C) | 0.02 (T/C) |
3.2.Identification of Clinical Factors and SNPs Associated with the Risk of MI in Diabetic Patients
Univariate logistics regression analysis revealed that MI risk in T2DM is unrelated to height, weight, gender, alcohol or PCHD history, total cholesterol, and total triglyceride. However, it is closely related to age, smoking, BMI, low plasma HDL level (hypoHDLemia), MetS, and years of diabetes. To screen out SNPs associated with MI in diabetic patients, we established the following screening criteria: (1) positive association SNPs for genetic risk of MI retrieved from Pubmed and Chinese Biomedical database (cnki.net) searches; (2) the minor allele frequency greater than 3% in Han race population; (3) Priority is given to studies conducted on T2DM patients and the Han population; (4) Priority is given to exon SNPs and tag SNPs. Univariate logistics regression analysis utilizing our SNP database identified 8 SNPs (SNP-rs10840293, SNP-rs1122608, SNP-rs11556924, SNP-rs1412444, SNP-rs17514846, SNP-rs2047009, SNP-rs3217992, SNP-rs646776) are significantly associated with diabetes-related MI (Table 2).
Table 2.
Correlation between diabetic myocardial infarction and SNPs/lab characteristics by univariate logistic analysis.
| Independent Factor | Case Group (N = 175) | Control Group (N = 470) | p-Value | OR (95% CI) |
|---|---|---|---|---|
| Age | 68.15 ± 12.63 | 60.16 ± 13.40 | < 0.0001 a | 1.631 (1.404–1.894) |
| Smoking | 85 (48.57%) | 170 (36.17%) | 0.006 a | 1.662 (1.155–2.393) |
| BMI | 25.34 ± 3.69 | 24.56 ± 3.98 | 0.023 a | 1.051 (1.006–1.098) |
| Hypohdl-emia | 63 (36.00%) | 102 (21.70%) | 0.0098 a | 1.661 (1.128–2.446) |
| MetS | 112 (64.00%) | 207 (44.04%) | < 0.0001 a | 2.259 (1.578–3.232) |
Number of years of diagnosis of T2DM | 114.66 ± 27.40 | 101.84 ± 24.76 | < 0.0001 a | 1.266 (1.163–1.379) |
| SNP-rs10840293 | 1.95 ± 0.71 | 2.18 ± 0.69 | 0.0003 a | 0.632 (0.491–0.813) |
| SNP-rs1122608 | 1.19 ± 0.45 | 1.31 ± 0.54 | 0.0088 a | 0.603 (0.411–0.885) |
| SNP-rs11556924 | 1.14 ± 0.45 | 1.26 ± 0.56 | 0.0083 a | 0.594 (0.400–0.882) |
| SNP-rs1412444 | 1.85 ± 0.63 | 1.73 ± 0.63 | 0.025 a | 1.369 (1.040–1.801) |
| SNP-rs17514846 | 2.73 ± 0.53 | 2.58 ± 0.64 | 0.0043 a | 1.582 (1.150–2.176) |
| SNP-rs2047009 | 1.90 ± 0.76 | 2.10 ± 0.75 | 0.0028 a | 0.702 (0.556–0.886) |
| SNP-rs3217992 | 1.87 ± 0.64 | 2.02 ± 0.65 | 0.0099 a | 0.701 (0.535–0.920) |
| SNP-rs646776 | 2.81 ± 0.48 | 2.69 ± 0.60 | 0.02 a | 1.501 (1.063–2.120) |
3.3.Four SNPs Are Independent Risk Predictors for Diabetic Myocardial Infarction
The stepwise regression analysis followed by multivariate logistic analysis regarding diabetic MI and the patient’s lab results is shown in Table 3. After adjustment for other risk factors, stepwise regression assay indicated that four SNPs (SNP-rs10840293; SNP-rs17465637; SNP-rs2252641; SNP-rs7136259) were correlated with diabetic MI and was an independent predictor for the disease (SNP-rs10840293, hazard ratio, 0.493, 95% CI, 0.323–0.752, p = 0.001; SNP-rs17465637, hazard ratio, 0.466, 95% CI, 0.300–0.724, p = 0.0007; SNP-rs2252641, hazard ratio, 0.613, 95% CI, 0.386–0.973, p = 0.0377; SNP-rs7136259, hazard ratio, 0.561, 95% CI, 1.007–2.418, p = 0.0464). The effect of independent factors on the risk of MI is presented in Figure 1.
Table 3.
Multivariant logistic analysis of risk factors to diabetic myocardial infarction.
| Independent Factor | Case Group (N = 175) | Control Group (N = 470) | p-Value | OR (95% CI) |
|---|---|---|---|---|
| Gender | 100 (57.14%) | 250 (53.19%) | 0.0295 | 1.921 (1.067–3.457) |
| Smoking | 85 (48.57%) | 170 (36.17%) | 0.0439 | 1.812 (1.016–3.231) |
| Age | 68.15 ± 12.63 | 60.16 ± 13.40 | < 0.0001 | 1.752 (1.375–2.233) |
| Number of years of diagnosis of T2DM | 114.66 ± 27.40 | 101.84 ± 24.76 | < 0.0001 | 1.434 (1.240–1.658) |
| SNP-rs10840293 | 1.95 ± 0.71 | 2.18 ± 0.69 | 0.001 | 0.493 (0.323–0.752) |
| SNP-rs17465637 | 2.17 ± 0.70 | 2.28 ± 0.66 | 0.0007 | 0.466 (0.300–0.724) |
| SNP-rs2252641 | 1.52 ± 0.61 | 1.63 ± 0.68 | 0.0377 | 0.613 (0.386–0.973) |
| SNP-rs7136259 | 1.83 ± 0.71 | 1.73 ± 0.64 | 0.0464 | 1.561 (1.007–2.418) |
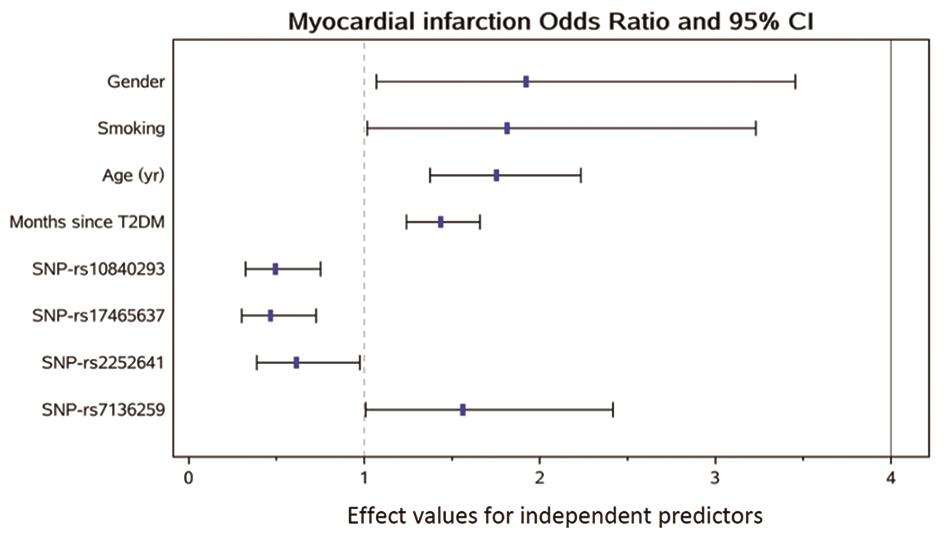
Figure 1.Stepwise logistic regression assay for independent predictors.
3.4.Integrating Clinical Risk Factors and SNPs Risk Factors Serve as a Better Predictive Model For Diabetic Myocardial Infarction
All identified independent risk factors (clinical and SNPs) of diabetic MI were used to establish a prediction model to optimize the strategy for improvement of the accuracy of diabetic MI prediction. Based on the statistical correlation analysis results for each risk factor (presented in Tables 2 and 3 and Figure 1), following full risk prediction model was established: risk of MI in T2DM = 0.6526 × gender + 0.5945 × smoking + 0.5608 × age + 0.3603 × years of diagnosed T2DM-0.7066 × SNPrs10840293-0.7644 × SNPrs17465637-0.4900 × SNPrs2252641 + 0.4450 × SNPrs7136259-4.9034. A receiver operating characteristic (ROC) curve was constructed to evaluate the diagnostic value. With sensitivity and 1-specificity as indexes, the cut-off points of the traditional clinical risk factor predictive model, SNPs predictive model, and full predictive model were optimized, and the ROC curves were obtained. As shown in Figure 2, the traditional prediction model (4 clinical factors) had an AUC of 0.70, whereas the SNP-based prediction model had an AUC of 0.601, suggesting that both models are useful in predicting MI in diabetic patients. Most importantly, our new full prediction model (integrating clinical risk factors and SNPs) had the highest accuracy, with an AUC of 0.76.
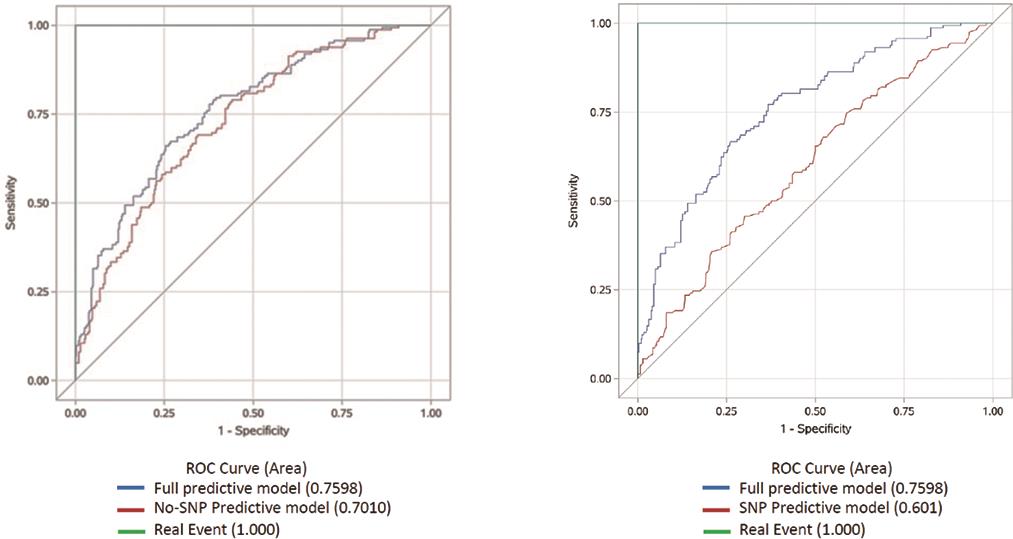
Figure 2.ROC curves for diagnosis of diabetic myocardial infarction.
To evaluate the statistical difference between the three prediction models, the prediction accuracy of our prediction model and the models with SNPs only or clinical risk factors only were compared. The results indicate that our new predictive model is significantly better than the SNPs prediction model in predicting MI risk in diabetic patients (p < 0.001). Our prediction model tended to improve prediction accuracy over the clinical risk factor model, although the difference did not reach statistical significance (Table 3).
To evaluate the potential gain of statistical power by integrating SNPs in the prediction model, we statistically tested the difference in AUC between the full model and the No/Only SNPs models. As shown in Table 4, the difference of AUC between the full model (AUC = 0.76) and No-SNP model (AUC = 0.73) did not reach significance (p = 0.09), while the full model presented significantly higher AUC than the Only-SNP model (p < 0.001). In consistence with the results shown in Table 4, Table 5 shows in terms of net reclassification improvement that the full model has better performance than Only-SNP model, while not the case for the No-SNP model.
Table 4.
Comparison of prediction performance between the full prediction model and models No/Only SNP.
| AUC | AUC Difference | Difference Test p Value | ||
|---|---|---|---|---|
| Full model | No-SNP model | Standard error | 95% CI | 0.09 |
| 0.76 | 0.73 | 0.046 | (-0.005, 0.065) | |
| AUC | AUC Difference | Difference Test p Value | ||
| Full model | Only-SNP model | Standard error | 95% CI | < 0.001 |
| 0.76 | 0.60 | 0.0304 | (0.0991, 0.2184) | |
Table 5.
Net reclassification improvement of the full prediction model over models No/Only SNP.
| NRI over No- SNP Model | Standard Error of NRI | NRI p-Value | NRI 95% CI |
|---|---|---|---|
| 0.1782 | 0.0920 | 0.0538 | (-0.0022, 0.3587) |
| NRI over Only- SNP Model | Standard Error of NRI | NRI p-Value | NRI 95% CI |
| 0.6889 | 0.0859 | < 0.0001 | (0.5206, 0.8572) |
To facilitate the clinical application of our full prediction model, a forecast model diagram was developed (Figure 3). When a patient is associated with the risk factors (gender, smoking, age, T2DM history, the number of four SNPs identified), the diagram can be used to calculate the total points and evaluate their risk for MI.
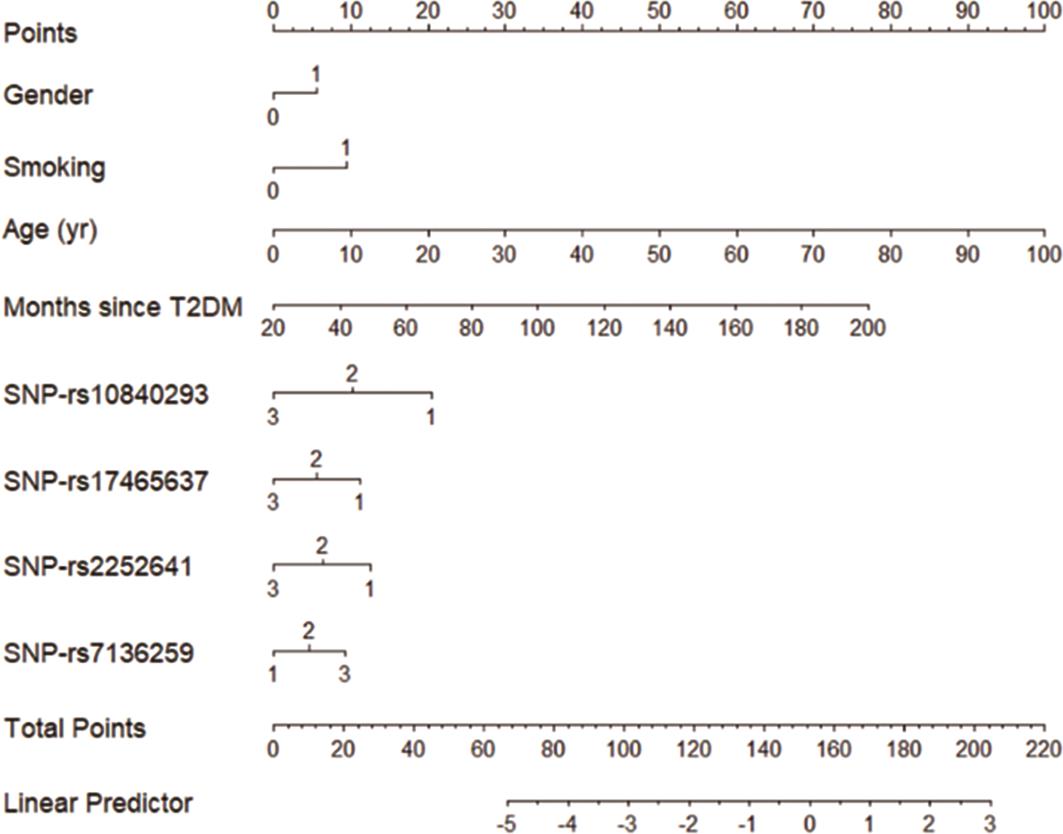
Figure 3.Forecast model diagram.
4.Discussion
In this study, we introduced a predictive diagram aimed at significantly improving the accuracy of myocardial infarction (MI) risk assessment in patients with type 2 diabetes mellitus (T2DM). This innovative model not only incorporates essential clinical risk factors but also integrates key single nucleotide polymorphisms (SNPs), effectively determining the likelihood of developing MI. The diagram serves as a vital resource that enhances both diagnostic precision and targeted treatment strategies for high-risk patients. By visualizing the interplay between genetic markers and clinical indicators, healthcare providers can more readily identify individuals at elevated risk for MI. This comprehensive tool empowers clinicians to implement early interventions more effectively and customize treatment plans based on a patient’s specific risk profile.
Genetic factors play a crucial role in the onset and progression of myocardial infarction (MI) in patients with diabetes. While single nucleotide polymorphisms (SNPs) are linked to increased cardiovascular risk, their clinical use has often been sidelined due to historical cost and performance issues. However, recent advancements in genetic analysis technology have made these tests more accessible and affordable, providing timely and accurate results [5,8]. We take the technology advantages to integrate the SNP analysis into clinical settings, offering critical insights that can enhance risk stratification and management for patients susceptible to diabetes-related MI.
Growing evidence indicates the importance of including complete populations with different genetic backgrounds to characterize the genetic structure of CHD [9]. While a wealth of polygenic risk score (PRS) research has been conducted primarily among European and American cohorts, there remains a notable scarcity of studies focusing on Asian populations [10]. For instance, a significant association was identified in a UK-based cohort of 13,655 individuals over an average follow-up period of 6.8 years, linking the SNP-rs10830963 to an increased risk of myocardial infarction (MI) using an additive effect model [11]. However, the current study did not replicate this association within the Han population, highlighting a critical gap in our understanding and emphasizing the necessity for research that is tailored to different racial and ethnic groups. This discrepancy raises important questions regarding the generalizability of findings from predominantly Western studies to other populations. Our study suggests that genetic risk factors for MI can vary widely among different ethnic groups, which reinforces the imperative for more inclusive research frameworks. By focusing on the Han population, the present study contributes valuable data that enhances our understanding of MI risk in the Asian diabetic population. Furthermore, it lays the groundwork for the development of more accurate and culturally relevant risk prediction models, ultimately aiming to improve individualized patient management and outcomes in diverse demographic groups. This effort is vital as it aligns with the growing recognition of personalized medicine, where risk predictions can be more effectively tailored to the genetic and environmental contexts of specific populations.
Although the PRS can improve the accuracy of the prediction models and lead to changes in patient prevention and management measures [12], there is currently no prominent model that includes SNPs to predict the risk of MI in patients with diabetes. The participants in the current study were predominantly from northern China, with approximately half from the northeast and half from the central northern regions, reflecting the area’s diverse genetic and environmental backgrounds. This regional focus is relevant given the high prevalence of diabetes in China, which has seen a rapid increase in recent decades. In 2021, China had the highest number of diabetics globally, with about 141 million adults affected [13,14]. A combination of complex assays was applied to screen SNPs and clinical factors to establish an accurate prediction model based upon this population, which largely reflect the current diabetic status of Han population [15,16]. Another advantage of this study is that its results differ from those found in other populations, where variations in genetic susceptibility, environmental exposures, and healthcare practices contribute to distinct risk profiles for myocardial infarction (MI) in diabetics. For instance, in Western populations, higher BMI thresholds or different genetic markers are often associated with diabetic complications, while in northern China, other factors such as glycemic control patterns or dietary sodium intake may play more prominent roles. The study’s results emphasize the importance of population-specific genetic research and highlight the need for future studies to compare these unique findings with global data to understand broader implications and potential applications in diverse clinical settings.
we found that the C statistic for the comprehensive prediction model was significantly higher than that of the SNP-only prediction model (p < 0.001). This finding holds substantial clinical relevance, underscoring the inadequacy of relying on SNPs alone for assessing myocardial infarction (MI) risk in individuals with type 2 diabetes mellitus (T2DM). Instead, the incorporation of risk SNPs alongside traditional risk factors substantially enhances the clinical utility of genetic data in predicting MI in this population. Moreover, while our full prediction model demonstrated a higher accuracy compared to the traditional clinical risk factor model, the difference did not achieve statistical significance. This observation aligns with prior research, which indicated that integrating SNPs into clinical risk factor models leads to a marginal improvement in predictive accuracy. Overall, these results advocate for a more holistic approach to risk assessment in T2DM patients, emphasizing the importance of combining genetic insights with established clinical parameters to optimize patient outcomes.
There are two limitations to this study. First, as this is a retrospective cohort study, determining the causal relationship between the identified potential risk factors and myocardial infarction (MI) events is challenging. However, from a biological plausibility perspective, we obtained clinical information during the early stages of MI occurrence (less than 6 h after onset). The occurrence of MI in such a short timeframe is unlikely to affect the clinical indicators we observed. This limitation should be addressed in future large-scale, prospective studies. Second, although the C statistic of the full prediction model shows improvement over the traditional clinical risk factor prediction model, this improvement is not statistically significant. This may be attributable to age as a confounding factor, as studies have shown that polygenic risk scores (PRS) are more effective in predicting the risk of MI in younger age groups [17]. In complex diseases, genetic factors can play a significant role in contributing to an earlier age at onset. Additionally, while the sample size may limit the generalizability of the findings, the inclusion of patients from various parts of northern China enhances the study’s relevance to the local diabetic population. Future research with larger, more diverse cohorts would improve the predictive accuracy of identified single nucleotide polymorphisms (SNPs) and facilitate the development of clinical tools applicable across broader demographics. Expanding the cohort would also allow for better evaluation of regional variations in genetic factors contributing to early-onset diabetic MI, thereby strengthening the translational potential of these findings.
In conclusion, this study developed a more accurate MI risk prediction model by integrating both traditional and genetic risk factors specifically for Chinese Han patients with T2DM. A clinical prediction model based on the identified predictors was established for practical application. The implementation of this risk assessment model has the potential to enhance primary prevention efforts for MI within the Chinese diabetic population.
Author Contributions: Y. Z. (Yanwei Zhang): data curation; Y. Z. (Yanqing Zhang): data curation, formal analysis, investigation, methodology; Y. L. (Yun Liu): investigation, methodology, writing—original draft; K. X.: investigation, methodology; Y. L. (Yanhong Liu): investigation, methodology; W. Y.: investigation, methodology; J. Z.: methodology, supervision, writing—review & editing; Y.W.: validation; All authors have read and agreed to the published version of the manuscript.
Funding: This research received no external funding.
Institutional Review Board Statement: Not applicable.
Informed Consent Statement: Not applicable.
Data Availability Statement: Not applicable.
Conflicts of Interest: The authors declare no conflict of interest.
Use of AI and AI-assisted Technologies: No AI tools were utilized for this paper.
References
- 1.
Avogaro, A; Bonora, E; Consoli, A; et al. Glucose-lowering therapy and cardiovascular outcomes in patients with type 2 diabetes mellitus and acute coronary syndrome. Diab. Vasc. Dis. Res. 2019, 16, 399–414. https://doi.org/10.1177/1479164119845612.
- 2.
O'Sullivan, J.W; Raghavan, S; Marquez-Luna, C; et al. Polygenic Risk Scores for Cardiovascular Disease: A Scientific Statement From the American Heart Association. Circulation 2022, 146, e93–e118. https://doi.org/10.1161/CIR.0000000000001077.
- 3.
Yanes, T; McInerney-Leo, A.M; Law, M.H; et al. The emerging field of polygenic risk scores and perspective for use in clinical care. Hum. Mol. Genet. 2020, 29, R165–R176. https://doi.org/10.1093/hmg/ddaa136.
- 4.
Lambert, S.A; Abraham, G; Inouye, M; Towards clinical utility of polygenic risk scores. Hum. Mol. Genet. 2019, 28, R133–R142. https://doi.org/10.1093/hmg/ddz187.
- 5.
Soper, E.R; Abul-Husn, N.S; Polygenic Risk Scores in Clinical Care. Adv. Mol. Pathol. 2022, 5, 1–7. https://doi.org/10.1016/j.yamp.2022.07.001.
- 6.
Nikpay, M; Goel, A; Won, H.-H; Hall, L.M; et al. A comprehensive 1000 Genomes–based genome-wide association meta-analysis of coronary artery disease. Nat. Genet. 2015, 47, 1121–1130. https://doi.org/10.1038/ng.3396.
- 7.
Jeon, S; Bhak, Y; Choi, Y; et al. Korean Genome Project: 1094 Korean personal genomes with clinical information. Sci. Adv. 2020, 6, eaaz7835. https://doi.org/10.1126/sciadv.aaz7835.
- 8.
Mujwara, D; Henno, G; Vernon, S.T; et al. Integrating a Polygenic Risk Score for Coronary Artery Disease as a Risk-Enhancing Factor in the Pooled Cohort Equation: A Cost-Effectiveness Analysis Study. J. Am. Heart Assoc. 2022, 11, e025236. https://doi.org/10.1161/JAHA.121.025236.
- 9.
Tcheandjieu, C; Zhu, X; Hilliard, A.T; et al. Large-scale genome-wide association study of coronary artery disease in genetically diverse populations. Nat. Med. 2022, 28, 1679–1692. https://doi.org/10.1038/s41591-022-01891-3.
- 10.
Martin, A.R; Kanai, M; Kamatani, Y; et al. Clinical use of current polygenic risk scores may exacerbate health disparities. Nat. Genet. 2019, 51, 584–591. https://doi.org/10.1038/s41588-019-0379-x.
- 11.
Tan, X; Benedict, C; Increased Risk of Myocardial Infarction Among Patients With Type 2 Diabetes Who Carry the Common rs10830963 Variant in the MTNR1B Gene. Diabetes Care 2020, 43, 2289–2292. https://doi.org/10.2337/dc20-0507.
- 12.
Maamari, D.J; Brockman, D.G; Aragam, K; et al. Clinical Implementation of Combined Monogenic and Polygenic Risk Disclosure for Coronary Artery Disease. JACC Adv. 2022, 1, 100068. https://doi.org/10.1016/j.jacadv.2022.100068.
- 13.
Sun, H; Saeedi, P; Karuranga, S; et al. IDF Diabetes Atlas: Global, regional and country-level diabetes prevalence estimates for 2021 and projections for 2045. Diabetes Res. Clin. Pract. 2022, 183, 109119. https://doi.org/10.1016/j.diabres.2021.109119.
- 14.
Teo, Z.L; Tham, Y.C; Yu, M; et al. Global Prevalence of Diabetic Retinopathy and Projection of Burden through 2045: Systematic Review and Meta-analysis. Ophthalmology 2021, 128, 1580–1591. https://doi.org/10.1016/j.ophtha.2021.04.027.
- 15.
Petrazzini, B.O; Chaudhary, K; Márquez-Luna, C; et al. Coronary Risk Estimation Based on Clinical Data in Electronic Health Records. J. Am. Coll. Cardiol. 2022, 79, 1155–1166. https://doi.org/10.1016/j.jacc.2022.01.021.
- 16.
Zhang, H; Qin, L; Sheng, C.S; et al. ASCVD risk stratification modifies the effect of HbA1c on cardiovascular events among patients with type 2 diabetes mellitus with basic to moderate risk. BMJ Open Diabetes Res. Care 2020, 8, e000810. https://doi.org/10.1136/bmjdrc-2019-000810.
- 17.
Isgut, M; Sun, J; Quyyumi, A.A; et al. Highly elevated polygenic risk scores are better predictors of myocardial infarction risk early in life than later. Genome Med. 2021, 13, 13. https://doi.org/10.1186/s13073-021-00828-8.

How to Cite
Zhang, Y.; Zhang, Y.; Liu, Y.; Xu, K.; Liu, Y.; Ye, W.; Zhao, J.; Wang, Y. Enhancing Myocardial Infarction Prediction in Type 2 Diabetes: A Novel Model for Diagnostic and Targeted Treatment. International Journal of Drug Discovery and Pharmacology 2025, 4 (4), 100025. https://doi.org/10.53941/ijddp.2025.100025.
RIS
BibTex
Copyright & License

Copyright (c) 2025 by the authors.
This work is licensed under a Creative Commons Attribution 4.0 International License.
Contents
Figures
References
 Suite 4002 Level 4, 447 Collins Street, Melbourne, Victoria 3000, Australia
 General Inquiries: info@sciltp.com