
The progression of cardiovascular disease shows significant sexual dimorphism: although females generally develop the disease later in life, they exhibit a higher age-related incidence than males. While current studies have separately reported sex differences in atherosclerotic development in Apoe−/− and Ldlr−/−, a comparative assessment of these sex-specific characteristics across both models is lacking. This study therefore aimed to assess the influence of sex on atherosclerosis using both Apoe−/− and Ldlr−/− mice. Eight-week-old mice were fed an atherogenic ALMN diet for 20 weeks to promote plaque development. We performed comprehensive analyses of: (1) systemic metabolic parameters (lipid profile, glucose metabolism); (2) atherosclerotic burden (whole aorta and aortic sinus plaque area); and (3) plaque composition (necrotic core size, collagen content, macrophage infiltration) in mice of both sexes. As a result, male mice showed higher lipid levels, worse glucose tolerance, and reduced insulin sensitivity compared to females in both models. Apoe−/− mice showed minimal sex differences in atherosclerosis with a trend toward increased plaque size in females. Plaque composition did not differ significantly between sexes in Apoe−/− mice. In contrast, Ldlr−/− males exhibited greater whole aortic plaque burden than females, yet plaque stability also remained similar across sexes. This comparative analysis of two widely used murine atherosclerosis models reveals genotype-dependent sexual dimorphism. This study underscores the importance of considering the distinct sex-specific characteristics of Apoe−/− and Ldlr−/− mice when selecting animal models for exploring atherosclerosis pathomechanisms as well as effective pharmacotherapies, and further supports the necessity of developing sex-specific therapies.
- Open Access
- Article
Distinct Sex-Specific Characteristics of Apoe Deficient and Ldlr Deficient Mice in Atherosclerosis: Implications for Model Selection and Therapy Development
- Yaping Zhao 1,2,
- Li Wang 2,
- Bradford C. Berk 3,
- Hans Strijdom 4,
- Yu Huang 4,
- Jianping Weng 1,5,
- Suowen Xu 1,5,6,*
Author Information
Received: 19 Dec 2025 | Revised: 03 Mar 2026 | Accepted: 04 Mar 2026 | Published: 07 Aug 2026
Abstract
Keywords
atherosclerosis | Apoe−/− | Ldlr−/− | sex dimorphism | mice
1. Introduction
Cardiovascular disease (CVD) remains one of the leading causes of global mortality, with significant gender disparities observed in its incidence, clinical manifestations, complications, and risk factors [1]. Women typically experience a later onset of CVD compared to men, but the prevalence in women catches up to or even surpasses that in men in older age groups, particularly in women of postmenopausal age. Additionally, women often present with a higher burden of complications and risk factors [2]. Notably, women’s coronary atherosclerotic plaques undergo an age-dependent phenotypic shift from stable fibrous lesions to vulnerable plaques, progressively reducing inter-sex differences in plaque characteristics—a transition partially attributed to post-menopausal estrogen decline [3,4]. Recent studies have revealed that TGF-β contributes to the fibrous plaque phenotype in females by inducing extracellular matrix remodeling and endothelial-to-mesenchymal transition, whereas plaques in males exhibit a more pronounced inflammatory phenotype [5]. However, current clinical diagnosis and treatment of cardiovascular disease largely overlook these sex differences and are predominantly based on male-oriented standards, leading to delayed diagnosis and underdiagnosis in female patients [6]. Understanding the mechanisms underlying these sex differences in atherosclerotic cardiovascular disease is crucial for refining diagnostic and therapeutic approaches and developing targeted treatment strategies [7].
Current research demonstrates that sex disparities in cardiovascular disease arise from differences in sex hormones [8], sex chromosomes [9], lipid metabolism [10], and immune responses [11], with recent studies further revealing sexually dimorphic subcellular profiles in atherosclerotic plaques [12]. Additional evidence indicates that human umbilical vein endothelial cells (HUVECs) have been shown to exhibit a sex-dimorphic response to oxLDL-induced injury, with female-derived HUVECs demonstrating increased survival and repair capacity [13]. However, findings across animal studies are often inconsistent, potentially due to variations in experimental models, dietary regimens, and feeding protocols. To address the variability introduced by mouse models, we employed two widely used experimental mouse models, Apoe−/− mice and Ldlr−/− mice, to investigate sex differences in atherosclerosis under high-fat, high-fructose and high-cholesterol diets. This approach seeks to provide more reliable and translatable insights gained from the sex disparities observed in preclinical mouse models. Moreover, these findings could provide valuable guidance for selecting appropriate mouse models in preclinical atherosclerosis basic research as well as pharmacological research.
2. Materials and Methods
2.1. Study Design
In this study, two genetically modified and widely used mouse strains [14], Apoe−/− and Ldlr−/− mice were utilized to investigate the effects of biological sex on the development of atherosclerosis. The study included four groups (n = 10 per group): male Apoe−/− mice, female Apoe−/− mice, male Ldlr−/− mice, and female Ldlr−/− mice. All mice were 8 weeks old and purchased from GemPharmatech (Nanjing, China). Mice were randomly assigned to each experimental group. Experiments were performed at the same time in both strains and both sexes. Mice of both genders were housed under a standard specific pathogen-free (SPF) environment maintained at approximately 22 °C. The environment adhered to a 12-h light-dark cycle. Mice were fed an atherogenic diet (AMLN diet, Dyets) (40% trans-fat, 2% cholesterol and 22% fructose) [15] for 20 weeks to induce atherosclerosis development. At the end of the feeding period, mice were anesthetized, and tissue samples were collected for analysis.
2.2. Body Composition Analysis
Prior to sampling, mice were weighed, and body composition (fat mass and lean mass) was measured using a body fat analyzer (Bruker Minispec Plus).
2.3. Blood Cell and Serum Lipid Analysis
Two drops of fresh blood were collected from each mouse into anticoagulant tubes and analyzed for hematocrit composition using a fully automated blood cell analyzer (Mindray, BC-30 Vet). For serum lipid analysis, whole blood was allowed to clot at room temperature for 2 h, followed by centrifugation at 12,000× g for 10 min at 4 °C. The supernatant serum was collected and stored at −80 °C until further analysis. Serum levels of total cholesterol (TC), triglycerides (TG), low-density lipoprotein (LDL)-cholesterol, and high-density lipoprotein (HDL)-cholesterol were measured using a fully automated biochemical analyzer (Shenzhen Radiometer Life Technology; Chemray 240) with a commercial kit (Radiometer/Changchun Huili).
2.4. Atherosclerosis Analysis
Atherosclerotic plaque formation was assessed in the en face aorta and aortic sinus using Oil Red O staining [16,17]. En face aortic vessels and heart tissues were fixed in 4% paraformaldehyde (PFA) for 24 h. Perivascular fat was removed from the aorta, and the vessels were dissected to expose the inner surface. The aorta was briefly immersed in 60% isopropanol for 10 s, followed by staining with 0.3% Oil Red O for 10 min. Excess stain was washed off with 60% isopropanol, and the aorta was photographed against a white background. Plaque area was quantified using ImageJ 1.54g software.
For aortic sinus analysis, fixed heart tissues were dehydrated in 20% sucrose solution for 48 h, embedded in OCT compound, and frozen at −80 °C. The aortic sinus was sectioned into 10 μm-thick slices using a cryostat (Leica, CM3050s, Nussloch, Germany). Plaque staining and quantification were performed as described above. Hematoxylin and eosin (H&E) staining and Masson’s trichrome staining were conducted on aortic sinus sections to analyze necrotic core area and collagen deposition, respectively. The necrotic core was defined as the cell-free area within plaques in H&E-stained sections.
2.5. IPGTT and ITT
Glucose and insulin tolerance were assessed in mice after 13–14 weeks on the AMLN diet. For the IPGTT, mice were fasted for 16 h and then injected intraperitoneally with a glucose solution (0.15 g/mL) (Sangon; A501991) at a dose of 1.5 g/kg body weight. Blood glucose levels were measured via tail vein sampling at 0, 15, 30, 45, 60, 90, and 120 min post-injection using blood glucose meter (Viva check; NB-loT, Hangzhou, China).
For the ITT, mice were fasted for 4 h and injected intraperitoneally with an insulin solution (0.05 U/mL) (Humalog; VL7516) at a dose of 0.5 U/kg body weight. Blood glucose levels were measured via tail vein sampling at the same time points as described for the IPGTT.
2.6. Liver TC and TG Analysis
Approximately 100 mg of liver tissue was weighed and placed in a microcentrifuge tube. Nine hundred microliters of isopropanol and grinding beads were added, and the tissue was homogenized using an automated grinder (Jingxin, JXFSTPRP-24, Shanghai, China). The homogenate was centrifuged at 12,000× g for 10 min at 4 °C, and the supernatant was collected for analysis. Liver TC and TG levels were measured using the Total Cholesterol (TC) Colorimetric Assay Kit (Elabscience; E-BC-K109-M) and the Triglyceride (TG) Colorimetric Assay Kit (Elabscience; E-BC-K261-M), respectively, following the manufacturer’s instructions.
2.7. Immunofluorescence Staining
Aortic sinus cryosections were allowed to equilibrate to room temperature for 30 min and then rehydrated in phosphate-buffered saline (PBS) for 5–10 min. Sections were permeabilized and blocked using a solution containing 5% goat serum and 0.1% Triton X-100 for 30 min. Primary antibodies against CD68 (BIORAD, MCA1957GA) were diluted and applied to the sections, followed by overnight incubation at 4 °C. Unbound antibodies were washed away with PBS, and sections were incubated with fluorescent secondary antibodies (Alexa Fluor goat anti-rat 488, no. A48255) for 1 h in the dark. Finally, sections were mounted using an anti-fade mounting medium containing DAPI (Beyotime Biotechnology) to counterstain nuclei. Images were acquired using a Leica Confocal Microscope (Leica, TCS SP8 X, Wetzlar, Germany).
2.8. Statistical Analysis
All data were tested for normality using the Shapiro-Wilk test and for homogeneity of variance using the Brown-Forsythe test. Unpaired t-test were applied to data meeting these assumptions. Welch’s t-test was used for normally distributed data with unequal variances, and the Mann-Whitney test for non-normally distributed data. Statistical analyses were performed using GraphPad Prism 9.0 software (GraphPad Software, San Diego, CA, USA). Data are presented as mean ± standard deviation (SD), and error bars in graphs represent SD, with p < 0.05 regarded as statistically significant.
3. Results
3.1. Apoe−/− Mice Showed Minimal Sex Difference in Atherosclerosis
Previous studies have reported that in regular chow-fed Apoe−/− mice, males develop more aortic plaques than females with age, potentially due to estrogen-mediated regulation of macrophage cholesterol efflux [18]. However, conflicting evidence suggests that female Apoe−/− mice exhibit worse vascular endothelial cell function and develop more atherosclerosis, particularly when fed a proatherogenic Western diet [19]. To further investigate whether a high-fat, high-cholesterol diet exacerbates atherosclerosis in females and to explore sex-specific metabolic and atherosclerotic characteristics, we conducted atherosclerosis modeling in both 8-week-old male and female Apoe−/− mice fed an AMLN diet for 20 weeks.
Body composition analysis revealed that while male mice consistently had higher body weights than females, they showed a non-significant trend toward lower fat mass (9.46 ± 3.46% vs. 11.43 ± 2.77%, p = 0.0947) (Figure 1a). Random blood glucose levels were higher in males compared to females (8.31 ± 1.64 mmol/L vs. 5.47 ± 1.07 mmol/L, p = 0.0003) (Figure 1a). Glucose tolerance and insulin sensitivity tests conducted at 13–14 weeks showed females demonstrated better glucose tolerance and insulin sensitivity than males (Figure 1b). Lipid profiling after 20 weeks indicated that males had significantly higher levels of TC (14.95 ± 1.16 mmol/L vs. 11.24 ± 1.06 mmol/L, p < 0.0001), TG (2.58 ± 0.51 mmol/L vs. 1.75 ± 0.31 mmol/L, p = 0.0005), LDL-cholesterol (3.33 ± 0.26 mmol/L vs. 2.35 ± 0.32 mmol/L, p < 0.0001) and HDL-cholesterol (8.72 ± 0.88 mmol/L vs. 6.44 ± 0.65 mmol/L, p < 0.0001) compared to females (Figure 1c). However, females showed significantly higher liver TC (57.85 ± 9.69 mmol/g vs. 45.53 ± 8.51 mmol/g, p = 0.0094) and TG (45.81 ± 6.13 mmol/g vs. 32.33 ± 6.31 mmol/g, p = 0.0002) levels compared to males (Figure 1c). Analysis of immune cell composition in the blood revealed males had lower neutrophil percentages (43.56 ± 7.30% vs. 53.70 ± 9.12%, p = 0.0213) but higher lymphocyte percentages (49.44 ± 7.43% vs. 39.84 ± 8.36%, p = 0.0219) relative to females, with no sex difference in monocyte levels (7 ± 0.76% vs. 6.46 ± 1.16%, p = 0.3955) (Figure 1d).
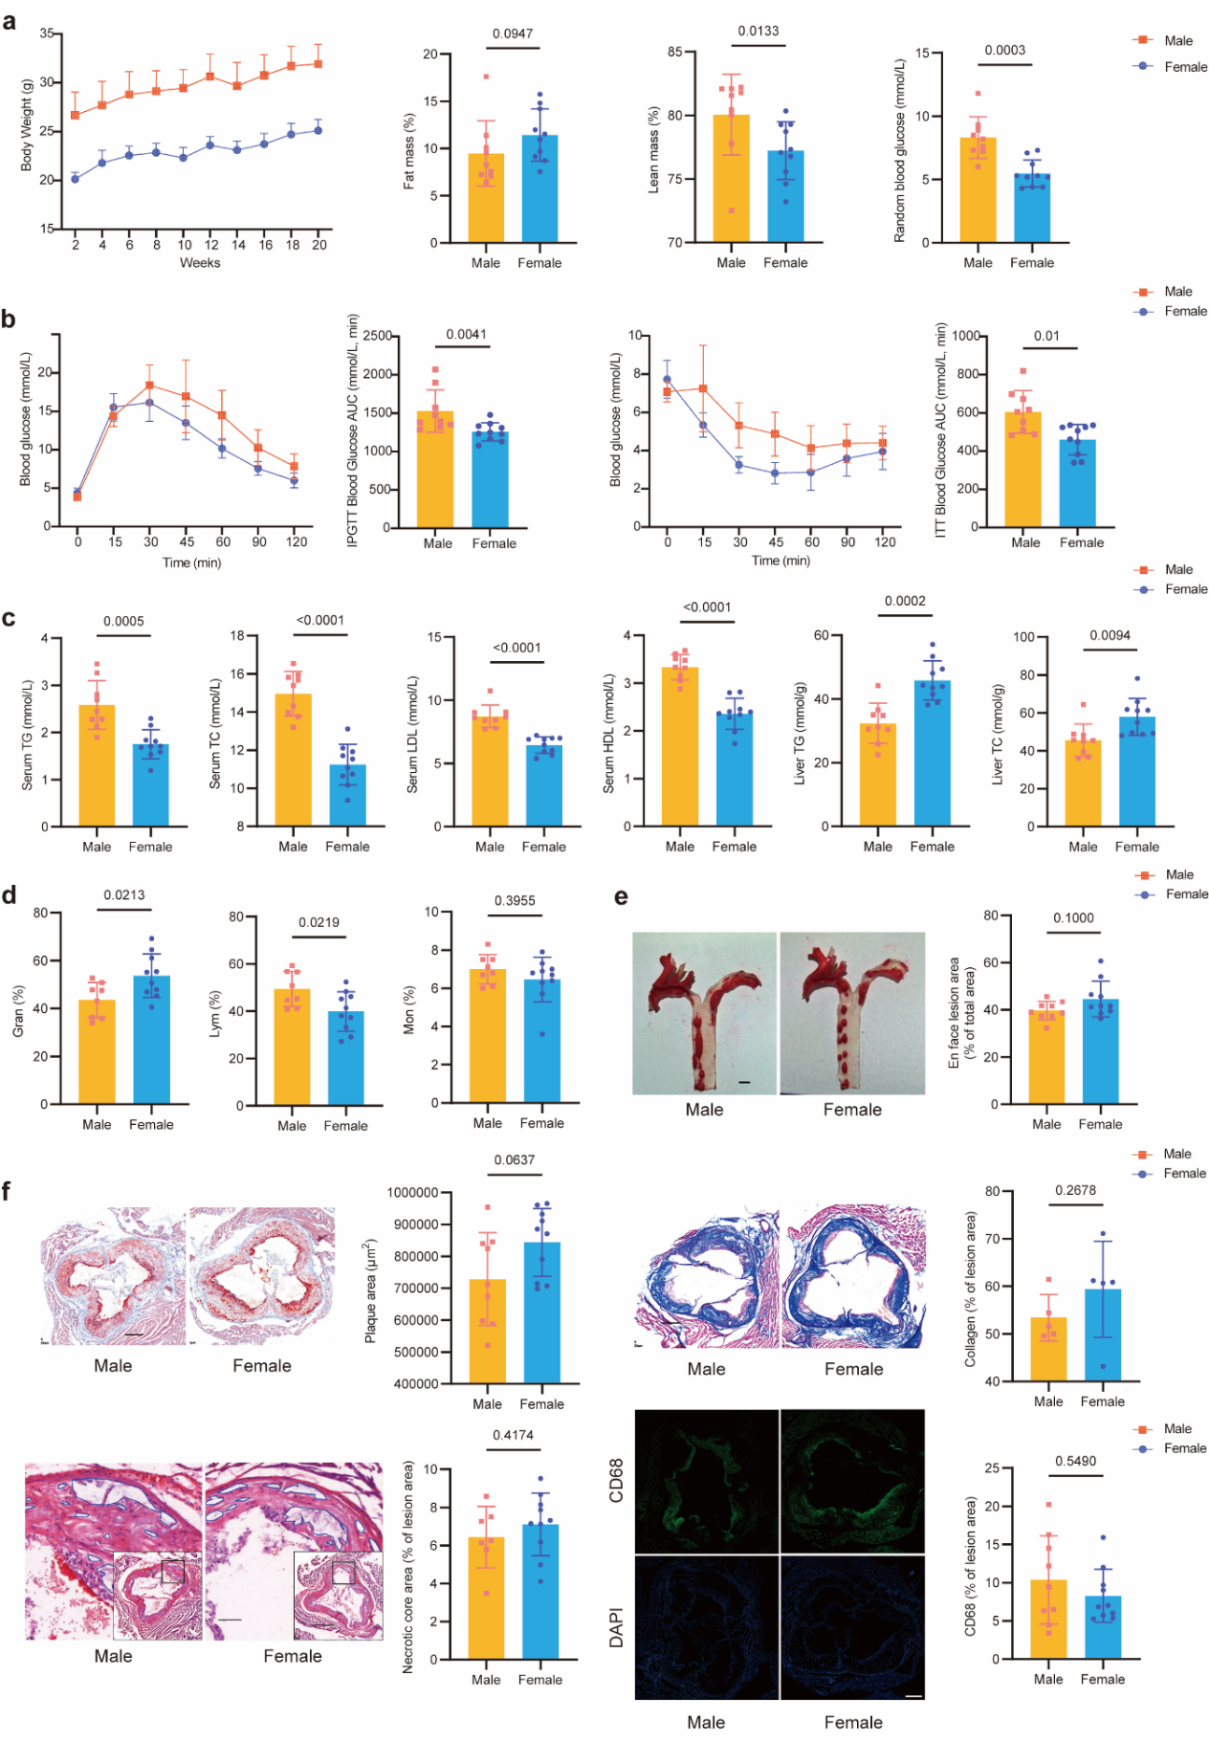
Oil Red O staining of the aorta revealed that, contrary to the lipid and metabolic profiles, males didn’t have larger whole aortic plaque areas than females (39.67 ± 3.96% vs. 44.58 ± 7.55%, p = 0.1000) (Figure 1e). Similar results were observed in aortic sinus sections (728,490 ± 145,456 μm2 vs. 843,727 ± 106,711 μm2, p = 0.0637), with females exhibited a non-significant tendency toward larger plaques (Figure 1f). Additionally, statistical analysis of necrotic core area (6.43 ± 1.61% vs. 7.1 ± 1.64%, p = 0.4174), collagen content (53.42 ± 4.88% vs. 59.4 ± 10.1%, p = 0.2678) and macrophage infiltration (10.38 ± 5.79% vs. 8.28 ± 3.45%, p = 0.5490) didn’t show any sex differences (Figure 1f).
3.2. The Ldlr−/− Male Mice Exhibits Larger Whole Aortic Plaques than Females
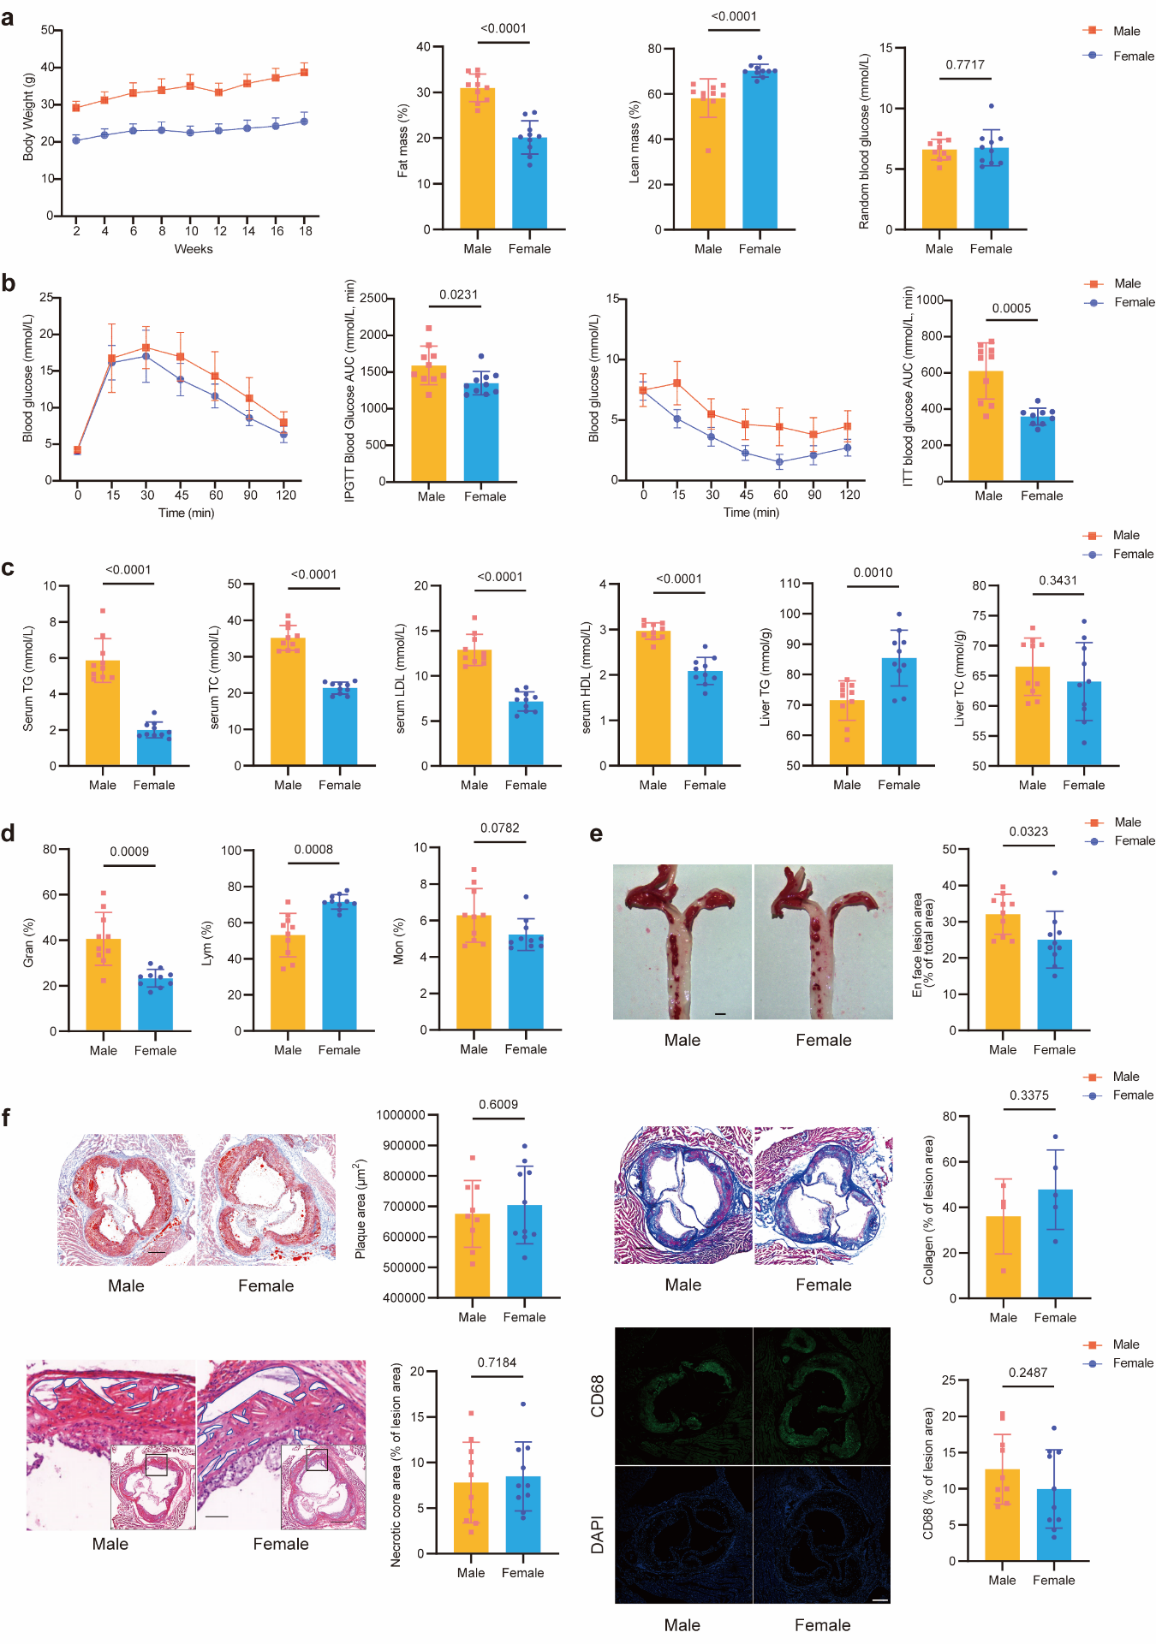
After 20 weeks of modeling, unlike Apoe−/− mice, male Ldlr−/− mice had significantly higher body fat mass than females (30.99 ± 3.02% vs. 20.16 ± 3.63%, p < 0.0001) (Figure 2a). Although random blood glucose levels (6.6 ± 0.85 mmol/L vs. 6.76 ± 1.48 mmol/L, p = 0.7717) showed no significant differences between sexes (Figure 2a), glucose tolerance and insulin sensitivity tests conducted at 13–14 weeks revealed that females had better glucose tolerance and insulin sensitivity than males (Figure 2b).
Similar to Apoe−/− mice, lipid profiling indicated males had significantly higher levels of TC (35.16 ± 3.4 mmol/L vs. 21.36 ± 1.63 mmol/L, p < 0.0001), TG (5.86 ± 1.22 mmol/L vs. 1.99 ± 0.44 mmol/L, p < 0.0001), LDL-cholesterol (12.88 ± 1.71 mmol/L vs. 7.16 ± 1.07 mmol/L, p < 0.0001) and HDL-cholesterol (2.96 ± 0.18 mmol/L vs. 2.08 ± 0.29 mmol/L, p < 0.0001) compared to females (Figure 2c), and females again showed greater hepatic TG accumulation (85.41 ± 9.16 mmol/g vs. 71.46 ± 6.51 mmol/g, p = 0.001), but not TC (64.03 ± 6.46 mmol/g vs. 66.5 ± 4.74 mmol/g, p = 0.3431) (Figure 2c). Interestingly, the leukocyte profile in Ldlr−/− mice contrasted with Apoe−/− mice: males had higher neutrophil (40.63 ± 11.55% vs. 23.29 ± 3.87%, p = 0.0009) and lower lymphocyte percentages (53.09 ± 12.03% vs. 71.48 ± 4.02%, p = 0.0008) compared to females, with a non-significant increase in monocytes (6.28 ± 1.47% vs. 5.23 ± 0.86%, p = 0.0782) (Figure 2d).
Consistent with these findings, whole aortic plaque area was significantly greater in male Ldlr−/− mice (32.06 ± 5.51% vs. 25.04 ± 7.82%, p = 0.0323) (Figure 2e), though aortic sinus plaque characteristics including area (675,333 ± 109,424 μm2 vs. 704,539 ± 127,329 μm2, p = 0.6009), collagen content (36.03 ± 16.48% vs. 47.80 ± 17.44%, p = 0.3375), necrotic core size (7.8 ± 4.42% vs. 8.47 ± 3.8%, p = 0.7184), and macrophage infiltration (12.69 ± 4.82% vs. 9.95 ± 5.4%, p = 0.2487) showed no sex-based differences (Figure 2f).
4. Discussion
Sex is an important biological variable in preclinical animal-based atherosclerosis research. However, to the best of our knowledge, the comparative analysis of both sexes in two widely used mouse models of atherosclerosis in one study has not been conducted yet. In this study, we demonstrate that the development of atherosclerosis exhibits distinct patterns of sexual dimorphism between Apoe−/− and Ldlr−/− mouse models. In Apoe−/− mice, females develop a non-significant greater atherosclerotic burden than males. In contrast, Ldlr−/− males displayed increased whole aortic plaque area compared to females. Our study carries important implications in vascular biology research, which provide unequivocal evidence in support of including both male and female mice in preclinical atherosclerosis research studies.
Our findings are consistent with a previous comparative study involving both sexes of mice, in which Apoe−/− mice similarly exhibited smaller atherosclerotic plaques in males compared to females, observed in both the aortic arch and sinus, with no difference in relative necrotic core area [20]. However, Apoe−/− male mice exhibited higher plasma lipid levels and lower insulin sensitivity, suggesting that lipid and metabolic profiles are not the key determinants of atherosclerotic lesion formation in this model. Existing literature supports the protective role of androgens in Apoe−/− mice. Wang et al. demonstrated that testosterone supplementation in castrated males reduced atherosclerotic plaque formation [21], and Luo et al. identified that androgens exert cardioprotective effects by activating ADTRP transcription, thereby modulating monocyte adhesion [22]. Additionally, studies have reported that female Apoe−/− mice may exhibit an enhanced immune response to oxidized low-density lipoprotein induced by estrogens, which could contribute to accelerated atherosclerosis development [23]. Therefore, sex hormones may represent one of key factors contributing to sex-based differences in atherosclerosis in Apoe−/− mice. Furthermore, previous studies have demonstrated that endothelial dysfunction contributes to the sex differences in atherosclerosis observed in Apoe−/− mice [19,24], with females exhibiting more pronounced inflammation, apoptosis, oxidative stress, and impaired endothelium-dependent vasorelaxation compared to males [19]. However, endothelium-dependent relaxation was not assessed in this study due to sample insufficiency. This represents a study limitation which can be addressed by future studies aiming to provide a functional correlate between ex vivo vascular reactivity studies to the anatomical plaque area.
Moreover, following feeding with the AMLN diet—a model for metabolic dysfunction-associated steatohepatitis (MASH)—female Apoe−/− mice exhibited significantly greater hepatic lipid accumulation than their male counterparts. Given that hepatic steatosis can accelerate atherosclerosis both directly and indirectly by exacerbating dyslipidemia, inducing insulin resistance, and promoting systemic inflammation and oxidative stress [25], and given the established epidemiological link between metabolic dysfunction-associated steatotic liver disease (MASLD) and subclinical atherosclerosis [26,27], it might be possible that sex differences in hepatic lipid accumulation may contribute to the sexual dimorphism in atherosclerosis observed in Apoe−/− mice. However, the precise nature of this association and causality warrants further investigation.
In contrast to previous studies using high-fat diets in Ldlr−/− mice [8,9,28], feeding with the AMLN diet—rich in trans-fatty acids, fructose, and cholesterol—markedly altered both the lipid profile and the sex differences in atherosclerosis. As suggested by Mansukhani et al. [28], a high-cholesterol diet may be a key driver of this shift, consistent with findings from Tangirala et al. [29], where a 1% high-cholesterol diet also resulted in more severe atherosclerosis in male Ldlr−/− mice. However, for Apoe−/− mice, the sex differences in the lipid profile were not altered by different dietary interventions. For instance, the findings from Shin et al. using a high-fat diet [19] are consistent with those of the present study using an AMLN diet. These findings suggest that metabolism in Ldlr−/− mice is highly sensitive to dietary lipid composition, which can shape atherosclerotic outcomes in a sex-dependent manner.
In summary, murine models exhibit strain-dependent sexual dimorphism in atherosclerosis development, with divergent sex differences observed between Apoe−/− and Ldlr−/− mice. According to current reports, the sex differences in atherosclerosis observed in Apoe−/− mice may be attributed to a combination of factors, including differences in sex hormones, endothelial cell function, and immune responses. In contrast, the sexual dimorphism in Ldlr−/− mice might be associated with dietary lipid composition, which subsequently influences plasma lipid levels in a sex-specific manner. This study primarily summarizes findings from previous research and offers related inferences, without conducting experimental validation of the underlying mechanisms, which constitutes its main limitation. Our study comparatively analyzed the level of glucose, lipid profile, plaque area, plaque composition in Apoe−/− and Ldlr−/− mice, thus providing a useful resource for future atherosclerosis research. Moreover, it underscores the necessity of considering mouse strains, dietary composition, and the inclusion of both sexes when validating the efficacy of anti-atherosclerosis therapies. Furthermore, future therapeutic approaches should be tailored based on sex-specific characteristics in lipid metabolism and immune responses.
Author Contributions
Conceptualization, S.X.; Investigation, Y.Z.; Writing—original draft, Y.Z.; Writing—review and editing, L.W., Y.H., H.S., S.X., J.W. and B.C.B. All authors have read and agreed to the published version of the manuscript.
Funding
This study was also supported by USTC Research Funds of the Double First-Class Initiative (YD9110002089) and the Research Funds of Centre for Leading Medicine and Advanced Technologies of IHM (2025IHM01040).
Institutional Review Board Statement
All animal procedures were conducted in the SPF Animal Husbandry Facility at the Laboratory Animal Centre, School of Life Sciences, University of Science and Technology of China (USTC). The study protocol was approved by the USTC Institutional Animal Care and Use Committee (Ethics Approval Number: USTCACUC27120124102).
Informed Consent Statement
Not applicable.
Data Availability Statement
All supporting data are available within the article.
Acknowledgments
We thank Christoph J Binder (Medical University of Vienna, Vienna, Austria) for insightful comments and discussion.
Conflicts of Interest
Given the role as Editorial Board Member, Suowen Xu had no involvement in the peer review of this paper and had no access to information regarding its peer-review process. Full responsibility for the editorial process of this paper was delegated to another editor of the journal. The authors declare no conflict of interest.
Use of AI and AI-Assisted Technologies
No AI tools were utilized for this paper.
References
- 1.
Haider, A.; Bengs, S.; Luu, J.; et al. Sex and gender in cardiovascular medicine: Presentation and outcomes of acute coronary syndrome. Eur. Heart J. 2020, 41, 1328–1336. https://doi.org/10.1093/eurheartj/ehz898.
- 2.
Man, J.J.; Beckman, J.A.; Jaffe, I.Z. Sex as a Biological Variable in Atherosclerosis. Circ. Res. 2020, 126, 1297–1319. https://doi.org/10.1161/circresaha.120.315930.
- 3.
Gurgoglione, F.L.; Solinas, E.; Pfleiderer, B.; et al. Coronary atherosclerotic plaque phenotype and physiopathologic mechanisms: Is there an influence of sex? Insights from intracoronary imaging. Atherosclerosis 2023, 384, 117273. https://doi.org/10.1016/j.atherosclerosis.2023.117273.
- 4.
Nour, J.; Bonacina, F.; Norata, G.D. Gonadal sex vs genetic sex in experimental atherosclerosis. Atherosclerosis 2023, 384, 117277. https://doi.org/10.1016/j.atherosclerosis.2023.117277.
- 5.
Sakkers, T.R.; Mili, E.; Winter, H.; et al. Atherosclerotic Fibrous Plaques in Women Present ECM Remodeling Linked to TGF-β. Circ. Res. 2026, 138, e327624. https://doi.org/10.1161/circresaha.125.327624.
- 6.
Manfrini, O.; Tousoulis, D.; Antoniades, C.; et al. Sex and gender differences in coronary pathophysiology and ischaemic heart disease: A Scientific Statement of the ESC Working Group on Coronary Pathophysiology & Microcirculation, the Association for Acute CardioVascular Care, and the European Association of Percutaneous Cardiovascular Interventions of the ESC. Eur. Heart J. 2026, 47, 2727–2749. https://doi.org/10.1093/eurheartj/ehaf1059.
- 7.
Roeters van Lennep, J.E.; Öörni, K.; Binder, C.J.; et al. The essential role of sex and gender in atherosclerosis research: A statement from the Editorial Board of Atherosclerosis and Executive Committee of the European Atherosclerosis Society. Atherosclerosis 2025, 407, 120403. https://doi.org/10.1016/j.atherosclerosis.2025.120403.
- 8.
Liu, S.L.; Bajpai, A.; Hawthorne, E.A.; et al. Cardiovascular protection in females linked to estrogen-dependent inhibition of arterial stiffening and macrophage MMP12. JCI Insight 2019, 4, e122742. https://doi.org/10.1172/jci.insight.122742.
- 9.
AlSiraj, Y.; Chen, X.; Thatcher, S.E.; et al. XX sex chromosome complement promotes atherosclerosis in mice. Nat. Commun. 2019, 10, 2631. https://doi.org/10.1038/s41467-019-10462-z.
- 10.
Xue, R.; Liu, J.; Wang, H.; et al. Sex-Specific Prognostic Differences Between CACS and Lp(a) in Atherosclerotic Cardiovascular Disease Events: The MESA Study. Circ. Cardiovasc. Imaging 2025, 18, e018413. https://doi.org/10.1161/circimaging.125.018413.
- 11.
Chait, A.; Wang, S.; Goodspeed, L.; et al. Sexually Dimorphic Relationships among Saa3 (Serum Amyloid A3), Inflammation, and Cholesterol Metabolism Modulate Atherosclerosis in Mice. Arterioscler. Thromb. Vasc. Biol. 2021, 41, e299–e313. https://doi.org/10.1161/atvbaha.121.316066.
- 12.
Sukhavasi, K.; Mocci, G.; Ma, L.; et al. Single-cell RNA sequencing reveals sex differences in the subcellular composition and associated gene-regulatory network activity of human carotid plaques. Nat. Cardiovasc. Res. 2025, 4, 412–432. https://doi.org/10.1038/s44161-025-00628-y.
- 13.
Cittadini, C.; Straface, E.; Campesi, I.; et al. Sex differences in human umbilical vein endothelial cells following ox-LDL injury. Biol. Sex. Differ. 2026, 17, 48. https://doi.org/10.1186/s13293-026-00845-5.
- 14.
Ilyas, I.; Little, P.J.; Liu, Z.; et al. Mouse models of atherosclerosis in translational research. Trends Pharmacol. Sci. 2022, 43, 920–939. https://doi.org/10.1016/j.tips.2022.06.009.
- 15.
Jiang, S.Y.; Yang, X.; Yang, Z.; et al. Discovery of an insulin-induced gene binding compound that ameliorates nonalcoholic steatohepatitis by inhibiting sterol regulatory element-binding protein-mediated lipogenesis. Hepatology 2022, 76, 1466–1481. https://doi.org/10.1002/hep.32381.
- 16.
Su, M.; Zhao, W.; Jiang, H.; et al. Endothelial IGFBP6 suppresses vascular inflammation and atherosclerosis. Nat. Cardiovasc. Res. 2025, 4, 145–162. https://doi.org/10.1038/s44161-024-00591-0.
- 17.
Sun, L.; Leng, R.; Liu, M.; et al. Endothelial MICU1 protects against vascular inflammation and atherosclerosis by inhibiting mitochondrial calcium uptake. J. Clin. Invest. 2025, 135, e181928. https://doi.org/10.1172/jci181928.
- 18.
Liu, M.; Zhang, W.; Li, X.; et al. Impact of age and sex on the development of atherosclerosis and expression of the related genes in apoE deficient mice. Biochem. Biophys. Res. Commun. 2016, 469, 456–462. https://doi.org/10.1016/j.bbrc.2015.11.064.
- 19.
Shin, J.; Hong, J.; Edwards-Glenn, J.; et al. Unraveling the Role of Sex in Endothelial Cell Dysfunction: Evidence from Lineage Tracing Mice and Cultured Cells. Arterioscler. Thromb. Vasc. Biol. 2024, 44, 238–253. https://doi.org/10.1161/atvbaha.123.319833.
- 20.
Stuttgen, G.M.; Bobek, J.; Penoske, R.; et al. FFAR4 Deficiency Increases Necrotic Cores in Advanced Lesions of ApoE−/− Mice—Brief Report. Arterioscler. Thromb. Vasc. Biol. 2025, 45, 675–682. https://doi.org/10.1161/atvbaha.124.322371.
- 21.
Wang, Q.; Han, J.; Liang, Z.; et al. FSH Is Responsible for Androgen Deprivation Therapy-Associated Atherosclerosis in Mice by Exaggerating Endothelial Inflammation and Monocyte Adhesion. Arterioscler. Thromb. Vasc. Biol. 2024, 44, 698–719. https://doi.org/10.1161/atvbaha.123.319426.
- 22.
Luo, C.; Pook, E.; Tang, B.; et al. Androgen inhibits key atherosclerotic processes by directly activating ADTRP transcription. Biochim. Biophys. Acta Mol. Basis Dis. 2017, 1863, 2319–2332. https://doi.org/10.1016/j.bbadis.2017.06.015.
- 23.
Caligiuri, G.; Nicoletti, A.; Zhou, X.; et al. Effects of sex and age on atherosclerosis and autoimmunity in apoE-deficient mice. Atherosclerosis 1999, 145, 301–308. https://doi.org/10.1016/s0021-9150(99)00081-7.
- 24.
Zhou, X.; Teng, B.; Mustafa, S.J. Sex Difference in Coronary Endothelial Dysfunction in Apolipoprotein E Knockout Mouse: Role of NO and A2A Adenosine Receptor. Microcirculation 2015, 22, 518–527. https://doi.org/10.1111/micc.12222.
- 25.
Badmus, O.O.; Hinds, T.D., Jr.; Stec, D.E. Mechanisms Linking Metabolic-Associated Fatty Liver Disease (MAFLD) to Cardiovascular Disease. Curr. Hypertens. Rep. 2023, 25, 151–162. https://doi.org/10.1007/s11906-023-01242-8.
- 26.
Ma, G.; Xu, G.; Huang, H. Correlation between metabolic dysfunction-associated steatotic liver disease and subclinical coronary atherosclerosis in eastern China. Diabetol. Metab. Syndr. 2025, 17, 16. https://doi.org/10.1186/s13098-025-01577-z.
- 27.
Kapuria, D.; Takyar, V.K.; Etzion, O.; et al. Association of Hepatic Steatosis with Subclinical Atherosclerosis: Systematic Review and Meta-Analysis. Hepatol. Commun. 2018, 2, 873–883. https://doi.org/10.1002/hep4.1199.
- 28.
Mansukhani, N.A.; Wang, Z.; Shively, V.P.; et al. Sex Differences in the LDL Receptor Knockout Mouse Model of Atherosclerosis. Artery Res. 2017, 20, 8–11. https://doi.org/10.1016/j.artres.2017.08.002.
- 29.
Tangirala, R.K.; Rubin, E.M.; Palinski, W. Quantitation of atherosclerosis in murine models: Correlation between lesions in the aortic origin and in the entire aorta, and differences in the extent of lesions between sexes in LDL receptor-deficient and apolipoprotein E-deficient mice. J. Lipid Res. 1995, 36, 2320–2328.

This work is licensed under a Creative Commons Attribution 4.0 International License.

 Suite 4002 Level 4, 447 Collins Street, Melbourne, Victoria 3000, Australia
 General Inquiries: info@sciltp.com