
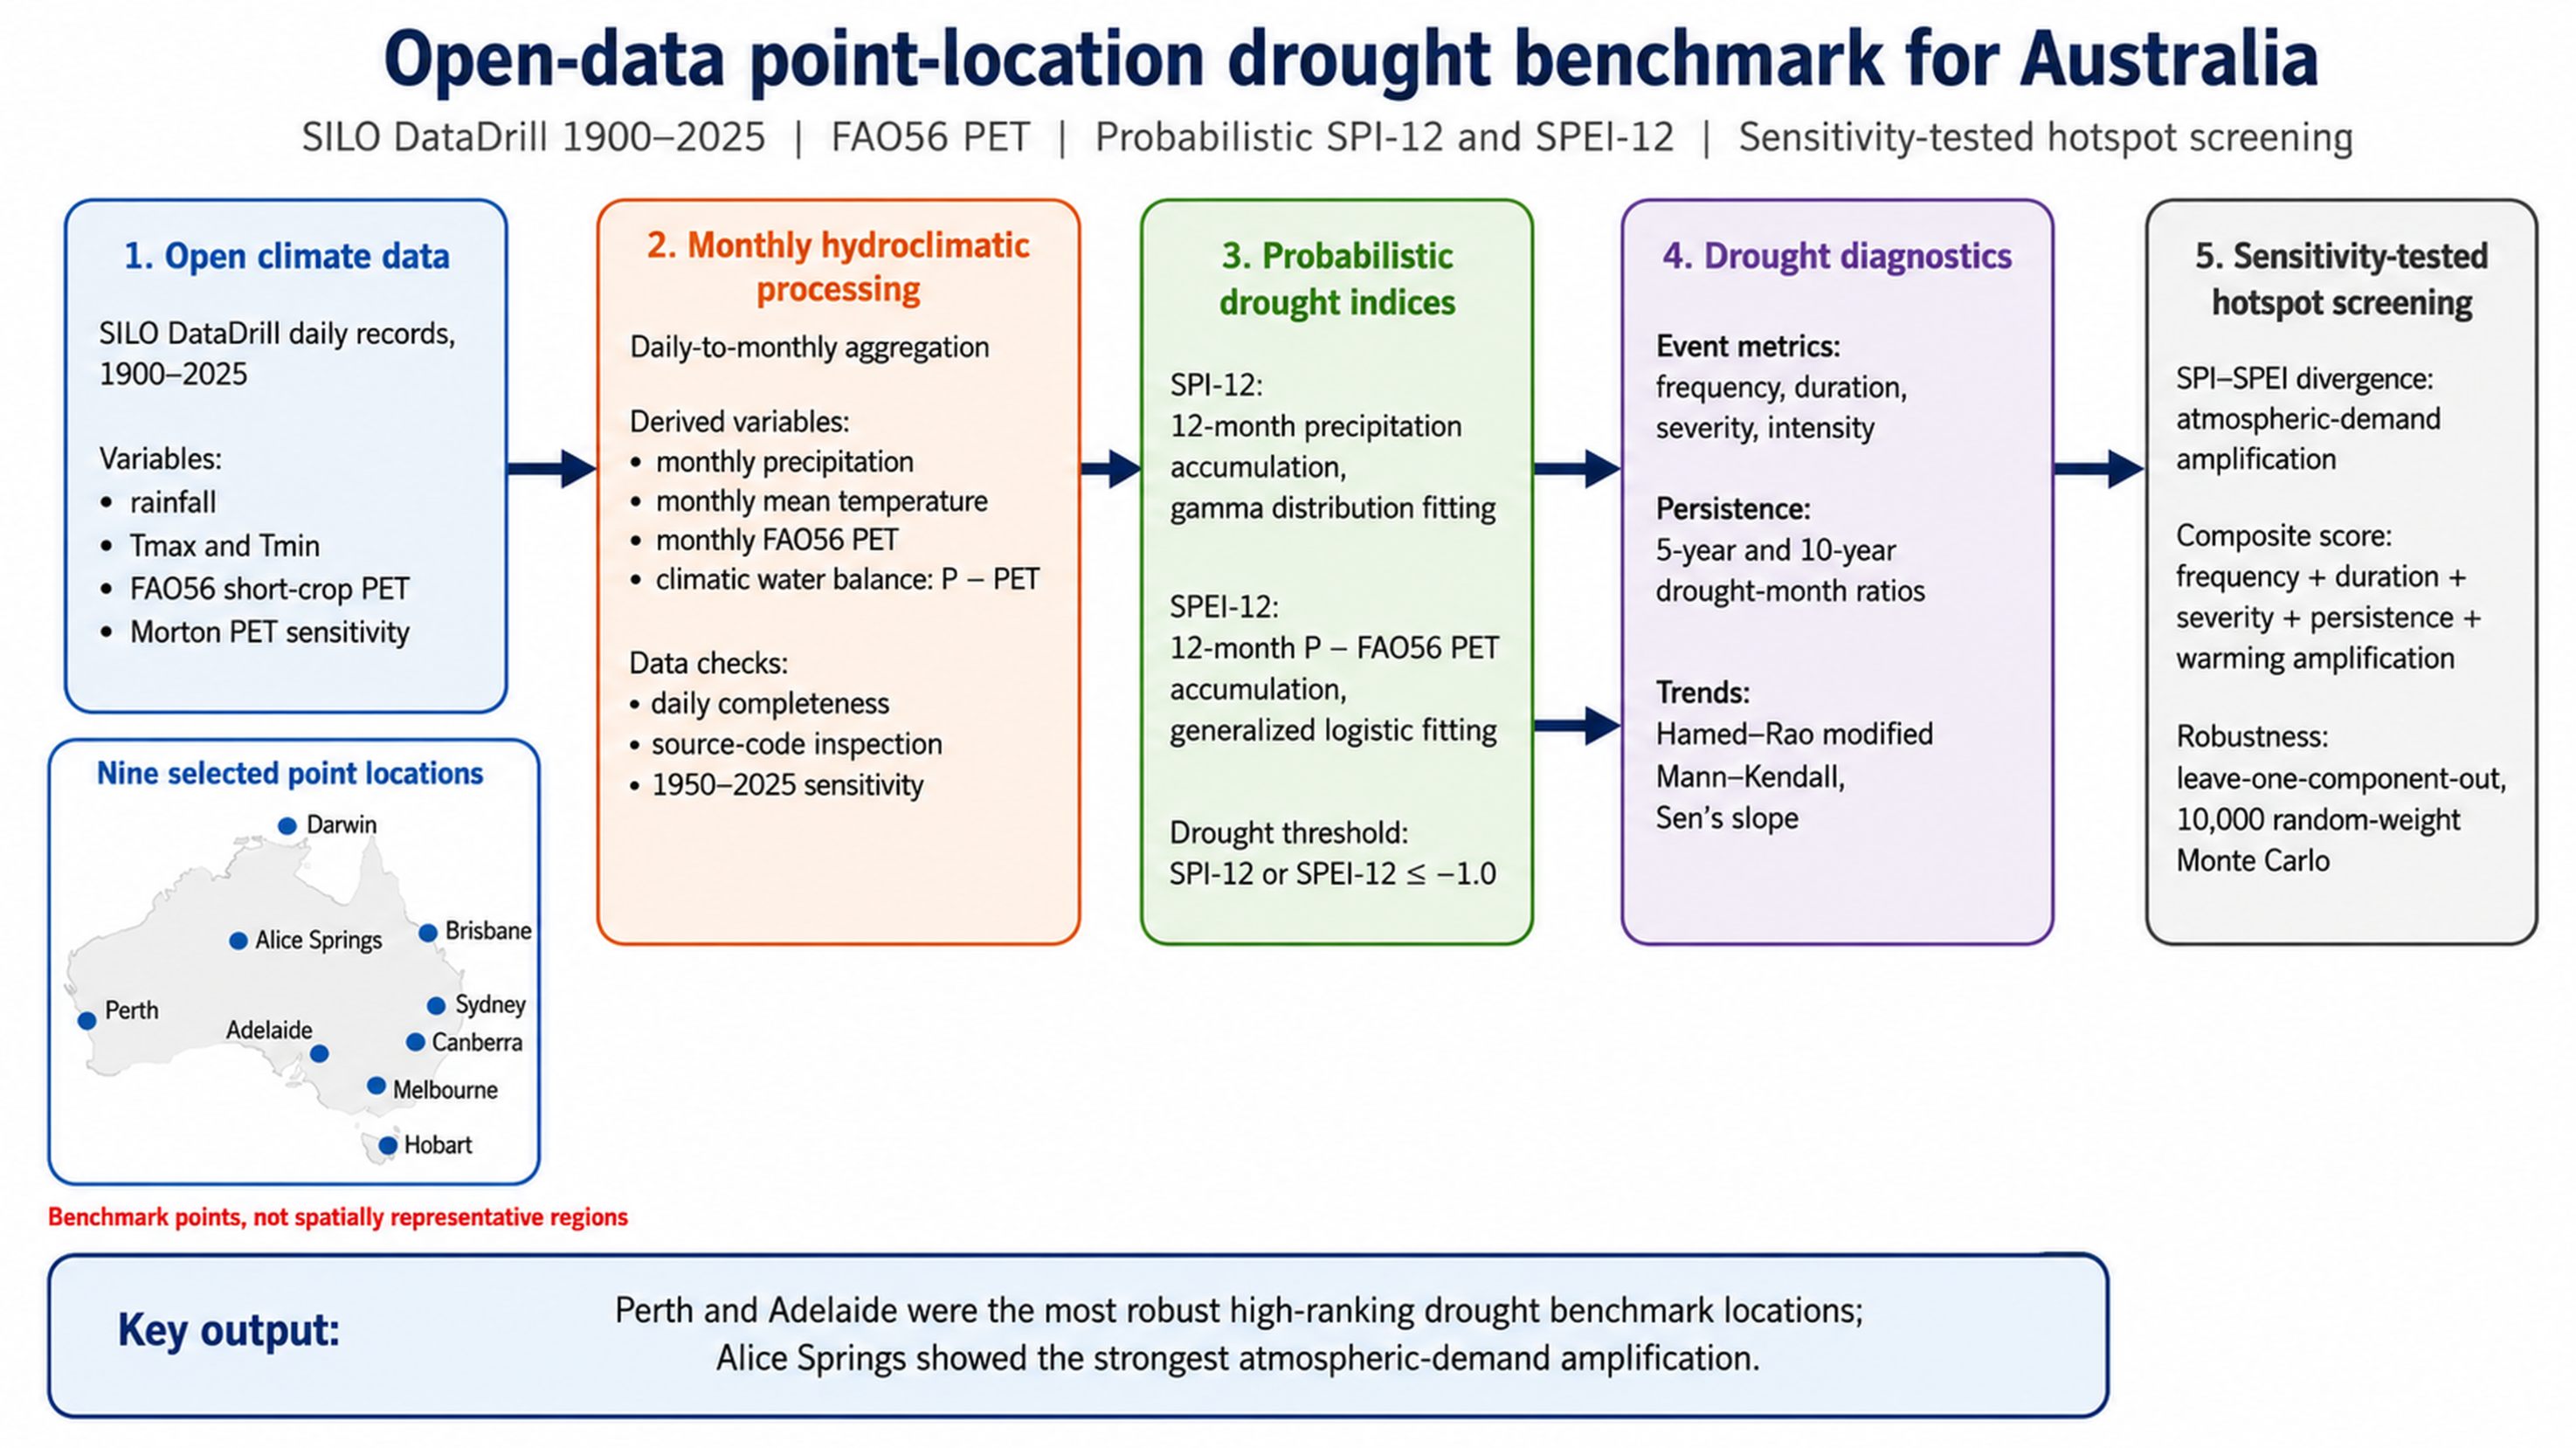
Australia’s drought risk is shaped by both precipitation deficits and atmospheric water demand, but long-term comparisons are sensitive to drought-index formulation, PET choice, and hotspot-weighting assumptions. This study develops an open-data point-location drought benchmark for Australia using daily SILO DataDrill records from nine selected locations for 1900–2025. Monthly hydroclimatic variables were derived from rainfall, temperature, SILO FAO56 short-crop reference PET, and Morton PET for sensitivity analysis. SPI-12 was calculated from 12-month precipitation accumulation using gamma distribution fitting, while SPEI-12 was calculated from 12-month climatic water balance using generalized logistic distribution fitting. Drought-event metrics, persistence indicators, Hamed–Rao modified Mann–Kendall and Sen’s slope tests, SPI–SPEI divergence metrics, and a sensitivity-tested composite hotspot score were used to compare drought behaviour among locations. Results showed strong cross-location differences in drought frequency, duration, severity, persistence, and warming-amplified drought stress. FAO56 PET improved the physical consistency of water-balance drought assessment relative to temperature-only PET formulations. SPI–SPEI divergence was most pronounced at Alice Springs, whereas Perth and Adelaide showed the most robust high hotspot ranks due to combined severity, persistence, and recent drought-month concentration. Random-weight sensitivity analysis confirmed Perth and Adelaide as the most stable top-ranked locations. The study provides a transparent benchmark for point-location drought comparison and a foundation for future gridded drought-risk assessment in Australia.
- Open Access
- Article
An Open-Data Point-Location Drought Benchmark for Australia: SPI–SPEI Variability, Persistence, and Warming-Amplification Analysis Using SILO Data
Author Information
Received: 12 Jun 2026 | Revised: 21 Jul 2026 | Accepted: 22 Jul 2026 | Published: 28 Jul 2026
Abstract
Graphical Abstract
Keywords
drought | SPI | SPEI | SILO DataDrill | FAO56 potential evapotranspiration | drought hotspot screening
References
- 1.
Palmer, W.C. Meteorological Drought, Research Paper no. 45; US Weather Bureau: Washington, DC, USA, 1965; p. 58.
- 2.
McKee, T.B.; Doesken, N.J.; Kleist, J. The relationship of drought frequency and duration to time scales. In Proceedings of the 8th Conference on Applied Climatology, Anaheim, CA, USA, 17–22 January 1993; pp 179–183.
- 3.
Mishra, A.K.; Singh, V.P. A review of drought concepts. J. Hydrol. 2010, 391, 202–216.
- 4.
Vicente-Serrano, S.M.; Beguería, S.; López-Moreno, J.I. A multiscalar drought index sensitive to global warming: The standardized precipitation evapotranspiration index. J. Clim. 2010, 23, 1696–1718.
- 5.
Kiem, A.S.; Johnson, F.; Westra, S.; et al. Natural hazards in Australia: Droughts. Clim. Chang. 2016, 139, 37–54.
- 6.
Zargar, A.; Sadiq, R.; Naser, B.; et al. A review of drought indices. Environ. Rev. 2011, 19, 333–349.
- 7.
Vicente-Serrano, S.M.; Beguería, S.; Lorenzo-Lacruz, J.; et al. Performance of drought indices for ecological, agricultural, and hydrological applications. Earth Interact. 2012, 16, 1–27.
- 8.
Dai, A. Increasing drought under global warming in observations and models. Nat. Clim. Chang. 2013, 3, 52–58.
- 9.
Dai, A. Drought under global warming: A review. Wiley Interdiscip. Rev. Clim. Chang. 2011, 2, 45–65.
- 10.
Trenberth, K.E.; Dai, A.; Van Der Schrier, G.; et al. Global warming and changes in drought. Nat. Clim. Chang. 2014, 4, 17–22.
- 11.
Naumann, G.; Alfieri, L.; Wyser, K.; et al. Global changes in drought conditions under different levels of warming. Geophys. Res. Lett. 2018, 45, 3285–3296.
- 12.
Dey, R.; Lewis, S.C.; Arblaster, J.M.; et al. A review of past and projected changes in Australia’s rainfall. Wiley Interdiscip. Rev. Clim. Chang. 2019, 10, e577.
- 13.
Westra, S.; White, C.J.; Kiem, A.S. Introduction to the special issue: Historical and projected climatic changes to Australian natural hazards. Clim. Chang. 2016, 139, 1–19.
- 14.
Quentin Grafton, R.; Chu, L.; Kingsford, R.T.; et al. Resilience to hydrological droughts in the northern Murray-Darling Basin, Australia. Philos. Trans. R. Soc. A Math. Phys. Eng. Sci. 2022, 380, 20210296.
- 15.
Verdon, D.C.; Franks, S.W. Indian Ocean sea surface temperature variability and winter rainfall: Eastern Australia. Water Resour. Res. 2005, 41, W09413.
- 16.
Verdon-Kidd, D.C.; Kiem, A.S. Nature and causes of protracted droughts in southeast Australia: Comparison between the Federation, WWII, and Big Dry droughts. Geophys. Res. Lett. 2009, 36, L22707.
- 17.
Kiem, A.; Verdon-Kidd, D. Towards understanding hydroclimatic change in Victoria, Australia–preliminary insights into the “Big Dry”. Hydrol. Earth Syst. Sci. 2010, 14, 433–445.
- 18.
Gallant, A.J.; Reeder, M.J.; Risbey, J.S.; et al. The characteristics of seasonal-scale droughts in Australia, 1911–2009. Int. J. Climatol. 2013, 33, 1658.
- 19.
Hoffmann, D.; Gallant, A.J.; Arblaster, J.M. Uncertainties in drought from index and data selection. J. Geophys. Res. Atmos. 2020, 125, e2019JD031946.
- 20.
Foley, J.C. Droughts in Australia, Review of Records from the Earliest Years of Settlement to 1955; Bureau of Meteorology: Melbourne, VIC, Australia, 1957.
- 21.
Gibbs, W.J.; Maher, J.V. Rainfall Deciles Drought Indicators; Bureau of Meteorology: Melbourne, Australia, 1967.
- 22.
Heathcote, R.L. Drought in Australia: A problem of perception. Geogr. Rev. 1969, 59, 175–194.
- 23.
Ummenhofer, C.C.; England, M.H.; McIntosh, P.C.; et al. What causes southeast Australia’s worst droughts? Geophys. Res. Lett. 2009, 36, L04706.
- 24.
Cai, W.; Van Rensch, P.; Cowan, T.; et al. Teleconnection pathways of ENSO and the IOD and the mechanisms for impacts on Australian rainfall. J. Clim. 2011, 24, 3910–3923.
- 25.
King, A.D.; Klingaman, N.P.; Alexander, L.V.; et al. Extreme rainfall variability in Australia: Patterns, drivers, and predictability. J. Clim. 2014, 27, 6035–6050.
- 26.
Holgate, C.; Van Dijk, A.; Evans, J.; et al. Local and remote drivers of southeast Australian drought. Geophys. Res. Lett. 2020, 47, e2020GL090238.
- 27.
Jin, C.; Reeder, M.J.; Gallant, A.J.; et al. A synoptic-dynamic view of the Millennium drought (2001–2009) in southeastern Australia. J. Geophys. Res. Atmos. 2024, 129, e2024JD041657.
- 28.
Holgate, C.M.; Falster, G.M.; Gillett, Z.E.; et al. Physical mechanisms of meteorological drought development, intensification and termination: An Australian review. Commun. Earth Environ. 2025, 6, 220.
- 29.
Zhang, W.; Mao, W.; Jiang, F.; et al. Tropical Indo-Pacific compounding thermal conditions drive the 2019 Australian extreme drought. Geophys. Res. Lett. 2021, 48, e2020GL090323.
- 30.
Laz, O.U.; Rahman, A.; Ouarda, T.B. Compound heatwave and drought hotspots and their trends in Southeast Australia. Nat. Hazards 2023, 119, 357–386.
- 31.
Van Dijk, A.I.; Beck, H.E.; Crosbie, R.S.; et al. The Millennium Drought in southeast Australia (2001–2009): Natural and human causes and implications for water resources, ecosystems, economy, and society. Water Resour. Res. 2013, 49, 1040–1057.
- 32.
Saft, M.; Western, A.W.; Zhang, L.; et al. The influence of multiyear drought on the annual rainfall-runoff relationship: An A ustralian perspective. Water Resour. Res. 2015, 51, 2444–2463.
- 33.
Austin, E.; Kiem, A.S.; Rich, J.; et al. How effectively do drought indices capture health outcomes? An investigation from rural Australia. Weather Clim. Soc. 2021, 13, 823–845.
- 34.
Timbal, B.; Drosdowsky, W. The relationship between the decline of Southeastern Australian rainfall and the strengthening of the subtropical ridge. Int. J. Climatol. 2013, 33, 1021–1034.
- 35.
McKay, R.C.; Boschat, G.; Rudeva, I.; et al. Can southern Australian rainfall decline be explained? A review of possible drivers. Wiley Interdiscip. Rev. Clim. Chang. 2023, 14, e820.
- 36.
Hawke, K.A.; Kala, J.; Foster, I.J. A Review of Drivers of Cool Season Rainfall in Southwest Western Australia. Wiley Interdiscip. Rev. Clim. Chang. 2025, 16, e70028.
- 37.
Cai, W.; Purich, A.; Cowan, T.; et al. Did climate change–induced rainfall trends contribute to the Australian millennium drought? J. Clim. 2014, 27, 3145–3168.
- 38.
Di Virgilio, G.; Evans, J.P.; Blake, S.A.; et al. Climate change increases the potential for extreme wildfires. Geophys. Res. Lett. 2019, 46, 8517–8526.
- 39.
Abram, N.J.; Henley, B.J.; Sen Gupta, A.; et al. Connections of climate change and variability to large and extreme forest fires in southeast Australia. Commun. Earth Environ. 2021, 2, 8.
- 40.
Tian, F.; Wu, J.; Liu, L.; et al. Exceptional drought across Southeastern Australia caused by extreme lack of precipitation and its impacts on NDVI and SIF in 2018. Remote Sens. 2019, 12, 54.
- 41.
Heidemann, H.; Cowan, T.; Henley, B.J.; et al. Variability and long-term change in Australian monsoon rainfall: A review. Wiley Interdiscip. Rev. Clim. Chang. 2023, 14, e823.
- 42.
Svoboda, M.; Hayes, M.; Wood, D. Standardized Precipitation Index: User Guide; World Meteorological Organization: Geneva, Switzerland, 2012.
- 43.
Stagge, J.H.; Tallaksen, L.M.; Gudmundsson, L.; et al. Candidate distributions for climatological drought indices (SPI and SPEI). Int. J. Climatol. 2015, 35, 4027–4040.
- 44.
Beguería, S.; Vicente-Serrano, S.M.; Reig, F.; et al. Standardized precipitation evapotranspiration index (SPEI) revisited: Parameter fitting, evapotranspiration models, tools, datasets and drought monitoring. Int. J. Climatol. 2014, 34, 3001–3023.
- 45.
Wang, H.; Pan, Y.; Chen, Y. Comparison of three drought indices and their evolutionary characteristics in the arid region of northwestern China. Atmos. Sci. Lett. 2017, 18, 132–139.
- 46.
Cammalleri, C.; Spinoni, J.; Barbosa, P.; et al. The effects of non-stationarity on SPI for operational drought monitoring in Europe. Int. J. Climatol. 2022, 42, 3418–3430.
- 47.
Mpelasoka, F.; Hennessy, K.; Jones, R.; et al. Comparison of suitable drought indices for climate change impacts assessment over Australia towards resource management. Int. J. Climatol. 2008, 28, 1283–1292.
- 48.
Kirono, D.G.; Kent, D.M. Assessment of rainfall and potential evaporation from global climate models and its implications for Australian regional drought projection. Int. J. Climatol. 2011, 31, 1295–1308.
- 49.
Feng, P.; Liu, D.L.; Wang, B.; et al. Projected changes in drought across the wheat belt of southeastern Australia using a downscaled climate ensemble. Int. J. Climatol. 2019, 39, 1041–1053.
- 50.
Kirono, D.G.; Round, V.; Heady, C.; et al. Drought projections for Australia: Updated results and analysis of model simulations. Weather Clim. Extrem. 2020, 30, 100280.
- 51.
Eccles, R.; Trancoso, R.; Syktus, J.; et al. High-resolution downscaled CMIP6 drought projections for Australia. Hydrol. Earth Syst. Sci. 2025, 29, 4689–4710.
- 52.
Cheung, K.K.; Herold, N.; Ji, F.; et al. Evaluation and projection of drought frequency, intensity and duration over Australia. Int. J. Climatol. 2025, 45, e70058.
- 53.
Sheffield, J.; Wood, E.F. Projected changes in drought occurrence under future global warming from multi-model, multi-scenario, IPCC AR4 simulations. Clim. Dyn. 2008, 31, 79–105.
- 54.
Johnson, F.; White, C.J.; van Dijk, A.; et al. Natural hazards in Australia: Floods. Clim. Chang. 2016, 139, 21–35.
- 55.
Falster, G.M.; Wright, N.M.; Abram, N.J.; et al. Potential for historically unprecedented Australian droughts from natural variability and climate change. Hydrol. Earth Syst. Sci. 2024, 28, 1383–1401.
- 56.
Jeffrey, S.J.; Carter, J.O.; Moodie, K.B.; et al. Using spatial interpolation to construct a comprehensive archive of Australian climate data. Environ. Model. Softw. 2001, 16, 309–330.
- 57.
Mann, H.B. Nonparametric tests against trend. Econom. J. Econom. Soc. 1945, 13, 245–259.
- 58.
Kendall, M.G.; Gibbons, J.D. Rank Correlation Methods; Hafner Pub: New York, NY, USA, 1962.
- 59.
Hamed, K.H.; Rao, A.R. A modified Mann-Kendall trend test for autocorrelated data. J. Hydrol. 1998, 204, 182–196.
- 60.
Sen, P.K. Estimates of the regression coefficient based on Kendall’s tau. J. Am. Stat. Assoc. 1968, 63, 1379–1389.


This work is licensed under a Creative Commons Attribution 4.0 International License.

 Suite 4002 Level 4, 447 Collins Street, Melbourne, Victoria 3000, Australia
 General Inquiries: info@sciltp.com