Guilu Bushen Pill (GLBSW) is a traditional Chinese medicine formulation recognized for its kidney-nourishing effects. According to traditional Chinese medicine theory, kidney health is closely linked to bone strength. This study aims to investigate the effects of GLBSW on osteoblast differentiation using SaoS-2 cells, as well as its therapeutic potential in an ovariectomy-induced osteoporosis (OVX) rat model. In vitro results indicate that GLBSW significantly promotes the differentiation of SaoS-2 cells, while in vivo experiments demonstrate its effectiveness in alleviating osteoporosis in OVX rats by enhancing bone mineral density (BMD), improving both the quantity and quality of bone trabeculae, and maintaining calcium and phosphorus levels in bone. Metabolomic analysis of serum metabolites suggests that the therapeutic effects of GLBSW may be associated with the modulation of pyruvate and arachidonic acid metabolism. In conclusion, these findings underscore the potential of GLBSW in the treatment of osteoporosis through the regulation of bone formation and energy metabolism.
- Open Access
- Article
The Effects and Mechanism of Guilu Bushen Pill in the Treatment of Osteoporosis Model in Ovariectomized Rats
- Ximing Peng 1,
- Junjie Huang 1,
- Peifang Lai 1,
- Xiaorong Zhang 1,
- Mingdeng Guan 1,
- Xin Hu 1,
- Yimeng Ma 1,
- Meiqi Ji 1,
- Haiyan Gong 1,
- Chunhong Li 1,
- Xiuping Chen 2,
- Huaqian Wang 1,*
Author Information
Received: 08 Oct 2024 | Revised: 18 Nov 2024 | Accepted: 19 Nov 2024 | Published: 27 Aug 2025
Abstract
Keywords
Guilu Bushen Pill | osteoporosis | metabolomics | ovariectomized rat
1.Introduction
Osteoporosis and related fractures are prevalent chronic metabolic bone conditions that significantly impact global health. Given the aging population, the proportion of individuals over 50 is predicted to increase from 24% in 2010 to 48% by 2050, correlating with a higher incidence of osteoporosis-related fractures in postmenopausal women [1]. This rising prevalence of osteoporosis has driven the expansion of the osteoporosis medication market [2]. Currently, pharmacological treatment is the primary therapeutic interventions, including calcium and vitamin D supplements, calcitonin, bisphosphonates, and estrogens. However, these treatments, particularly hormone therapy, are often associated with side effects, such as increased risks of myocardial infarction, gastrointestinal adverse reactions, endometrial hyperplasia, cancer, and thrombosis [3]. In comparison to conventional pharmaceuticals, traditional Chinese medicine shows greater efficacy in alleviating clinical symptoms by regulating metabolic processes, with fewer side effects and lower costs [4]. In preliminary investigations, three collagen-rich TCM formulations—Guilu Bushen Pill (GLBSW), Guilu Erxian Jiao, and Ejiao Huangqi Oral Solution—were assessed for clinical efficacy in treating osteoporosis [5]. The meta-analysis revealed significant improvements in patients receiving either single TCM formulations or a combination with conventional osteoporosis treatments, compared to those without pharmacological intervention. Furthermore, these patients showed increased bone mineral density (BMD) relative to untreated individuals [6].
In recent years, metabolomics has become an essential tool for assessing the therapeutic effects of various TCMs [7,8]. By collecting comprehensive metabolite profiles, metabolomic fingerprinting enables the analysis of all metabolic reactions after stimulation, providing valuable insights into the underlying mechanisms of action.
This study seeks to explore the anti-osteoporotic effects and mechanisms of Guilu Bushen Pill (GLBSW) using liquid chromatography-mass spectrometry.
2.Materials and Methods
2.1.Materials
The GLBSW was prepared by extracting a mixture of sixteen traditional Chinese medicine components (Semen Cuscutae 51 g, Epimedii Folium (steamed) 43 g, Dipsaci Radix (steamed with salt) 43 g, Cynomorii Herba (steamed) 51 g, Cibotii Rhizoma (steamed with salt) 64 g, Ziziphi Spinosae Semen (fried) 43 g, Polygoni Multiflori Radix 64 g, Glycyrrhizae Radix et Rhizoma 21 g, Citri Reticulatae Pericarpium 21 g, Colla Cornus Cervi (fried) 9 g, Rehmanniae Radix 64 g, Carapax et Plastrum Testudinis Colla (fried) 13 g, Rosae Laevigatae Fructus (steamed) 51 g, Astragali praeparata cum Melle Radix 43 g, Yams (fried) 43 g, Rubi Fructus (steamed) 85 g), which was a gift from Guangzhou Baiyunshan Huacheng Pharmaceutical Limited Company. (Guangzhou, China). 17 β-estradiol (E2) was purchased from Bayer Healthcare Co., Ltd. (Shanghai, China). Enzyme-linked immunosorbent assay (ELISA) kits for PY, TRAP, ALP and BGP were purchased from Nanjing Jiancheng Bioengineering Institute (Nanjing, China).
2.2.Cell Culture
SaoS-2 cells obtained from ATCC (Manassas, VA, USA) were cultured in DMEM, supplemented with 10% fetal bovine serum, 100 units/mL penicillin and 0.1 mg/mL streptomycin. The cells were incubated in a humidified atmosphere of 95% air and 5% CO2 at 37 ℃.
2.3.ALP Activity Assay
The SaoS-2 cells (5 × 10⁵ cells/well) were initially seeded into 6-well plates. After a 24-h incubation period, the cell medium was replaced with osteogenic induction medium, containing 50 μg/L ascorbic acid, 10 mmol/L β-sodium glycerophosphate, 1 × 10⁻⁸ mmol/L dexamethasone, and with different concentrations of GLBSW. After 7 days of incubation, the cell supernatant was collected for alkaline phosphatase (ALP) activity detection using the alkaline phosphatase assay kit (Nanjing Jiancheng Bioengineering Institute, Nanjing, China). The protein content was determined using the Bicinchoninic Acid Assay kit (Beyotime Biotechnology Co. Ltd., Shanghai, China).
2.4.Alizarin Red S Staining
The cultivation and intervention of SaoS-2 cells for Alizarin Red staining (ARS) followed procedures similar to those detailed in Section 2.3. After 14 days of induction, the cells were fixed with 4% paraformaldehyde (PFA) for 20 min. ARS staining was performed using the ARS kit (Sigma-Aldrich, St. Louis, MI, USA) to observe the formation of mineralized nodules.
2.5.Animal Experiment
Eight-month-old SD female rats were obtained from the Guangdong Medical Laboratory Animal Center (Guangdong, China), with an animal certificate number of SYXK (YUE) 2017-0215. The animal experiments were conducted at the Animal Experiment Center of Guangdong Pharmaceutical University (Guangzhou, China). All the animal experiments involved had been reviewed and approved by the ethics committee of experimental animals of Guangdong University of Technology (Ethical review number: JN. No GDUTXS2023219).
After two weeks of adaptive feeding, the SD female rats (n = 42) underwent either bilateral laparotomy (sham, n = 7) or bilateral ovariectomy (OVX, n = 35). All rats were located in padded cages where they could have free access to chow and water (temperature: 18–22 ℃, humidity: 40–60%). One week after surgery, the rats were randomly assigned to five groups, each comprising seven rats and the groups received different treatments by intragastric administration: OVX group, estradiol valerate (EV) group, 0.81 g/kg/d GLBSW-L group, 1.62 g/kg/d GLBSW-M group and 3.24 g/kg/d GLBSW-H group. The rats were sacrificed after 3 months of treatment.
2.6.Bone Micro-CT Measurement
The left femurs were fixed with 10% formalin for bone parameter analysis and then were scanned using a high-resolution cone beam micro-CT system (Milabs B.V). The X-ray energy level was set to 50 kV and 200 μA, with a pixel size of 8.9 μm, an aluminum (Al) filter thickness of 0.5 mm, and a rotation angle of 180° with rotation steps of 0.4°. Datasets were reconstructed using MILabs Rec 10.16 software and were further evaluated using IMALYTICS software. After that, the region of interest (ROI) in the bone tissue, located 1.0 mm distal to the growth plate, was selected for analysis.
2.7.Bone Mechanical Parameters Measurement
After micro-CT measurement, the femur bone tissues in each group were evaluated using a three-point-bending test, which was conducted with an electronic dynamic and static testing machine (Hegewald & Peschke, Nossen, Germany), with a 20 mm gap.
2.8.Analysis of Bone Mineral Contents
The fractured femurs were collected and the ash contents in the bones were measured using the muffle furnace method. The contents of inorganic matter (calcium and phosphorus) in bone ash were measured by EDTA titration and UV photometer respectively [9].
2.9.Serum Bone Turnover Markers Detection
Blood samples were collected. Subsequently, serum concentrations of ALP (MLBIO, Shanghai, China, ml003150-2), BGP (MLBIO, Shanghai, China, ml002883-2), PY (MLBIO, Shanghai, China, ml003150-2), and TRAP (MLBIO, Shanghai, China, ml306452-2) were measured using a microplate reader (Thermo, Multiskan, FC, Waltham, MA, USA) according to the protocols listed on the ELISA kits.
2.10.Hematoxylin and Eosin Staining
The femur tissues were fixed in formalin for 24 h, then immersed in a 10% EDTA solution (pH 8.0) and subsequently placed on a lab shaker at 4 ℃. After 8 weeks, the softened femur tissues underwent gradient ethanol dehydration, initially immersed in xylene for 25 min and subsequently in wax for 3 h. The tissues were then paraffin-embedded and sectioned at 5 μm thickness by Leica tissue slicer (Leica RM2235, Wetzlar, Germany). Finally, hematoxylin and eosin (H&E) staining was performed according to the manufacturer’s protocol.
2.11.Metabolomic Analysis
High-resolution accurate mass liquid chromatography-tandem mass spectrometry (HRAM LC-MS/MS) analysis was conducted using a Thermo Scientific Ultimate 3000 RSLC and a Q Exactive Orbitrap desktop high-resolution mass spectrometer was performed using Thermo Scientific Xcalibur software. Compound Discoverer 2.1 along with the mzCloud database (Thermo Scientific, http://www.mzcloud.org, accessed on 20 February 2023) was used for data analysis. Liquid-phase separation employed a Hypersil GOLD C18 column (100 × 2.1 mm, 1.9 μm) at a column temperature of 40 ℃, with an injection volume of 2 μL and a flow rate of 0.3 mL/min. The mobile phase consisted of phase A (0.1% formic acid in water) and phase B (methanol solution). The gradient elution sequence was set as follows: 0 min, 2% B; 2 min, 2% B; 5 min, 20% B; 12 min, 95% B; 17 min, 95% B; 17.1 min, 2% B; 20 min, 22% B. For MS/MS analysis, the ion source was set to H-ESI, and the scan mode was Full MS-ddMS2, with a full MS scan range of 70–1000 m/z, resolution of 70,000 FWHM, and an isolation width of 0.4 m/z. The mass spectrometer spray voltage ranged from 4.0 to 3.0 kV, capillary temperature was set at 320 ℃, and the auxiliary gas heater temperature was set at 350 ℃. Additionally, Compound Discoverer 2.1 and SIMCA software 14.1 were utilized for data analysis to measure statistical differences in metabolites between groups. MetaboAnalyst (accessible athttps://www.metaboanalyst.ca/) was employed to enrich the metabolic pathways of significantly different metabolites.
2.12.Statistical analysis
The data are presented as the mean ± standard deviation. Student’s t-test was employed to analyze intergroup differences, and one-way analysis of variance (ANOVA) using GraphPad Prism 7 (GraphPad Software, La Jolla, CA, USA) was utilized to compare data among more than two groups. The significance level was set at p < 0.05.
3.Results
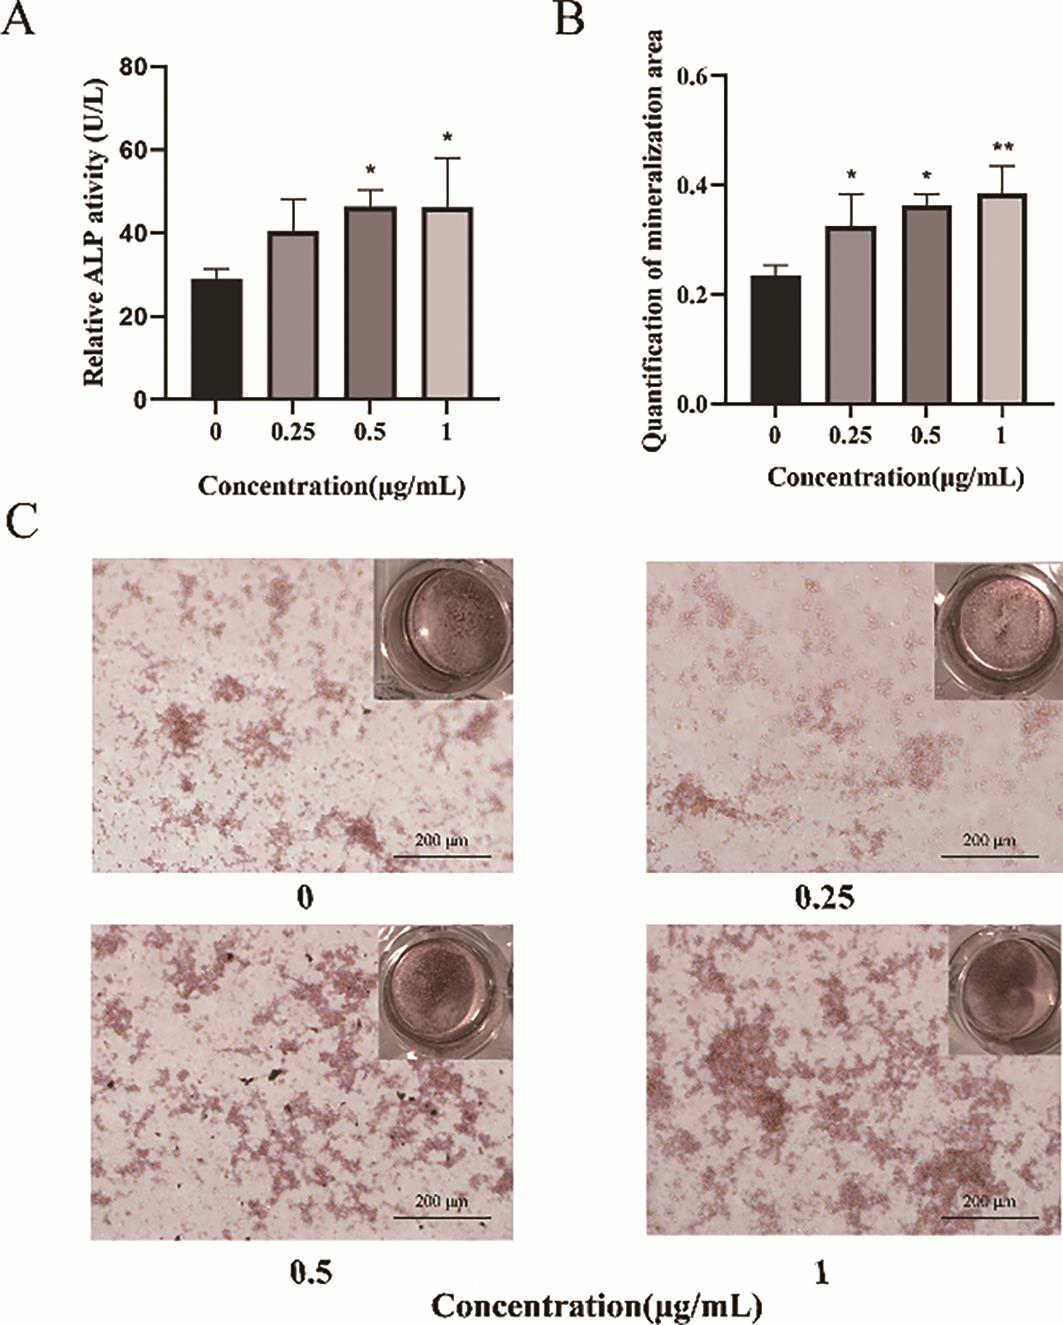
3.1.GLBSW Promotes the Osteogenic Differentiation Activity of SaoS-2 Cells
Alkaline phosphatase (ALP) plays a critical role in bone formation. To evaluate the effects of GLBSW on the osteogenic differentiation of SaoS-2 cells, ALP activity was measured after 72 h of treatment. As shown in Figure 1A, ALP activity significantly increased (p < 0.05) in cells treated with 0.5 and 1 μg/mL of GLBSW, indicating a marked enhancement of osteogenic differentiation. To further investigate the relationship between ALP activity and bone mineralization, SaoS-2 cells underwent 14 days of osteogenic induction, followed by the assessment of calcium deposition. As depicted in Figure 1B, treatment with 1 μg/mL of GLBSW significantly enhanced calcium deposition (p < 0.01). Additionally, Figure 1C illustrates a positive correlation between calcium deposition and GLBSW concentration, confirming the role of GLBSW in promoting mineralization in SaoS-2 cells.
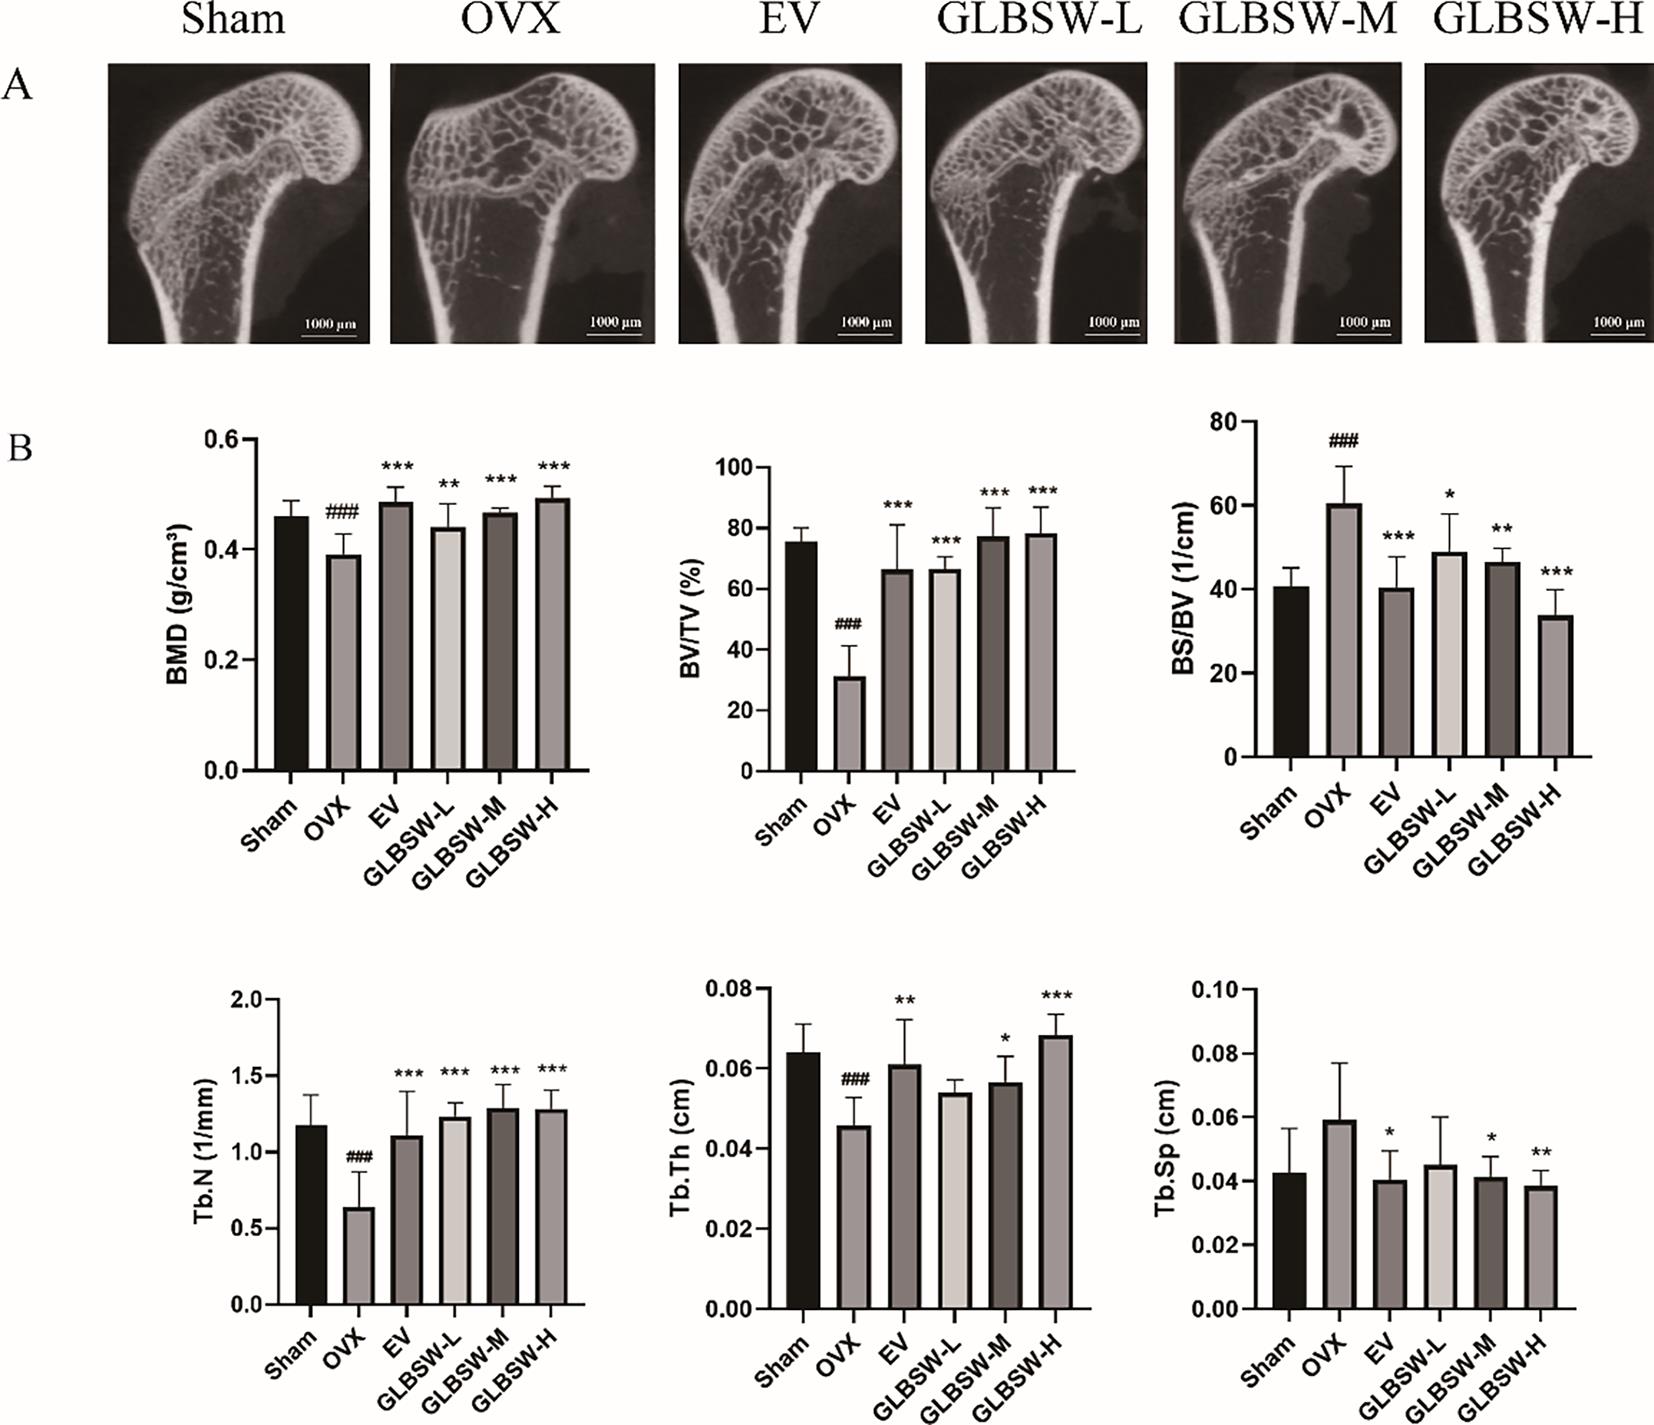
3.2.GLBSW Enhance Bone Mass in OVX
To investigate the effects of GLBSW in an ovariectomy-induced osteoporosis (OVX) model, we utilized micro-computed tomography (Micro-CT) to assess bone quality and therapeutic outcomes. As shown in Figure 2A, the OVX group exhibited trabecular bone loss, characterized by deteriorated trabecular network and decreased cortical bone thickness compared to the sham group. In contrast, both the EV and GLBSW groups demonstrated substantial improvements in bone structure. Figure 2B indicates that Micro-CT analysis of the OVX group showed significant decreases in bone volume fraction (BV/TV), bone mineral density (BMD), trabecular number (Tb.N) and trabecular thickness (Tb.Th) (p < 0.001), along with marked increases in bone surface density (BS/TV) and trabecular separation (Tb.Sp) (p < 0.001), confirming the successful induction of the osteoporosis model. Notably, both the EV and GLBSW groups showed improvements in these parameters, including increases in cortical bone thickness post-treatment compared to the OVX group. The results showed that the GLBSW has similar efficacy to EV which is already used in the clinical treatment of osteoporosis. These findings suggest that GLBSW has the potential to enhance BMD and improve trabecular bone structure. In summary, GLBSW has the ability to improve the trabecular bone structure in OVX rats.
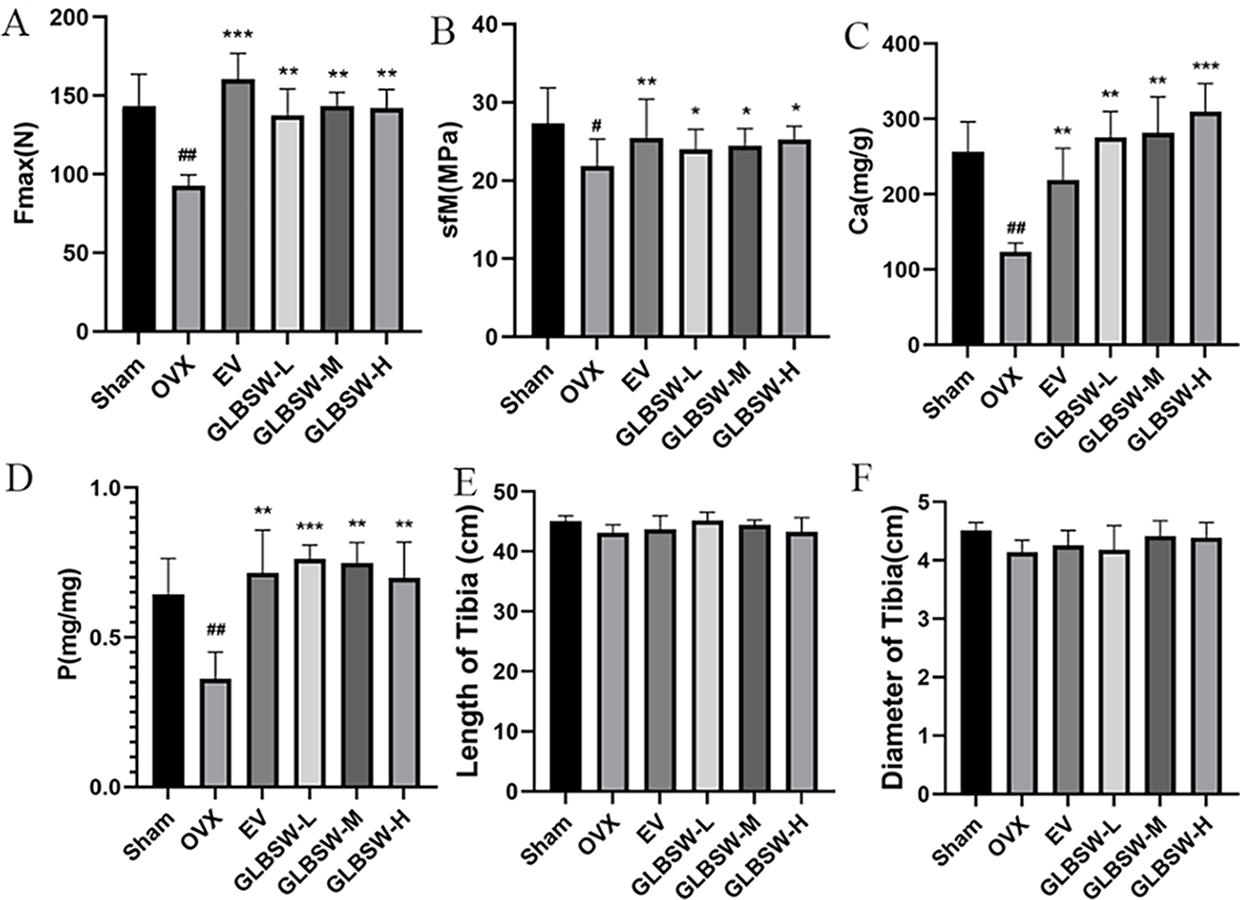
3.3.GLBSW Improves Tibia Strength and Enhances Calcium and Phosphorus Content in OVX
As shown in Figure 3A,B, both the maximum tensile stress and flexural strength of the tibia were significantly higher in the EV and GLBSW groups compared to the OVX group. Additionally, Figure 3C,D illustrate that calcium and phosphorus levels in the tibiae of the sham, EV, and GLBSW groups were restored to normal levels, which were reduced in the OVX group. Furthermore, Figure 3E,F indicate no significant differences in the length and diameter of the rat femurs among the groups.
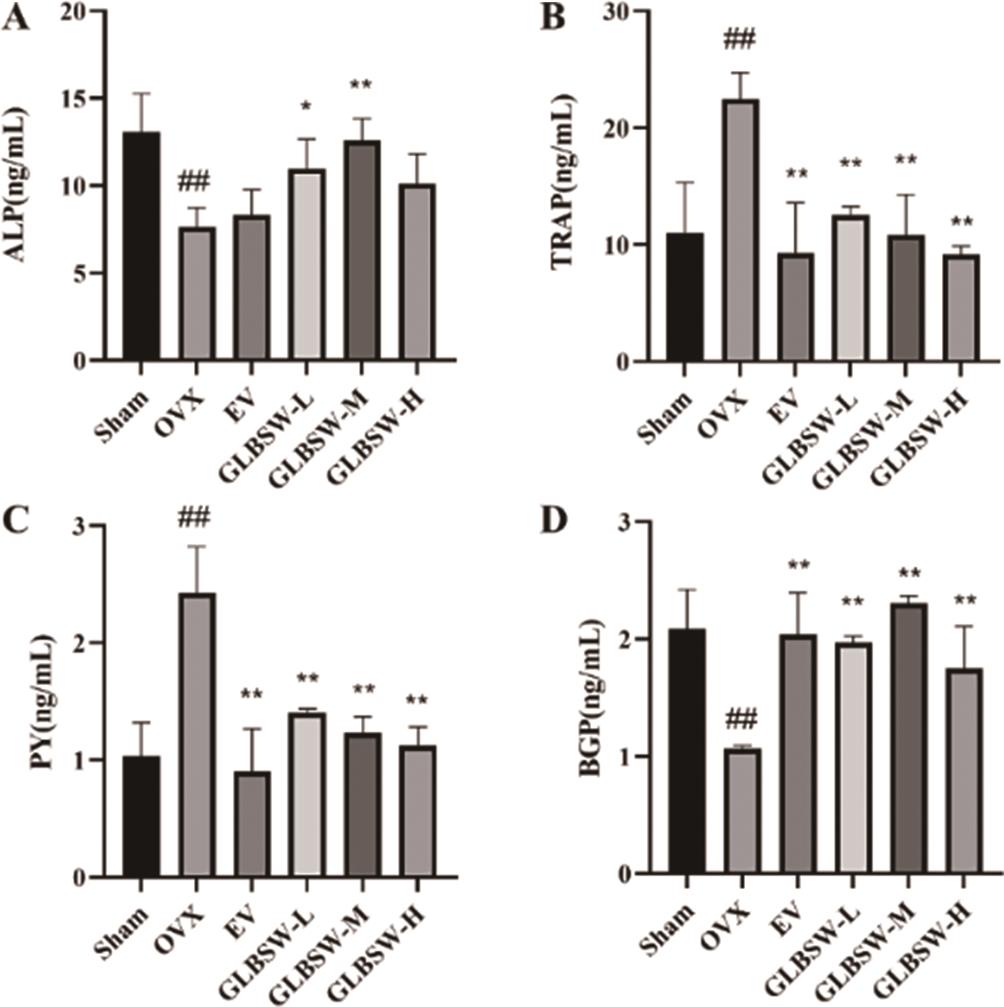
3.4.Effect of GLBSW on Bone Metabolism in Serum of Rats
PY reflects bone resorption and collagen degradation, while TRAP indicates bone resorption, and ALP and BGP are biomarkers of bone formation. As shown in Figure 4, serum levels of TRAP and PY significantly decreased in all treatment groups compared to the OVX group, while BGP and ALP levels significantly increased. These findings suggest that GLBSW not only promotes bone formation and inhibits bone resorption, thereby mitigating osteoporosis, but also reduces serum collagen degradation related to collagen absorption from GLBSW.
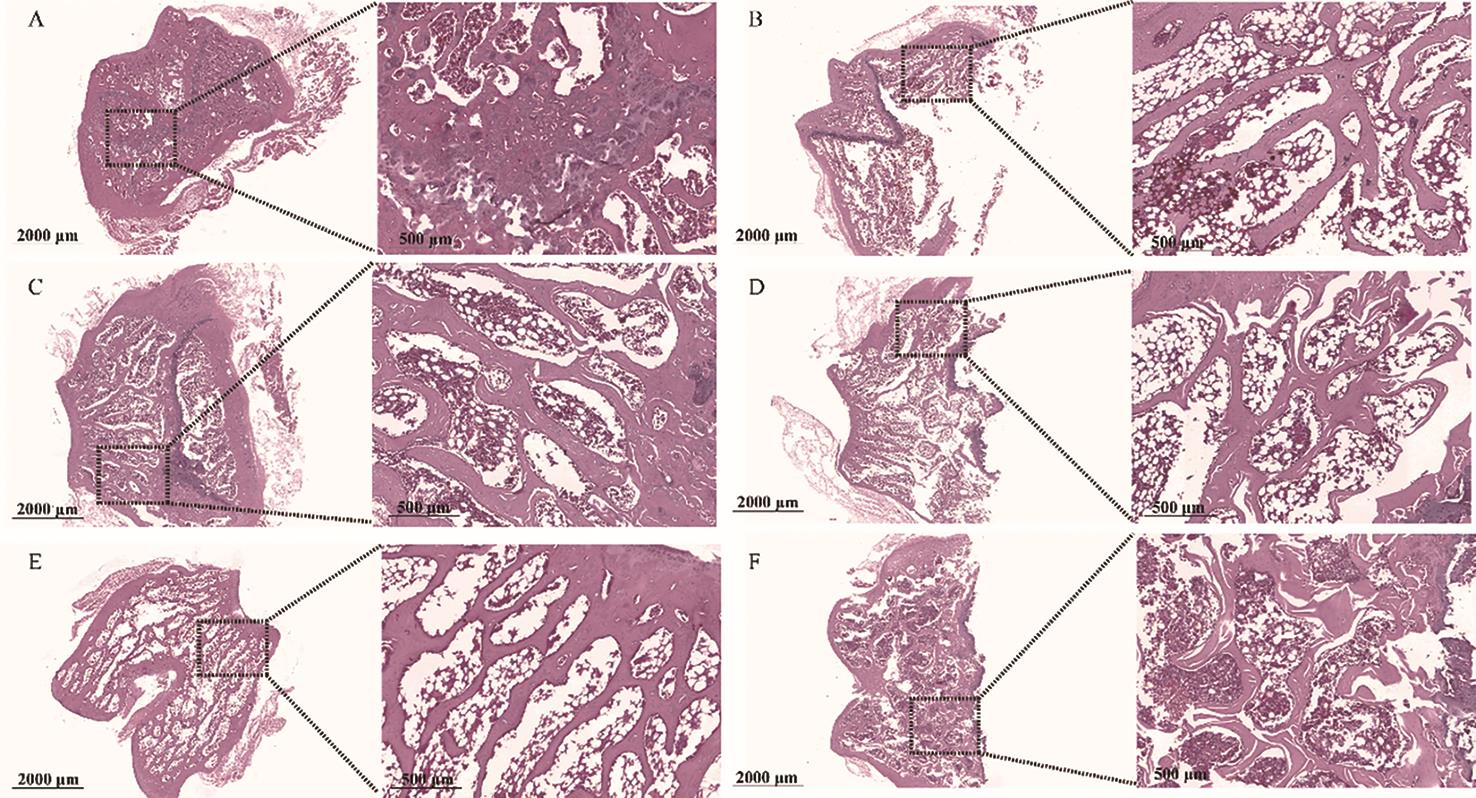
3.5.Effects of GLBSW on Bone Histomorphology in Rats
The right femur was fixed in formalin, embedded in paraffin, sectioned, stained with hematoxylin and eosin (HE), and subsequently examined under a microscope for tissue changes. As shown in Figure 5, the femur in the sham group exhibited a normal structure, characterized by dense, uniform trabecular architecture and good continuity. In contrast, the OVX group displayed fractures, thinning, and widened trabecular gaps in the distal femur. The EV and GLBSW groups, however, only exhibited minor trabecular fractures and slight widening of trabecular spaces. Compared to the OVX group, bone loss was less severe in the EV and GLBSW groups, with partial restoration of trabecular structure and spacing, particularly in the high-dose GLBSW (GLBSW-H) group, demonstrating its anti-osteoporotic efficacy.
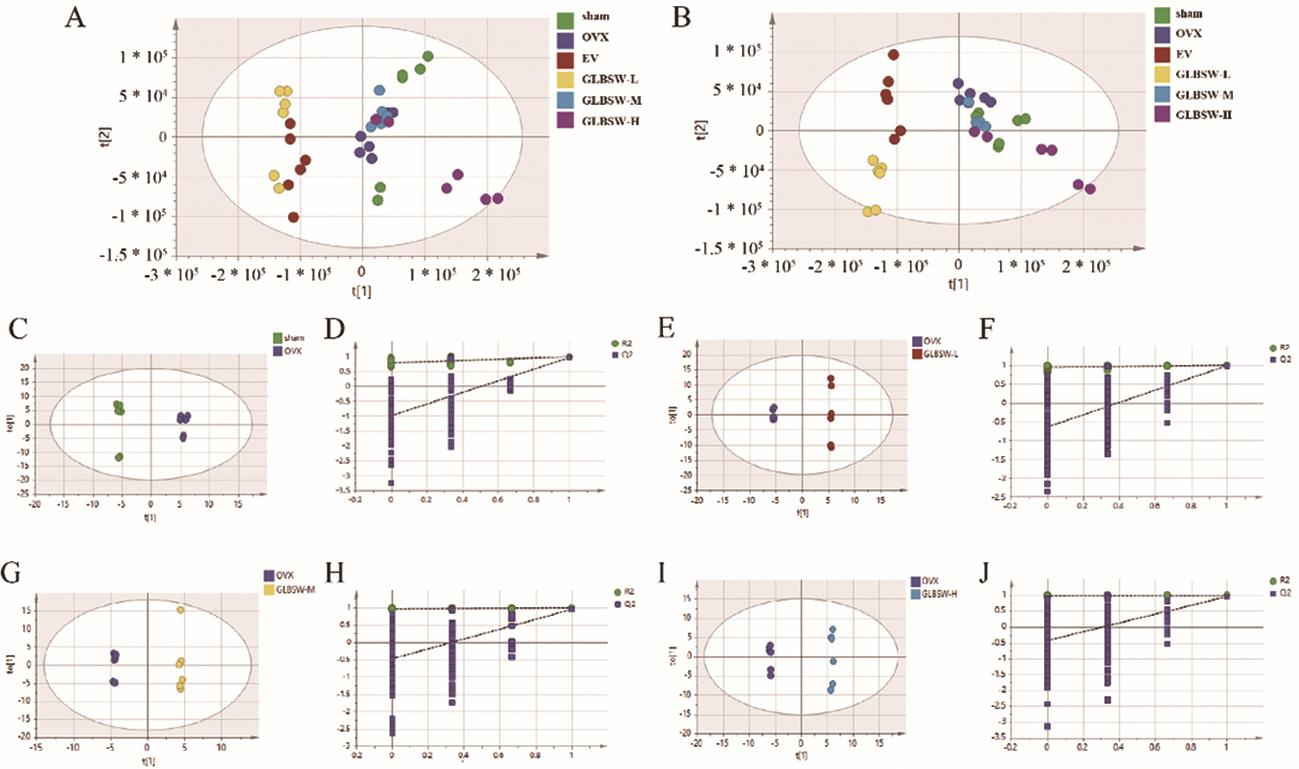
3.6.Metabolic Analysis of the Effect of GLBSW on Osteoporosis in OVX
Principal Component Analysis (PCA), Partial Least Squares Discriminant Analysis (PLS-DA), and Orthogonal-Partial Least Squares Discriminant Analysis (OPLS-DA) were performed using Compound Discoverer 2.0 software and SIMCA software 14.1. As shown in Figure 6A–J, the sham and OVX groups exhibited complete separation in the serum metabolic profiles, indicating significant changes in the serum metabolism in the OVX model. Additionally, the metabolic profiles of the GLBSW-L, GLBSW-M and GLBSW-H groups also showed noticeable separation from the OVX group, consistent with the results from the in vivo experiments. These findings further highlight the significant impact of GLBSW on rat serum metabolites.
Variable Importance in Projection (VIP) values from OPLS-DA analysis were obtained to assess intergroup differences. Subsequently, fold change (FC) in metabolite expression between the OVX group and other groups was calculated using Compound Discoverer 2.0 software and converted to log2FC values. Differential metabolites were then identified based on VIP and log2FC values, with metabolites deemed significantly different if they met the criteria of VIP > 1 and log2FC ≥ 0.263 (or log2FC ≤ -0.5778). Identified differential metabolites are shown in Tables 1 and 2.
log2FC of serum metabolites in OVX rats.
| Name | RT [min] | Sham vs. OVX | GLBSW-L vs. OVX | GLBSW-M vs. OVX | GLBSW-H vs. OVX |
|---|---|---|---|---|---|
| 13-Hpode (1-) | 12.205 | -1.3 | -0.83 | -1.12 | -1.47 |
| 15(S)-HpETE | 12.558 | -1.32 | -1.19 | -0.62 | -1.13 |
| ent-8-iso Prostaglandin F2α | 12.557 | -1.22 | -0.77 | -0.73 | -1.07 |
| Phenylacetylglycine | 4.892 | 0.76 | -7.57 | -0.61 | -0.74 |
| (15Z)-9,12,13-Trihydroxy-15-octadecenoic acid | 12.207 | -1.38 | -0.83 | -0.65 | -0.68 |
| 12-Epileukotriene B4 | 14.967 | 0.77 | -0.54 | -0.4 | -0.57 |
| 15(S)-HpETE | 13.882 | -0.8 | -1.47 | -0.89 | -0.47 |
| Uric acid | 1.088 | 0.99 | -3.08 | -0.77 | -0.47 |
| Prostaglandin E2 | 13.258 | -1.09 | -0.87 | -0.52 | -0.46 |
| Thromoboxane B1 | 12.558 | -1.09 | -0.78 | -0.54 | -0.38 |
| D-Malic acid | 0.959 | -0.41 | 8.75 | -0.35 | -0.33 |
| L-Malic acid | 0.959 | -0.41 | 8.75 | -0.35 | -0.33 |
| Taurochenodeoxycholic acid | 12.462 | 0.8 | 0.94 | -0.9 | 0.65 |
| Dibenzylamine | 9.448 | -1.93 | -7.43 | 2.59 | 1.16 |
| Erucamide | 17.805 | -0.84 | 1.84 | 0.96 | 1.4 |
| NP-021797 | 16.686 | -2.51 | 1.37 | 1.15 | 1.42 |
| Dibutyl phthalate | 14.132 | -0.69 | 0.75 | 1.45 | 1.46 |
| Docosanamide | 18.282 | -1.76 | 1.99 | 2.98 | 2.11 |
| Docosahexaenoic acid ethyl ester | 13.025 | -1.76 | 2.29 | 0.69 | 2.14 |
| Azelaic acid | 15.427 | -3.48 | 4.07 | 4.19 | 2.29 |
| D-Lactic Acid | 0.913 | -3.03 | 3.46 | 2.25 | 3.02 |
| L-Lactic Acid | 0.913 | -3.03 | 3.46 | 2.25 | 3.02 |
VIP of serum metabolites in OVX rats.
| Name | HMDB | Pubchem | KEGG | Sham vs. OVX | GLBSW-L vs. OVX | GLBSW-M vs. OVX | GLBSW-H vs. OVX |
|---|---|---|---|---|---|---|---|
| 13-HpODE(1-) | HMDB0062637 | 1426 | – | 0.6048 | 0.3448 | 0.9678 | 0.7576 |
| 15(S)-HpETE | HMDB0004244 | 5,280,893 | C05966 | 0.6055 | 0.1847 | 0.6625 | 1.0994 |
| ent-8-iso Prostaglandin F2α | HMDB0005083 | 5,282,263 | C13809 | 1.0034 | 0.8967 | 0.6865 | 0.1716 |
| Phenylacetylglycine | HMDB0000821 | 68,144 | C05598 | 0.9705 | 1.6656 | 1.0101 | 0.9299 |
| (15Z)-9,12,13-Trihydroxy-15-octadecenoic acid | HMDB0035919 | 44,559,173 | – | 0.8133 | 0.5329 | 0.7818 | 0.5100 |
| 12-Epileukotriene B4 | HMDB0005088 | 5,283,129 | – | 0.4540 | 0.0307 | 0.6335 | 0.5481 |
| 15(S)-HpETE | HMDB0004244 | 5,280,893 | C05966 | 0.6055 | 0.1847 | 0.6625 | 1.0994 |
| Uric acid | HMDB0000289 | 1175 | C00366 | 1.2214 | 1.9638 | 2.0631 | 1.4100 |
| Prostaglandin E2 | HMDB0001220 | 5,283,116 | C00584 | 1.5593 | 0.8110 | 0.5647 | 0.1225 |
| Thromoboxane B1 | HMDB03252 | 5,283,137 | C05963 | 0.8952 | 0.9852 | 0.6284 | 0.2008 |
| D-Malic acid | HMDB0031518 | 92,824 | C00497 | 0.4525 | 1.9103 | 0.6001 | 0.8630 |
| L-Malic acid | HMDB0000156 | 222,656 | C00149 | 0.4525 | 1.9103 | 0.6001 | 0.8630 |
| Taurochenodeoxycholic acid | HMDB0000951 | 387,316 | C05465 | 0.2421 | 1.0161 | 0.7906 | 0.3691 |
| Dibenzylamine | HMDB0251169 | 7656 | – | 0.9741 | 1.3352 | 1.8633 | 0.3346 |
| Erucamide | HMDB0244507 | 8214 | – | 0.4842 | 1.4639 | 1.1108 | 1.4690 |
| NP-021797 | HMDB0340656 | 101,766,552 | – | 1.1884 | 1.6755 | 1.9125 | 1.5373 |
| Dibutyl phthalate | HMDB0033244 | 3026 | C14214 | 0.7906 | 0.7076 | 1.5080 | 1.2159 |
| Docosanamide | HMDB0000583 | 76,468 | – | 0.4300 | 0.3307 | 1.7076 | 0.6835 |
| Docosahexaenoic acid ethyl ester | HMDB0251557 | 150,680 | – | 0.6169 | 1.1895 | 1.0318 | 1.3101 |
| Azelaic acid | HMDB0000784 | 2266 | C08261 | 0.8942 | 1.0547 | 0.5911 | 1.2851 |
| D-Lactic Acid | HMDB0001311 | 61,503 | C00256 | 2.0283 | 1.9326 | 1.6775 | 1.8231 |
| L-Lactic Acid | HMDB0000190 | 61,503 | C00186 | 2.0283 | 1.9326 | 1.6775 | 1.8231 |
To identify metabolic pathways associated with osteoporosis, differential metabolites were analyzed using the MetaboAnalyst 5.0 online platform. As shown in Table 3, eight potential pathways with impact values greater than 0.1 were identified, including pyruvate metabolism (0.18519) and arachidonic acid metabolism (0.11111). Prostaglandin E2, thromboxane B1, 13-Hpode (1-), and Ent-8-iso prostaglandin F2α were notably downregulated in the GLBSW low-, medium-, and high-dose groups but upregulated in the OVX group (Tables 1 and 2), suggesting GLBSW may normalize serum biomarkers associated with osteoporosis, thereby correcting systemic metabolic disorders. Consequently, GLBSW administration in rats is suggested to inhibit serum ketone and arachidonic acid metabolism, contributing to the amelioration of osteoporosis.
Metabolic pathways enriched in serum of OVX rats.
| Metabolic Pathways | Hits | Raw p | Pathway Impact | Details |
|---|---|---|---|---|
| Pyruvate metabolism | 3 | 0.000145 | 0.18519 | KEGG SMP |
| Arachidonic acid metabolism | 2 | 0.014215 | 0.11111 | KEGG SMP |
| Phenylalanine metabolism | 1 | 0.062136 | 0.0 | KEGG SMP |
| Citrate cycle (TCA cycle) | 1 | 0.10166 | 0.06897 | KEGG |
| Glycolysis / Gluconeogenesis | 1 | 0.13034 | 0.02857 | KEGG SMP SMP |
| Glyoxylate and dicarboxylate metabolism | 1 | 0.15821 | 0.03846 | KEGG |
| Primary bile acid biosynthesis | 1 | 0.22023 | 0.0 | KEGG SMP |
| Purine metabolism | 1 | 0.30188 | 0.01136 | KEGG SMP |
4.Discussion
GLBSW, a traditional formula from “Qian Jin Yao Fang”, is included in the 2020 edition of the “Chinese Pharmacopoeia”. Known for its kidney-nourishing, qi-tonifying, and blood-replenishing properties, GLBSW employs a multi-target approach in treating postmenopausal osteoporosis. Its components can improve circulation, promote bone resorption, prevent bone loss, and influence bone metabolism. Given its diverse active ingredients, GLBSW is predicted to have therapeutic potential for osteoporosis. However, current research primarily focuses on male sexual dysfunction and female ovulation disorders, with limited studies on osteoporosis. This study, using an OVX rat model, demonstrated that GLBSW significantly alleviates osteoporosis, highlighting its therapeutic potential, particularly for elderly populations due to its multi-component, systemic regulatory properties.
Studies have shown that various components of GLBSW, such as Semen Cuscutae, Epimedium, Radix Dipsaci, and Cynomorium, can promote osteoblast differentiation and inhibit osteoclast resorption [10‒14]. Additionally, Semen Cuscutae, Radix Dipsaci, and Cynomorium have demonstrated significant anti-osteoporotic effects in OVX rats [15‒18]. These herbs primarily promote osteoblast formation through signaling pathways including BMP-Smads, Wnt/β-catenin, MAPK, and PI3K/AKT, while inhibiting bone resorption via the OPG/RANKL/RANK and estrogen signaling pathways [19,20]. For instance, Radix Dipsaci upregulates the expression of P-Smad1/5/8, P-ERK1/2, P-p38, and Runx2 [12], whereas Cynomorium downregulates NF-κB and PI3K/AKT signaling via the RANKL/RANK/TRAF6 pathway. Both in vivo and in vitro studies have shown that Cibotium and Cornus Cervi Colla improve bone metabolism and alleviate the imbalance between bone formation and resorption [21,22]. W.Q. Kang et al. found that Radix Rehmanniae Preparata combined with Astragali Radix may treat osteoporosis by activating the PI3K/AKT pathway [23]. Moreover, J.H. Hwang et al. found that yam-derived exosome-like nanovesicles promote osteogenesis via the BMP-2/p-p38/Runx2 pathway [24]. Additionally, Polygoni Multiflori Radix significantly inhibits RANKL-induced osteoclast differentiation by suppressing NFATc1 transcription and translation, highlighting its anti-osteoporotic effects [16,25]. In this study, GLBSW treatment significantly lowered serum TRAP and PY levels in OVX rats while increasing BGP and ALP levels, with ALP being a key marker of osteoblast differentiation regulated by BMP-Smads and Wnt/β-catenin. These results suggest that GLBSW may exert its effects through these pathways, though further research is needed to elucidate its mechanisms.
Pyruvate metabolism, the final pathway of nutrient processing, generates substantial ATP through the mitochondrial respiratory chain, which provides the essential energy for osteoblasts during bone formation [26]. Studies have demonstrated that metabolic regulation, particularly a moderate increase in pyruvate levels, significantly enhance osteoblast function. In this study, metabolomic analysis revealed that GLBSW can modulate the pyruvate metabolic pathway, potentially exerting therapeutic effects on osteoporosis by regulating energy metabolism. Furthermore, metabolic profiling revealed significant changes in serum levels of cyclooxygenase (COX) and prostaglandins following GLBSW administration. In kidney deficiency model rats, additional metabolic analysis indicated that Semen Cuscutae affects arachidonic acid metabolism [6], while Epimedium exerts anti-osteoporotic effects by modulating 11 estrogen-related signaling pathways [27]. Arachidonic acid metabolism encompasses three main pathways, facilitated by enzymes such as cyclooxygenase (COX), lipoxygenase (LOX), and cytochrome P450 (CYP450), generating a range of bioactive mediators [28]. COX pathway, the first identified metabolic route for arachidonic acid, catalyzes the formation of prostaglandins (PGs) and thromboxane A2 (TXA2) via COX-2 (PTGS2) and COX-1 (PTGS1). Therefore, the anti-osteoporotic effects of GLBSW may be attributed to its regulation of energy and bone metabolism pathways.
5.Conclusions
This study aims to evaluate the efficacy of GLBSW as a combination therapy for osteoporosis, thereby establishing a pharmacological foundation for the comprehensive exploration of its active components.
Author Contributions: H.W., X.C. and X.P. conceptualized and planned the experiments. X.P., X.Z., M.G., J.H., P.L., M.J., and H.G. performed most of the experiments and completed the original draft. X.P., M.J., H.G. and H.W. analyzed the data. H.W., X.C. and X.P. check the figures and spelling. X.P., X.Z., M.G., J.H., P.L., X.H., Y.M. and C.L. raised the animals. All authors have read and agreed to the published version of the manuscript.
Funding: This study was supported by a grant from Guangdong Provincial Key Laboratory of Animal Protection and Resource Utilization Open fund (No. GIZ-KF202305).
Institutional Review Board Statement: The study was conducted in accordance with the guidelines for the care and use of laboratory animals and was approved by the Experimental Animal Ethics Committee of Guangdong University of Technology.
Data Availability Statement: Not applicable.
Acknowledgments: We would like to express our heartfelt appreciation to Lvdan Zeng for her assistance with language editing and proofreading.
Conflicts of Interest: The authors declare no conflict of interest.
References
- 1.
Lim, V. A practical approach to secondary osteoporosis e Case studies in Asia. Osteoporosis Sarcopenia 2016, 2, 134–139. https://doi.org/10.1016/j.afos.2016.07.003.
- 2.
Amin, U; McPartland, A; O’Sullivan, M; et al. An overview of the management of osteoporosis in the aging female population. Womens Health 2023, 19, 17455057231176655. https://doi.org/10.1177/17455057231176655.
- 3.
Brennan, A; Rees, M; Menopausal hormone therapy in women with benign gynaecological conditions and cancer. Best Pract. Res. Clin. Endoc. Metab. 2021, 35, 9. https://doi.org/10.1016/j.beem.2021.101575.
- 4.
Slupski, W; Jawien, P; Nowak, B; Botanicals in Postmenopausal Osteoporosis. Nutrients 2021, 13, 27. https://doi.org/10.3390/nu13051609.
- 5.
Fan, K.X; Chen, X.X; He, X.Y; et al. Meta analysis of three kinds of collagen-rich traditional Chinese medicine compound in the treatment of osteoporosis. Chin. J. Osteoporos. 2021, 27, 1745–1751. https://doi.org/10.3969/j.issn.1006-7108.2021.12.005.
- 6.
Fan, R.H; Liu, C.G; Zhang, Z; et al. Metabolomics analysis of Semen Cuscutae protection of kidney deficient model rats using ultra high-performance liquid chromatography-quadrupole time-of-flight Mass Spectrometry. J. Pharm. Biomed. Anal. 2022, 207, 114432. https://doi.org/10.1016/j.jpba.2021.114432.
- 7.
Chen, D.Q; Cao, G; Chen, H; et al. Identification of serum metabolites associating with chronic kidney disease progression and anti-fibrotic effect of 5-methoxytryptophan. Nat. Commun. 2019, 10, 15. https://doi.org/10.1038/s41467-019-09329-0.
- 8.
Wang, M; Chen, L; Liu, D; et al. Metabolomics highlights pharmacological bioactivity and biochemical mechanism of traditional Chinese medicine. Chem. Biol. Interact. 2017, 273, 133–141. https://doi.org/10.1016/j.cbi.2017.06.011.
- 9.
Gonzalez-Reimers, E; Martinez-Riera, A; Santolaria-Fernandez, F; et al. Relative and combined effects of ethanol and protein deficiency on zinc, iron, copper, and manganese contents in different organs and urinary and fecal excretion. Alcohol 1998, 16, 7–12. https://doi.org/10.1016/s0741-8329(97)00156-0.
- 10.
Dai, W.R; Sun, Y; Zhong, G.Q; A Network Pharmacology Approach to Estimate the Active Ingredients and Potential Targets of Cuscutae semen in the Treatment of Osteoporosis. Med. Sci. Monitor 2020, 26, 20. https://doi.org/10.12659/msm.920485.
- 11.
Liu, Z.G; Zhang, R; Li, C; et al. The osteoprotective effect of Radix Dipsaci extract in ovariectomized rats. J. Ethnopharmacol. 2009, 123, 74–81. https://doi.org/10.1016/j.jep.2009.02.025.
- 12.
Niu, Y.B; Kong, X.H; Li, Y.H; et al. Radix Dipsaci total saponins stimulate MC3T3-E1 cell differentiation via the bone morphogenetic protein-2/MAPK/Smad-dependent Runx2 pathway. Mol. Med. Rep. 2015, 11, 4468–4472. https://doi.org/10.3892/mmr.2015.3249.
- 13.
Wong, R.W.K; Rabie, A.B.M; Hägg, E.U.O; The effect of crude extract from Radix Dipsaci on bone in mice. Phytother. Res. 2007, 21, 596–598. https://doi.org/10.1002/ptr.2126.
- 14.
Lv, Y; Wu, H.S; Hong, Z.H; et al. Exploring active ingredients of anti-osteoarthritis in raw and wine-processed Dipsaci Radix based on spectrum-effect relationship combined with chemometrics. J. Ethnopharmacol. 2023, 309, 12. https://doi.org/10.1016/j.jep.2023.116281.
- 15.
Kim, J.H; Kim, H.S; Jun, J.Y; et al. Effects of Cuscutae Semen Extract on Prevention of Osteoporosis in Ovariectomized Rats. J. Korean Orient.Obstet. Gynecol. 2012, 25, 1–11.
- 16.
Kim, K.-J; Yongjin, L; Kyung-yun, K; et al. Extracts of Polygonum multiflorum Inhibit RANKL-mediated Osteoclast Differentiation. Yakhak Hoeji 2018, 62, 83–88. https://doi.org/10.17480/psk.2018.62.2.83.
- 17.
Ma, X.Q; Liu, J.J; Yang, L.L; et al. Cynomorium songaricum prevents bone resorption in ovariectomized rats through RANKL/RANK/TRAF6 mediated suppression of PI3K/AKT and NF-κB pathways. Life Sci. 2018, 209, 140–148. https://doi.org/10.1016/j.lfs.2018.08.008.
- 18.
Yang, Y; Wei, Q; An, R; et al. Anti-osteoporosis effect of Semen Cuscutae in ovariectomized mice through inhibition of bone resorption by osteoclasts. J. Ethnopharmacol. 2022, 285, 13. https://doi.org/10.1016/j.jep.2021.114834.
- 19.
Jiao, Y; Wang, X; Wang, Q; et al. Mechanisms by which kidney-tonifying Chinese herbs inhibit osteoclastogenesis: Emphasis on immune cells. Front. Pharmacol. 2023, 14, 14. https://doi.org/10.3389/fphar.2023.1077796.
- 20.
Tang, X.Y; Huang, Y.X; Fang, X.L; et al. Cornus officinalis: A potential herb for treatment of osteoporosis. Front. Med. 2023, 10, 11. https://doi.org/10.3389/fmed.2023.1289144.
- 21.
He, J.B; Li, X.J; Wang, Z.Y; et al. Therapeutic Anabolic and Anticatabolic Benefits of Natural Chinese Medicines for the Treatment of Osteoporosis. Front. Pharmacol. 2019, 10, 23. https://doi.org/10.3389/fphar.2019.01344.
- 22.
Yao, C.H; Liu, B.S; Liu, C.G; et al. Osteogenic potential using a malleable, biodegradable composite added traditional Chinese medicine: In vitro and in vivo evaluations. Am. J. Chin. Med. 2006, 34, 873–886. https://doi.org/10.1142/s0192415x06004351.
- 23.
Kang, W.Q; Wei, P.F; Ou, L; et al. The mechanism study of inhibition effect of prepared Radix Rehmanniainon combined with Radix Astragali osteoporosis through PI3K-AKT signaling pathway. Acta Cir. Bras. 2022, 37, e371101. https://doi.org/10.1590/acb371101.
- 24.
Hwang, J.H; Kim, D.H; Cho, Y.E; et al. Yam-Derived Nanovesicles Stimulate Osteoblast Formation and Prevent Osteoporosis in Mice. Ann. Nutr. Metab. 2023, 79, 1090.
- 25.
Hwang, Y.-H; Kang, K.-Y; Kim, J.-J; et al. Effects of Hot Water Extracts from Polygonum multiflorum on Ovariectomy Induced Osteopenia in Mice. Evid. Based Complement. Altern. Med. Ecam 2016, 2016, 8970585.
- 26.
Lee, W.C; Guntur, A.R; Long, F.X; et al. Energy Metabolism of the Osteoblast: Implications for Osteoporosis. Endocr. Rev. 2017, 38, 255–266. https://doi.org/10.1210/er.2017-00064.
- 27.
Xu, F.F; Ding, Y; Guo, Y.Y; et al. Anti-osteoporosis effect of Epimedium via an estrogen-like mechanism based on a system-level approach. J. Ethnopharmacol. 2016, 177, 148–160. https://doi.org/10.1016/j.jep.2015.11.007.
- 28.
Wei, C; Wang, M; Wang, X.-J; Evolutionary conservation analysis of human arachidonic acid metabolism pathway genes. Life Med. 2023, 2, lnad004. https://doi.org/10.1093/lifemedi/lnad004.

This work is licensed under a Creative Commons Attribution 4.0 International License.
 Suite 4002 Level 4, 447 Collins Street, Melbourne, Victoria 3000, Australia
 General Inquiries: info@sciltp.com