Downloads

Yuan, Z., Li, Y., Liu, Y., Liang, J., & Zhang, Y. Unsupervised Ship Detection in SAR Imagery Based on Energy Density-Induced Clustering. International Journal of Network Dynamics and Intelligence. 2023, 2(3), 100006. doi: https://doi.org/10.53941/ijndi.2023.100006

Article

Unsupervised Ship Detection in SAR Imagery Based on Energy Density-Induced Clustering

Zifeng Yuan 1, Yu Li 1,*, Yu Liu 1, Jiale Liang 1, and Yuanzhi Zhang 2,3

1 Faculty of Information Technology, Beijing University of Technology, Beijing 100124, China

2 School of Astronomy and Space Science, University of Chinese Academy of Sciences, Beijing 100049, China

3 Key Laboratory of Lunar and Deep Space Exploration, National Astronomical Observatories, Chinese Academy of Sciences, Beijing 100101, China

* Correspondence: yuli@bjut.edu.cn


Received: 3 February 2023

Accepted: 24 April 2023

Published: 26 September 2023


Abstract: 
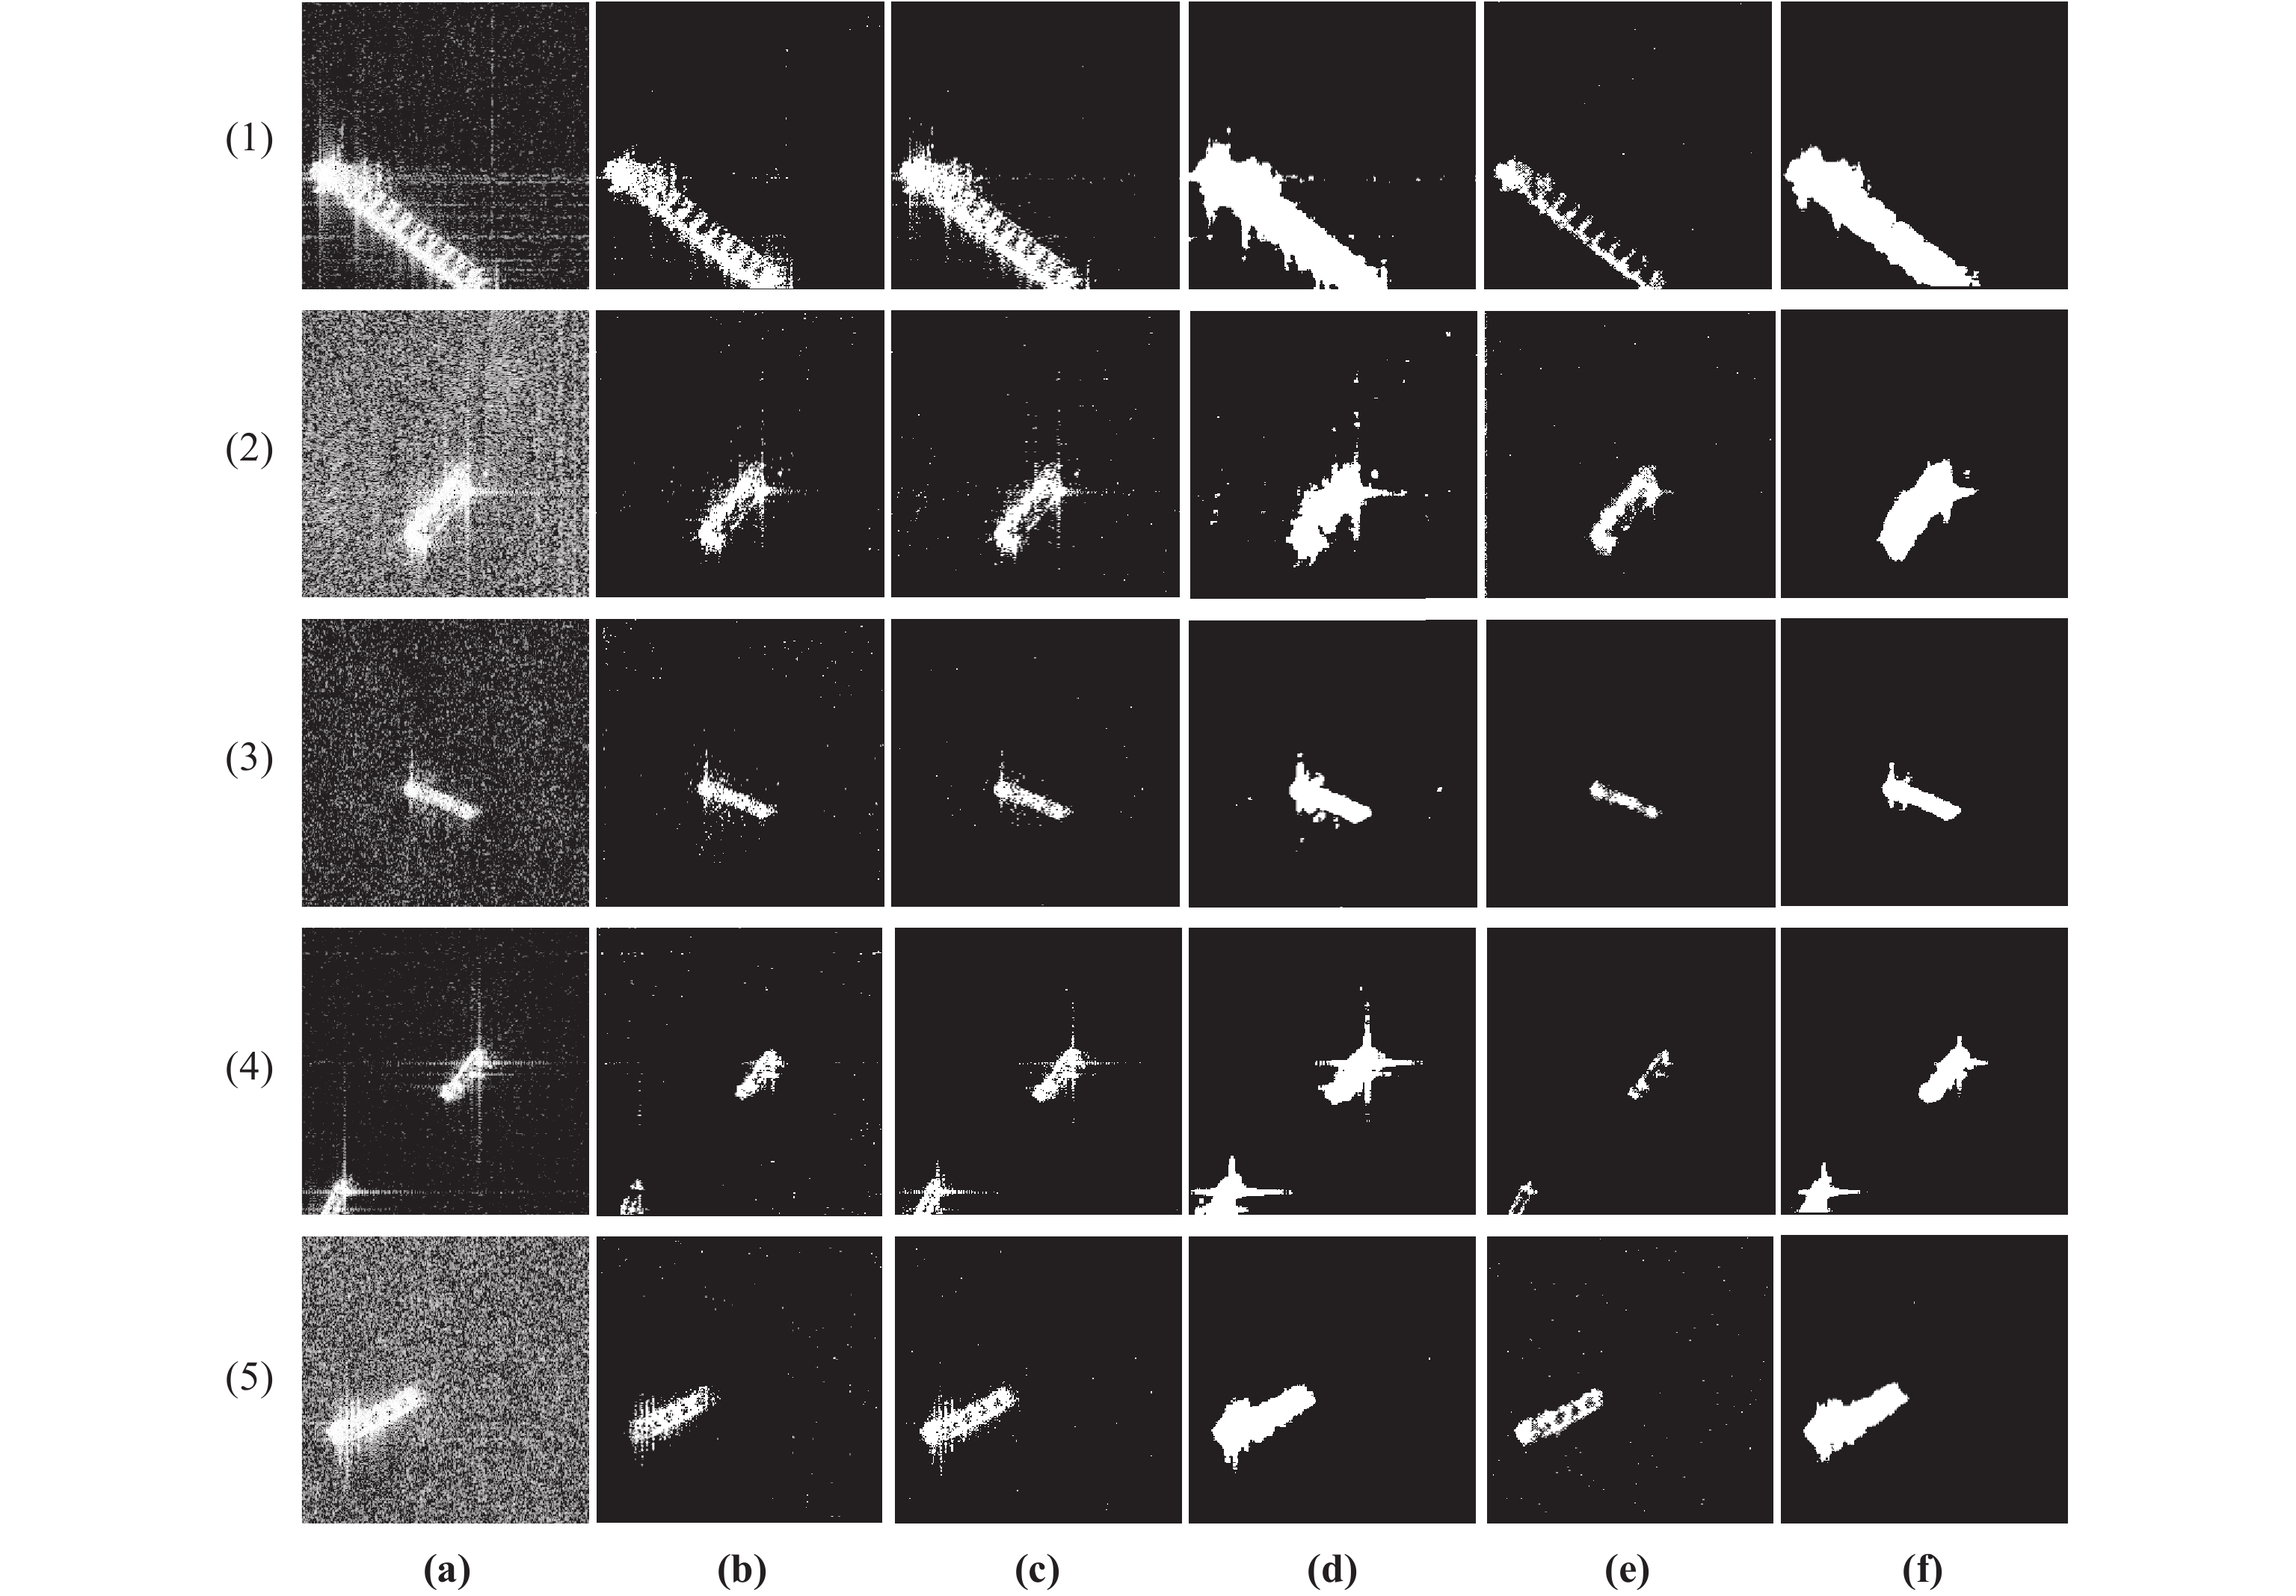
Intelligent recognition of maritime ship targets from synthetic aperture radar (SAR) imagery is a hot research issue. However, interferences such as the strong sea clutter, sidelobe, small ship size and weak backscattered signal continually affect the detection results. To address this problem, a novel unsupervised machine learning-based ship detection algorithm, named energy density-induced clustering (EDIC), is proposed in this paper. It is discovered that the singular values between ship targets and interference signals are significantly different in a local region because of their various concentration degrees of signal energy intensity. Accordingly, in this study, two novel energy density features are proposed based on the singular value decomposition in order to effectively highlight the ship targets and suppress the interference. The proposed novel energy density features have the advantage of clearly distinguishing ship targets from sea surfaces regardless of the effects of interferences. To test the performance of the proposed features, unsupervised K-means clustering is conducted for obtaining ship detection results. Compared with the classical and state-of-the-art SAR ship detectors, the proposed EDIC method generally yields the best performance in almost all tested sea sample areas with different kinds of interferences, in terms of both detection accuracy and processing efficiency. The proposed energy density-based feature extraction method also has great potential for supervised classification using neural networks, random forests, etc.

Keywords:

ship detection synthetic aperture radar  singular value decomposition unsupervised classification

1. Introduction

With the increasing frequency of maritime transportation, the intelligent monitoring and management of ships have become more and more necessary. The synthetic aperture radar (SAR) has been proven as a reliable tool for marine monitoring and target detection due to its capability of all-day and all-weather observation [1-3]. Different from optical remote sensing, the SAR is a kind of active microwave remote sensing system whose signal can penetrate water vapor and clouds, which makes the SAR system superiorly suitable for detecting ship targets on the sea surface [4-6]. However, interferences (including the strong sea clutter, sidelobe, ship wake and so on) largely challenge the ship detection result. Quite a lot of methods have been proposed to cope with the interference.

Traditional SAR ship detection methods mainly concentrate on statistical modeling of the distribution of sea clutters. A typical method is the constant false alarm rate (CFAR) [7], which can keep the false alarm rate unchanged when the interference is different by modeling the corresponding statistic distribution and determining the threshold in a local window. Liu et al. comprehensively analyzed the influence of different distributions on the two-parameter CFAR (TP-CFAR) and determined the threshold of the polarimetric whitening filter (PWF) [8]. Wang et al. proposed the intensity-space domain CFAR (IS-CFAR) to introduce both intensity and spacial characteristics into the traditional CFAR, therefor further controlling the effect of strong sea noises [9]. Qin et al. proposed a closed-form expression for the detection threshold in the generalized gamma distributed background to increase the efficiency of the CFAR [10]. However, these CFAR-based algorithms cannot well cope with the dilemma in setting the parameter false alarm rate (FAR). To be specific, when the FAR is high, the number of misclassified pixels in the sea clutter area will be reduced, but the performance of ship detection results will be poor, and vice versa. This largely lowers the robustness of the CFAR.

With the development of digital image processing techniques, some advanced image enhancement and segmentation methods have been gradually introduced to detect ship targets in SAR images [11]. The local contrast method (LCM) was originally proposed for detecting small objects in the infrared image by using a local cellular contrast enhancer [12]. Wang et al. proposed an improved version of the LCM, named variance weighted information entropy (VWIE), to detect ships in strong clutters and heterogeneous backgrounds [13]. Wang et al. proposed the fast multiscale patch-based contrast measure (FMPCM) by substituting the cellular operator into a multiplier to further reduce the heterogeneous noise [14]. Unfortunately, these local contrast enhancer-based methods may possibly lead to noise and interference amplification in some strong sea clutter areas. Superpixel methods were introduced to segment ship targets in SAR images due to their strong capability to maintain ship boundaries and integrate effective characters of pixels in the local region [15]. Wang et al. implemented a neighbor superpixels difference-based ship detection approach based on the Fisher vector [16]. Li et al. conducted the traditional CFAR at the superpixel level to reduce the influence of sea noises [17]. Xie et al. proposed a novel saliency map named the Gaussian kernel function weighted local contrast measure (GLCM), and conducted superpixel segmentation with a modified distance measure [18]. Tirandaz et al. proposed a superpixel method based on image entropy and texture features for polarimetric SAR image segmentation [19]. Note that superpixel-based algorithms yield brilliant detection results only when the superpixel size is similar to the ship target. However, it is difficult to determine an optimal parameter when facing cross-scale ships in large sea areas.

Machine learning methods have gradually drawn attention in ship detection because of their strong robustness. Hwang et al. proposed a ship detection framework by extracting texture and intensity features through the root-mean-square difference calculation, and compared the performance of the artificial neural network (ANN) and the support vector machine (SVM) based on multi-look SAR images [20]. Baek et al. mapped oil slicks-covered sea surfaces with numerous ship targets using the SVM, random forest (RF), and deep neural network (DNN) based on intensity and phase texture features of the dual-polarized SAR [21]. Li et al. extracted polarimetric rotation domain features and implemented the classification using the SVM [22]. Wang et al. proposed a ship detection framework for compact polarized SAR by H/α decomposition and m-χ decomposition, and leveraged ReliefF for feature optimization, SVM for classification, and single-polarized segmentation for false alarm removing [23]. Lin et al. proposed a semisupervised loss function (constructed by the superpixel-level Fisher vectors) and solved the optimization problem based on the stochastic gradient descent (SGD) algorithm [24]. Aghaei et al. used the grey wolf optimization (GWO) method to determine the threshold of K-means clustering for marine object detection [25]. In the above machine learning-based methods, quite a lot of useful features have been extracted and sea surfaces have been mapped based on some widely used classifiers. However, existing machine learning-based methods mainly rely on the texture, statistic or polarimetric features, where ship targets and interferences may be similar. This can cause false alarms to a certain degree.

In recent years, deep learning methods, represented by convolution neural networks (CNNs), have shown their advantages in ship detection as well. Zhou et al. proposed a feature-transferable pyramid network (FTPN), and added dilated convolution groups to the traditional feature pyramid network (FPN) to enhance the capability of detecting cross-scale ship targets [26]. Zhang et al. proposed the oriented Gaussian function for box boundary-aware vectors (BBAV) to improve the ground truth heatmap for rotated ship targets in SAR images [27]. Sun et al. proposed a strong scattering point network for inshore ship detection to reduce the strong scattering interference of the inland area [28]. Li et al. proposed the attention-guided balanced feature pyramid network (A-BFPN) with an enhanced refinement module to reduce interferences from complex backgrounds [29]. Fu et al. proposed the feature balancing and refinement network (FBR-Net) to deal with multiscale ships and interferences from lands [30]. Jiao et al. proposed a densely connected end-to-end neural network to enhance the detection result of small ships [31]. Lv et al. proposed the channel and spatial attention mechanism (CSAM) to enhance ship targets from the complex land background [32]. Fu et al. proposed the feature fusion pyramid network (FFPN) for SAR ship detection in the complex background and the dense parking scene [33]. Sharifzadeh et al. proposed a hybrid CNN and multilayer perceptron (MLP) classifier to improve the ship detection performance in SAR images [34]. Samadi et al. proposed new region-based morphological features for detecting changes in SAR images by using the deep belief network (DBN) [35].

It should be noted that all these deep learning-based approaches need numerous training samples with manual labeling, whereas the training process consumes too much time. To efficiently and robustly observe ships, an energy density-induced clustering (EDIC) method is proposed in this paper. Two novel energy density features are originally defined based on the significant difference of singular values in the target and interference region of the SAR intensity image in order to suppress the interference and highlight the ship targets. The classical unsupervised K-means clustering method is used for classification due to the fact that, the unsupervised machine learning technique does not need to artificially label training samples and thus, possesses low computational complexity. The proposed EDIC method achieves the best result when compared with several classical and state-of-the-art methods.

The remainder of this paper is organized as follows. Basic theories are introduced in Section 2. Section 3 presents the proposed EDIC method, and the results are shown and discussed in Section 4. Finally, a brief conclusion is drawn in Section 5.

2. Methodology

2.1. Singular Value Decomposition

Singular value decomposition (SVD) is a classical matrix factorization method in the fields of image processing and machine learning [36]. Different from the eigenvalue decomposition (EVD), SVD can process the non-symmetric matrix including the non-square matrix. In other words, SVD can decompose the matrix of any form. The definition of SVD is:

where X is the input matrix with the size of m×n, U and V are the left and right singular vector matrices with the orthogonal property and T is the transpose operator. S is the singular value matrix, which can be detailedly written as:

where O denotes the zero matrix.  contains effective singular values:

where s1, s2, ···, smax(m,n) are the singular values of matrix X which represent the rank information. Generally, the singular values are sorted from large to small, that is, s1s2··· smax(m,n).

2.2. K-Means Clustering

K-means clustering is a kind of prototype-based clustering algorithm [37]. This algorithm initializes the prototype first and then, solves the optimal solution by iterating and updating the prototype according to the distance or similarity among classes. The key steps of K-means clustering are given as follows.

1) Stochastically select k centroids μ1, μ2, ..., and μk∈Rn in the input data samples;

2) Compute the distance between each data sample x and the cluster centroids μj, and divide the sample into the class between which the distance is the smallest;

3) Update the centroids by taking the mean values of samples in each classes Ci as new centroids:

4) Repeat 2) and 3) until meeting the termination condition such as enough epochs, errors below the threshold, etc.

As an unsupervised machine learning approach, K-means clustering can adaptively classify the data without labeling the samples, only given the number of classes.

3. The Proposed EDIC Method

Strong sea clutters always cause false alarms for the intensity value of ship targets may be familiar to the noise. However, the energy density of ship targets and the energy density of sea clutters are largely different [38]. Ship targets always have strong energy density because the metal structure always produces strong backscattering intensity in the radar signal. In other words, high-intensity pixels concentrate in a local region. For sea clutters, high scatter intensity only exists in several pixels. Feng et al. and Singh et al. proposed that SVD can be used to measure the energy density of the local area in an image [39-40]. Inspired by this theory, we propose two energy density features for ship detection in strong interferences based on the differences of singular values in the local region between the sea clutter and the ship in this paper. The SAR image with a cargo ship is taken as an example to analyze the singular values of the ship target and sea clutter. SVD is conducted on the 5×5 boxes of both ship target and sea clutter. The sampling region is shown in Figure 1(a) where red and green boxes denote the ship target and sea clutter, respectively, and the singular values are illustrated by a bar chart in Figure 1(b).

Figure 1. Illustration of the difference of singular values of ship targets and sea clutter. (a) Study samples (red: ship; green: sea); (b) bar chart of singular values.

Obviously, the first singular value s1 of the ship target is much higher than others (i.e. s2, s3, s4 and s5), and all singular values of sea clutters are more approximate to each other. In other words, s1 of the ship target is much larger than that of the sea clutter, while s2 to s5 are on the contrary. Based on these discoveries, we propose two energy density features by using an n-by-n sliding window with the stride of 1. For each n-by-n sliding window G(i, j) whose center pixel locates at (i, j), SVD is implemented to extract the singular values of the local region in the SAR image:

where

because the sliding window used in the proposed EDIC is square-shaped.

The first energy density feature F1 proposed in this paper is:

where s1 and s2 are the first and the second singular values. s1 contains the most dominant energy information in all singular values. The difference between s1 and s2 can effectively enhance discrimination. The second energy density feature F2 is:

where f(·) denotes the transformation function which is used to eliminate the influence of some strong scatter pixels in the ship area in the clustering process. For example, f(x) = ln(x) or a truncation function f(x) = T (if x > T) can be considered. For ship targets, the value of s1 is quite larger than those of s2 to s5 in the ship area. On the contrary, for sea clutters, the value of s1 is quite smaller than those of s2 to s5 is small in the ship target, while large in the sea clutter. Accordingly,  is fairly large for the ship target, while small for the sea clutter.

The values of F1 and F2 of each window are set as the pixel value in the feature image and the location of the center pixel of the sliding window is given. To further explain the feature extraction process, the pseudocode is presented in Figure 2.

Figure 2. Pseudocode of the energy density feature extraction.

According to the differences (in the singular values) between the ship target and sea clutter, the intensity of F1 and F2 in the ship area presents high pixel values, and that on the sea surface presents low pixel values. Compared with the original SAR image, F1 and F2 features have a stronger capability of distinguishing ship targets from sea clutters.

To clearly illustrate the advantages on suppressing sea clutters of two features, heatmaps of the original SAR image and two feature images are shown in Figure 3. In this case, F2 is processed with a truncation function f(x) = 10 (if x > 10). The sea clutter is constrained to a large degree and the signal of the ship target is enhanced as well.

Figure 3. Heatmaps of original SAR image and energy density features. (a) Heatmap of the original SAR image; (b) heatmap of F1; (c) heatmap of F2.

The target-to-clutter ratio (TCR) [41] is used to quantitatively assess the performance of two proposed features:

where IT and IC are the intensity of the ship target and sea clutter, respectively. The result is shown in Table 1. The TCR values of the two proposed features are higher than those of the original SAR image, which proves the effectiveness of the features.

Table 1. Comparison of the target-to-clutter ratio(TCR) in original synthetic aperture radar(SAR) image and energy density features.

  Original F1 F2
TCR (dB) 5.08 6.72 10.99


A transect is selected through the middle part of the ship (shown in Figure 4(a) by a red line), and the normalized intensity values of the original SAR image and two features are shown in Figure 4(b). Note that in order to make the intensity ranges unified and comparable, the pixel values are min-max normalized in each image. The size of the sliding window is set as 5×5 in this case, and the window size can be adjusted based on the noise condition in practice. In Figure 4(b), the pixel numbers (approximately ranging from 40 to 60) are the ship targets, and the other are the sea clutter areas. Generally, F1 preserves the intensity of the ship target and suppresses the sea noise to some degrees. Although F2 makes the range of signal intensity in the ship area broader, it considerably controls the sea clutter.

Figure 4. Comparison of the intensity of the original SAR image and energy density features by using a transect. (a) Original SAR image and the position of the transect (in the red line); (b) plot of the intensity values.

To test the classification performance of the proposed features, K-means clustering is conducted to the original SAR image and two features, respectively. The results are shown in Figure 5. For the result of the original SAR image, too many noises are classified as ship targets. However, the results of the two proposed features perform excellently, where only a spot of misclassified pixels exist. This experiment powerfully demonstrates the feasibility of the proposed method in dealing with sea clutters in ship detection tasks. The scatter diagrams of the clustering results are shown in Figure 6. It is observed that the signal intensity of sea clutters is largely suppressed in the proposed features compared with that in the original SAR image.

Figure 5. K-means clustering results on the original SAR image and energy density features. (a) Results of the original SAR image; (b) results of F1; (c) results of F2.

Figure 6. Scatter diagrams of the distribution of ship and sea pixels in energy density features. (a) Scatter diagram of F1; (b) scatter diagram of F2.

The overall framework of the proposed method is shown in Figure 7. The key steps are given as follows.

Figure 7. The overall framework of the proposed EDIC method.

1) Divide the original SAR image into overlapped blocks by using a sliding window with the stride of 1 (to make the size of features the same as the original SAR image);

2) Conduct SVD on each block and extract the energy density features based on Equations (7) and (8);

3) Vectorize and combine the features as:

where the superscripts 1, 2, ..., M×N stand for the numbers of pixels in the image, (i, j) is the position of the pixel, and λ is a hyperparameter for adjusting the weight of two features. The hyperparameter λ can be set according to the noise level. F1 has strong universality, but the capability of denoising is less than F2. F2 has strong capability of denoising, but may cause some local speckles or a broader range of targets. In practice, F1 and F2 can be jointly used to yield better results. That is, if the noise level is relatively low, we can set a lower value of λ to make F1 dominate the classification and, vice versa;

4) Conduct classification using the K-means clustering algorithm and reshape the output image to obtain the final detection result.

4. Experimental Results

To further demonstrate the effectiveness of the proposed method, we test the performance of the proposed method and several existing algorithms using the SAR-ship-dataset [42] and SSDD (the SAR ship detection dataset) [43-44]. The algorithms selected for comparison in this paper include: two classical signal and image processing-based remote sensing object detectors (i.e. the CFAR [45] and the LCM [12]), and two state-of-the-art machine learning-based ship detection methods (i.e. the block region screening-support vector machine (BRS-SVM) [46] and the spatially enhanced pixel descriptor-modified density-based spatial clustering of applications with noises (SEPD-MDBSCAN) [47]).

Five image chips from the SAR-ship-dataset and four scenes from SSDD are, representatively, selected and tested, which contain different sea conditions and interferences including the strong sea clutter, sidelobe, ship wake, small ship targets, weak ship signal, etc. The detection results are displayed in Figures 8-12. Due to the complicated sea conditions of SSDD, all the ship targets are labeled with green boxes in original images to make the truth targets clear. Several quantitative indices (including the detection of targets (Dt), false alarms (Fa) and figure of merit (FoM) [48-49]) are introduced to assess the performance of all tested methods. The FoM is defined as:

Figure 8. Comparison of the detection results of ship chips in the SAR-ship-dataset. (a) Original image; (b) constant false alarm rate(CFAR); (c) local contrast method(LCM); (d) block region screening-support vector machine(BRS-SVM); (e) spatially enhanced pixel descriptor -modified density-based spatial clustering of applications with noises(SEPD-MDBSCAN); (f) the proposed energy density-induced clustering(EDIC).

Figure 9. Comparison of the detection results of Scene 1 (ship wake interference) in SAR ship detection dataset(SSDD). (a) Original image; (b) constant false alarm rate(CFAR); (c) local contrast method(LCM); block region screening-support vector machine(BRS-SVM);spatially enhanced pixel descriptor -modified density-based spatial clustering of applications with noises(SEPD-MDBSCAN); (f) the proposed energy density-induced clustering(EDIC).

Figure 10. Comparison of the detection results of Scene 2 (ship wake interference) in SAR ship detection dataset(SSDD). (a) Original image; (b) constant false alarm rate(CFAR); (c) local contrast method(LCM); block region screening-support vector machine(BRS-SVM);spatially enhanced pixel descriptor -modified density-based spatial clustering of applications with noises(SEPD-MDBSCAN); (f) the proposed energy density-induced clustering(EDIC).

Figure 11. Comparison of the detection results of Scene 3 (ship wake interference) in SAR ship detection dataset(SSDD). (a) Original image; (b) constant false alarm rate(CFAR); (c) local contrast method(LCM); block region screening-support vector machine(BRS-SVM);spatially enhanced pixel descriptor -modified density-based spatial clustering of applications with noises(SEPD-MDBSCAN); (f) the proposed energy density-induced clustering(EDIC).

Figure 12. Comparison of the detection results of Scene 4 (ship wake interference) in SAR ship detection dataset(SSDD). (a) Original image; (b) constant false alarm rate(CFAR); (c) local contrast method(LCM); block region screening-support vector machine(BRS-SVM);spatially enhanced pixel descriptor -modified density-based spatial clustering of applications with noises(SEPD-MDBSCAN); (f) the proposed energy density-induced clustering(EDIC).

where Gt denotes the number of truth targets.

The efficiency tests are conducted on all five methods as well. The hardware platform used for the efficiency tests is Intel(R) Core(TM) i5-8350U 1.9GHz CPU and 8GB RAM. The programming software is MATLAB R2019b.

The results of these quantitative indices are shown in Tables 2-5. Note that there is only one or two targets in each image chip of the SAR-ship-dataset, so Dt and FoM indices are only implemented on SSDD.

Table 2. Dt/Gt indices of the constant false alarm rate(CFAR), local contrast method(LCM), block region screening-support vector machine(BRS-SVM), spatially enhanced pixel descriptor -modified density-based spatial clustering of applications with noises(SEPD-MDBSCAN), the proposed energy density-induced clustering(EDIC).  

  CFAR LCM BRS-SVM SEPD-MDBSCAN EDIC(Proposed)
Scene 1 1/1 1/1 1/1 1/1 1/1
Scene 2 9/9 9/9 9/9 9/9 9/9
Scene 3 7/7 7/7 7/7 6/7 7/7
Scene 4 11/11 11/11 11/11 0/11 11/11


Table 3. Fa indices of the constant false alarm rate(CFAR), local contrast method(LCM), block region screening-support vector machine(BRS-SVM), spatially enhanced pixel descriptor -modified density-based spatial clustering of applications with noises(SEPD-MDBSCAN), the proposed energy density-induced clustering(EDIC).

    CFAR LCM BRS-SVM SEPD-MDBSCAN EDIC(Proposed)
SAR-Ship-Dataset Chip 1 116 194 29 10 7
Chip 2 168 215 54 26 4
Chip 3 165 53 13 0 4
Chip 4 105 101 23 0 0
Chip 5 128 90 4 94 3
Average 136.4 130.6 24.6 26 3.6
SSDD Scene 1 74 57 5 31 2
Scene 2 100 37 5 0 3
Scene 3 65 21 15 7 5
Scene 4 33 23 20 24 2
Average 68 34.5 11.25 15.5 3


Table 4. FoM indices of the constant false alarm rate(CFAR), local contrast method(LCM), block region screening-support vector machine(BRS-SVM), spatially enhanced pixel descriptor -modified density-based spatial clustering of applications with noises(SEPD-MDBSCAN), the proposed energy density-induced clustering(EDIC).

  CFAR LCM BRS-SVM SEPD-MDBSCAN EDIC(Proposed)
Scene 1 0.013 0.017 0.166 0.031 0.333
Scene 2 0.082 0.195 0.642 1.000 0.750
Scene 3 0.097 0.250 0.318 0.428 0.583
Scene 4 0.250 0.323 0.354 0.000 0.846
Average 0.110 0.196 0.370 0.364 0.628


Table 5. Efficiency test (seconds) of the constant false alarm rate(CFAR), local contrast method(LCM), block region screening-support vector machine(BRS-SVM), spatially enhanced pixel descriptor -modified density-based spatial clustering of applications with noises(SEPD-MDBSCAN), the proposed energy density-induced clustering(EDIC).

    CFAR LCM BRS-SVM SEPD-MDBSCAN EDIC(Proposed)
SAR-Ship-Dataset Chip 1 3.736 3.516 4.053 199.289 1.453
Chip 2 3.802 4.396 4.927 258.118 1.743
Chip 3 3.818 3.694 2.227 196.455 2.225
Chip 4 3.253 3.616 1.471 242.858 1.262
Chip 5 4.084 3.625 1.922 226.884 1.548
Average 3.738 3.769 2.920 224.720 1.646
SSDD Scene 1 8.122 9.068 2.797 1709.370 2.543
Scene 2 7.291 8.890 2.321 1601.219 2.250
Scene 3 7.188 10.010 4.096 1622.328 3.205
Scene 4 7.142 9.002 2.263 1822.917 3.232
Average 7.435 9.242 2.869 1688.958 2.807


Generally, for the results in the SAR-ship-dataset and SSDD, the proposed EDIC yields the best performance in both visual and quantitative aspects compared with other methods. All the ships in test images are well and completely detected with almost the fewest false alarms and without missed targets. The boundary of detected ships is clear. The efficiency of EDIC is the highest among the five methods.

CFAR is a local statistic modeling-based detector which results in the inherent false alarm rate, so a certain amount of sea clutter pixels is misclassified as ship targets. Moreover, the result of the CFAR detector is largely affected by the parameters of the window size and the false alarm rate, which limits its use in large-scale or complex scenes. If the window size and the ship size are largely different, the ship targets will be hardly detected. In practice, the scale and the shape of ship targets are quite varied and the sea conditions are complicated. Accordingly, these balances are hard to keep and the parameter adjustment work will be time-consuming when CFAR is used. For detection results, the ship targets are well-detected, but some interference such as strong sea clutters (especially the sidelobe and ship wake) are misclassified, as shown in Figures 9(b) and 10(b). Some small or weak signal ships are detected on several parts (Figure 12(b)).

LCM enhances the local contrast by using a cellular structure based on the intensity difference between targets and clutters, and then detects targets by threshold segmentation. However, this cellular enhancer mainly relies on the maximum value of the center cell and the mean values of neighbor cells, leading to noise and interference amplification in some strong sea-clutter areas. As such, there is a certain number of false alarms. For example, in Figures 8(c2) and 9(c), the strong noise and ship wake are enhanced and wrongly detected.

BRS-SVM extracts more than ten potential features (beneficial to ship detection) including intensity, texture and statistics information, and selects the three most effective ones (the mean value, grayscale variation coefficient and texture variation) by filter algorithms. In the experiments, BRS-SVM yields good results in some cases, while for strong interference, it leads to some false alarms in the sea area, see the results in Figures 8(d1) and 8(d2). In Figure 8(d4), the sidelobe interference is detected as the ship target. This is because 1) noises exist in both ship and sea areas; and 2) some texture or statistic features perform approximately in those areas and thus, possess less degree of distinction.

SEPD-MDBSCAN adopts a brand-new way to deal with interferences. It creates the high-dimension spacial intensity features based on local pixels, and then clusters the data points in the new feature space by using DBSCAN with the modified Mahalanobis distance. The clustering result contains two main classes (i.e. the noise and sea clutter), and the outliers are recognized as ship targets. This method can suppress the noise to a certain degree, but some strong sea clutters are still misclassified as ship targets, see Figures 8(e2) and 8(e5). In addition, SEPD-MDBSCAN has two fatal drawbacks. First, the ship structure may be incomplete in detection results, which can cause missed targets, especially for small and weak-signal ships. For example, in Figures 8(e3) and 8(e4), ship areas are broken into several parts. In Figure 11(e), a small ship target is not detected. In Figure 12(e), in which the ship signal is weak, all ship targets are missing. Second, the new feature space is quite redundant because the intensity information is similar in a local region. The clustering process is conducted in a so extremely high-dimension feature space that causes the curse of dimensionality. The efficiency test in Table 5 proves the very high computational complexity of SEPD-MDBSCAN. What is more, the parameter epsilon neighborhood in SEPD-MDBSCAN has to be adjusted manually in different scenes, which constrains its automatic application.

In summary, the proposed EDIC can effectively represent the most useful characters of ship targets, and distinguish ship targets and all kinds of interferences including the sea clutter, sidelobe, ship wake and so on. EDIC performs well for all kinds of ship targets in different sizes, which powerfully demonstrates that, compared with traditional features such as intensity, texture, statistical representation and so on, the distinction of singular values can better distinguish ship targets from interferences with less complexity and redundancy. Although SVD has been widely used in image denoising, the existing SVD-based methods merely conduct the SVD on the whole image, select the top several singular values for image reconstruction, and filter the others [50-52], and this reduces the noise but sacrifices the image quality. The proposed EDIC method analyzes all the singular values and takes the advantage of the difference of the singular values on the target region and interference area, which results in significant improvement. Compared with other methods, the parameters in EDIC can be easily adjusted and determined, resulting in strong adaptability. Furthermore, EDIC is efficient in both feature extraction and classification in various scenes, which demonstrates its great potential in automatic ship monitoring for large-scale sea areas.

5. Conclusions

In this paper, a novel unsupervised machine learning-based SAR ship detection method, i.e. the EDIC, has been proposed. The key novelty of the EDIC can be mainly attributed to the proposed energy density features that take advantage of the distinction of the singular values between ship targets and sea noises. Via these features, the ship targets can be highlighted and the most kinds of noises are effectively suppressed. The experiment results have shown that the proposed EDIC outstandingly performs both classical and state-of-the-art methods subject to interferences including the strong sea clutter, sidelobe, ship wake, etc. Accordingly, the proposed EDIC is suitable for the intelligent monitoring of ship targets in large-scale sea areas with complicated conditions in SAR imagery. Future work will be carried out to explore the potential of the proposed energy density-based features on a variety of target detection tasks by using the proposed unsupervised clustering and other supervised classification algorithms [53-59] including the neural networks, random forest, etc.

Author Contributions: Zifeng Yuan: conceptualization, data curation, investigation, methodology, validation, visualization, writing-original draft; Yu Li: conceptualization, methodology, supervision, writing-review & editing; Yu Liu: formal analysis; Jiale Liang: formal analysis; Yuanzhi Zhang: funding acquisition, writing-review & editing. All authors have read and agreed to the published version of the manuscript.

Funding: This work was supported in part by the National Key Research and Development Program of China (2021YFA0715101), and the Natural Science Foundation of China (41706201).

Data Availability Statement: The SAR-Ship-Dataset can be downloaded from: (https://radars.ac.cn/web/data/getData?dataType=SARGroundObjectsTypes) and SSDD can be downloaded from: (https://github.com/TianwenZhang0825/Official-SSDD).

References

  1. Lee, J.S.; Pottier, E. Polarimetric Radar Imaging: From Basics to Applications; CRC Press: Boca Raton, 2009.
  2. Li, Y.; Zhang, Y.Z.; Yuan, Z.F.; et al. Marine oil spill detection based on the comprehensive use of polarimetric SAR data. Sustainability, 2018, 10: 4408.
  3. Chen, G.D.; Li, Y.; Sun, G.M.; et al. Application of deep networks to oil spill detection using polarimetric synthetic aperture radar images. Appl. Sci., 2017, 7: 968.
  4. Miao, T.; Zeng, H.C.; Yang, W.; et al. An improved lightweight RetinaNet for ship detection in SAR images. IEEE J. Sel. Top. Appl. Earth Obs. Remote Sens., 2022, 15: 4667−4679.
  5. Zhang, Y.Z.; Li, Y.; Liang, X.S.; et al. Comparison of oil spill classifications using fully and compact polarimetric SAR images. Appl. Sci., 2017, 7: 193.
  6. Bai, Y.K.; Sun, G.M.; Li, Y.; et al. Comprehensively analyzing optical and polarimetric SAR features for land-use/land-cover classification and urban vegetation extraction in highly-dense urban area. Int. J. Appl. Earth Obs. Geoinf., 2021, 103: 102496.
  7. Gandhi, P.P.; Kassam, S.A. Analysis of CFAR processors in nonhomogeneous background. IEEE Trans. Aerosp. Electron. Syst., 1988, 24: 427−445.
  8. Liu, T.; Zhang, J.F.; Gao, G.; et al. CFAR ship detection in polarimetric synthetic aperture radar images based on whitening filter. IEEE Trans. Geosci. Remote Sens., 2020, 58: 58−81.
  9. Wang, C.L.; Bi, F.K.; Zhang, W.P.; et al. An intensity-space domain CFAR method for ship detection in HR SAR images. IEEE Geosci. Remote Sens. Lett., 2017, 14: 529−533.
  10. Qin, X.X.; Zhou, S.L.; Zou, H.X.; et al. A CFAR detection algorithm for generalized gamma distributed background in high-resolution SAR images. IEEE Geosci. Remote Sens. Lett., 2013, 10: 806−810.
  11. Li, Y.; Yuan, Z.F.; Zheng, K.; et al. A novel detail weighted histogram equalization method for brightness preserving image enhancement based on partial statistic and global mapping model. IET Image Process., 2022, 16: 3325−3341.
  12. Chen, C.L.P.; Li, H.; Wei, Y.T.; et al. A local contrast method for small infrared target detection. IEEE Trans. Geosci. Remote Sens., 2014, 52: 574−581.
  13. Wang, X.L.; Chen, C.X. Ship detection for complex background SAR images based on a multiscale variance weighted image entropy method. IEEE Geosci. Remote Sens. Lett., 2017, 14: 184−187.
  14. Wang, X.L.; Chen, C.X.; Pan, Z.; et al. Fast and automatic ship detection for SAR imagery based on multiscale contrast measure. IEEE Geosci. Remote Sens. Lett., 2019, 16: 1834−1838.
  15. Achanta, R.; Shaji, A.; Smith, K.; et al. SLIC superpixels compared to state-of-the-art superpixel methods. IEEE Trans. Pattern Anal. Mach. Intell., 2012, 34: 2274−2282.
  16. Wang, X.Q.; Li, G.; Zhang, X.P.; et al. Ship detection in SAR images via local contrast of Fisher vectors. IEEE Trans. Geosci. Remote Sens., 2020, 58: 6467−6479.
  17. Li, T.; Liu, Z.; Xie, R.; et al. An improved superpixel-level CFAR detection method for ship targets in high-resolution SAR images. IEEE J. Sel. Top. Appl. Earth Obs. Remote Sens., 2018, 11: 184−194.
  18. Xie, T.; Huang, J.J.; Shi, Q. Z.; et al. PSDSD-A superpixel generating method based on pixel saliency difference and spatial distance for SAR images. Sensors, 2019, 19: 304.
  19. Tirandaz, Z.; Akbarizadeh, G.; Kaabi, H. PolSAR image segmentation based on feature extraction and data compression using weighted neighborhood filter bank and hidden Markov random field-expectation maximization. Measurement, 2020, 153: 107432.
  20. Hwang, J.I.; Jung, H.S. Automatic ship detection using the artificial neural network and support vector machine from X-band SAR satellite images. Remote Sens., 2018, 10: 1799.
  21. Baek, W.K.; Jung, H.S. Performance comparison of oil spill and ship classification from X-band dual- and single-polarized SAR image using support vector machine, random forest, and deep neural network. Remote Sens., 2021, 13: 3203.
  22. Li, H.L.; Cui, X.C.; Chen, S.W. PolSAR ship detection with optimal polarimetric rotation domain features and SVM. Remote Sens., 2021, 13: 3932.
  23. Wang, H.B.; Zhao, Y.C.; Wang, H.N.; et al. Ship detection in compact polarimetric SAR imagery based on weighted SVM and m-χ decomposition. J. Terahertz Sci. Electron. Inf. Technol., 2016, 14: 554−561.
  24. Lin, H.P.; Chen, H.; Jin, K.; et al. Ship detection with superpixel-level Fisher vector in high-resolution SAR images. IEEE Geosci. Remote Sens. Lett., 2020, 17: 247−251.
  25. Aghaei, N.; Akbarizadeh, G.; Kosarian, A. GreyWolfLSM: An accurate oil spill detection method based on level set method from synthetic aperture radar imagery. Eur. J. Remote Sens., 2022, 55: 181−198.
  26. Zhou, Z.; Cui, Z.Y.; Cao, Z.J.; et al. Feature-transferable pyramid network for cross-scale object detection in SAR images. J. Radars, 2021, 10: 544−558.
  27. Zhang, J.S.; Xing, M.D.; Sun, G.C.; et al. Oriented gaussian function-based box boundary-aware vectors for oriented ship detection in multiresolution SAR imagery. IEEE Trans. Geosci. Remote Sens., 2022, 60: 5211015.
  28. Sun, Y.R.; Sun, X.; Wang, Z.R.; et al. Oriented ship detection based on strong scattering points network in large-scale SAR images. IEEE Trans. Geosci. Remote Sens., 2022, 60: 5218018.
  29. Li, X.Q.; Li, D.; Liu, H.Q.; et al. A-BFPN: An attention-guided balanced feature pyramid network for SAR ship detection. Remote Sens., 2022, 14: 3829.
  30. Fu, J.M.; Sun, X.; Wang, Z.R.; et al. An anchor-free method based on feature balancing and refinement network for multiscale ship detection in SAR images. IEEE Trans. Geosci. Remote Sens., 2021, 59: 1331−1344.
  31. Jiao, J.; Zhang, Y.; Sun, H.; et al. A densely connected end-to-end neural network for multiscale and multiscene SAR ship detection. IEEE Access, 2018, 6: 20881−20892.
  32. Lv, J.M.; Chen, J.; Huang, Z.X.; et al. An anchor-free detection algorithm for SAR ship targets with deep saliency representation. Remote Sens., 2023, 15: 103.
  33. Fu, K.; Li, Y.; Sun, H.; et al. A ship rotation detection model in remote sensing images based on feature fusion pyramid network and deep reinforcement learning. Remote Sens., 2018, 10: 1922.
  34. Sharifzadeh, F.; Akbarizadeh, G.; Kavian, Y.S. Ship classification in SAR images using a new hybrid CNN–MLP classifier. J. Indian Soc. Remote Sens., 2019, 47: 551−562.
  35. Samadi, F.; Akbarizadeh, G.; Kaabi, H. Change detection in SAR images using deep belief network: a new training approach based on morphological images. IET Image Process., 2019, 13: 2255−2264.
  36. Brunton, S.L.; Kutz, J.N. Data-Driven Science and Engineering: Machine Learning, Dynamical Systems, and Control; Cambridge University Press: New York, NY, USA, 2019. doi: 10.1017/9781108380690.
  37. Krishna, K.; Murty, M.N. Genetic K-means algorithm. IEEE Trans. Syst., Man, Cybern., Part B (Cybern.), 1999, 29: 433−439.
  38. Shu, Y.M.; Li, J.; Yousif, H.; et al. Dark-spot detection from SAR intensity imagery with spatial density thresholding for oil-spill monitoring. Remote Sens. Environ., 2010, 114: 2026−2035.
  39. Feng, X.G.; Milanfar, P. Multiscale principal components analysis for image local orientation estimation. In Conference Record of the Thirty-Sixth Asilomar Conference on Signals, Systems and Computers, 2002, Pacific Grove, CA, USA, 3–6 November 2002; IEEE: New York, 2002; pp. 478–482. doi:10.1109/ACSSC.2002.1197228
  40. Singh, K.; Vishwakarma, D.K.; Walia, G.S.; et al. Contrast enhancement via texture region based histogram equalization. J. Mod. Opt., 2016, 63: 1444−1450.
  41. Zhang, T.; Wang, W.; Quan, S.N.; et al. Region-based polarimetric covariance difference matrix for PolSAR ship detection. IEEE Trans. Geosci. Remote Sens., 2022, 60: 1−16.
  42. Wang, Y.Y.; Wang, C.; Zhang, H.; et al. A SAR dataset of ship detection for deep learning under complex backgrounds. Remote Sens., 2019, 11: 765.
  43. Zhang, T.W.; Zhang, X.L.; Li, J.W.; et al. SAR ship detection dataset (SSDD): Official release and comprehensive data analysis. Remote Sens., 2021, 13: 3690.
  44. Li, J.W.; Qu, C.W.; Shao, J.Q. Ship detection in SAR images based on an improved faster R-CNN. In 2017 SAR in Big Data Era: Models, Methods and Applications, Beijing, China, 13–14 November 2017; IEEE: New York, 2017; pp. 1–6. doi:10.1109/BIGSARDATA.2017.8124934
  45. di Bisceglie, M.; Galdi, C. CFAR detection of extended objects in high-resolution SAR images. IEEE Trans. Geosci. Remote Sens., 2005, 43: 833−843.
  46. Xiong, W.; Xu, Y.L.; Yao, L.B.; et al. A new ship target detection algorithm based on SVM in high resolution SAR images. Remote Sens. Technol. Appl., 2018, 33: 119−127.
  47. Lang, H.T.; Xi, Y.Y.; Zhang, X. Ship detection in high-resolution SAR images by clustering spatially enhanced pixel descriptor. IEEE Trans. Geosci. Remote Sens., 2019, 57: 5407−5423.
  48. Zhang, T.; Jiang, L.F.; Xiang, D.L.; et al. Ship detection from PolSAR imagery using the ambiguity removal polarimetric notch filter. ISPRS J. Photogramm. Remote Sens., 2019, 157: 41−58.
  49. Wang, X.L.; Chen, C.X.; Pan, Z.; et al. Superpixel-based LCM detector for faint ships hidden in strong noise background SAR imagery. IEEE Geosci. Remote Sens. Lett., 2019, 16: 417−421.
  50. Zou, Z.X.; Shi, Z.W. Ship detection in spaceborne optical image with SVD networks. IEEE Trans. Geosci. Remote Sens., 2016, 54: 5832−5845.
  51. Ai, J.Q. The application of SVD-based speckle reduction and tophat transform in preprocessing of ship detection. In IET International Radar Conference 2015, Hangzhou, China, 14–16 October 2015; IEEE: New York, 2015; pp. 1–4. doi:10.1049/cp.2015.0962
  52. Qi, J.L.; Sun, L.; Li, K.P.; et al. Gaussian noise parameter estimation based on multiple singular value decomposition and non-linear fitting. IET Image Process., 2022, 16: 3025−3038.
  53. Aghaei, N.; Akbarizadeh, G.; Kosarian, A. Osdes_net: Oil spill detection based on efficient_shuffle network using synthetic aperture radar imagery. Geocarto Int., 2022, 37: 13539−13560.
  54. Ghara, F.M.; Shokouhi, S.B.; Akbarizadeh, G. A new technique for segmentation of the oil spills from synthetic-aperture radar images using convolutional neural network. IEEE J. Sel. Top. Appl. Earth Obs. Remote Sens., 2022, 15: 8834−8844.
  55. Sun, Y.R.; Wang, Z.R.; Sun, X.; et al. SPAN: Strong scattering point aware network for ship detection and classification in large-scale SAR imagery. IEEE J. Sel. Top. Appl. Earth Obs. Remote Sens., 2022, 15: 1188−1204.
  56. Zhu, Y.G.; Sun, X.; Diao, W.H.; et al. RFA-Net: Reconstructed feature alignment network for domain adaptation object detection in remote sensing imagery. IEEE J. Sel. Top. Appl. Earth Obs. Remote Sens., 2022, 15: 5689−5703.
  57. Wang, B.; Wang, Z.R.; Sun, X.; et al. DMML-Net: Deep metametric learning for few-shot geographic object segmentation in remote sensing imagery. IEEE Trans. Geosci. Remote Sens., 2022, 60: 5611118.
  58. Kang, Y.Z.; Wang, Z.R.; Fu, J.M.; et al. SFR-Net: Scattering feature relation network for aircraft detection in complex SAR images. IEEE Trans. Geosci. Remote Sens., 2022, 60: 5218317.
  59. Li, Y.; Yuan, Z.F.; Meng, Z.G.; et al. A unified brightness temperature features analysis framework for mapping mare basalt units using Chang’e-2 lunar microwave sounder (CELMS) data. Remote Sens., 2023, 15: 1910.