

Downloads
Download


This work is licensed under a Creative Commons Attribution 4.0 International License.
Article
Metal Surface Defect Detection Based on Metal-YOLOX
Xiaoli Yue , Jiandong Chen , and Guoqiang Zhong *
1 College of Computer Science and Technology, Ocean University of China, Qingdao 266000, China
* Correspondence: gqzhong@ouc.edu.cn
Received: 14 June 2023
Accepted: 13 September 2023
Published: 21 December 2023
Abstract: Due to the limitations of manufacture technologies, working environments and other conditions, metals (such as steel and aluminum) are susceptible to surface defects during the production process. Therefore, defect detection is an indispensable part of metal manufacturing. This paper innovatively proposes a one-stage defect detection model named Metal-YOLOX. Metal-YOLOX addresses the limitations in existing models posed by large variances in defect features and inadequate balance between detection accuracy and efficiency. Firstly, the composite convolution module of Metal-YOLOX integrates texture, dilated and deformable convolutions to filter out irrelevant features and extract effective feature information. Secondly, the feature cross-fusion module (HCNet) alleviates the problem of large dimensional differences in defects. HCNet uses skip connections to establish the connection between the original multi-scale features and the output nodes, and reduces the addition of redundant information. Thirdly, Metal-YOLOX adopts the deep separable convolution and global channel reduction. This lightweight design helps reduce computational complexity. Finally, detailed experiments demonstrate that, in terms of mean average precision, Metal-YOLOX achieves 79.83, 69.14, and 81.22 on the NEU-DET, GC-10 and Aluminum datasets, respectively. Furthermore, Metal-YOLOX dramatically reduces parameter number and computational complexity. The experiments validate that the Metal-YOLOX model improves the detection performance, maintains the detection speed, and meets the real-time requirements.
Keywords:
surface defect detection object detection feature extraction feature fusion1. Introduction
Scratches, indentations, and spots on metal surfaces are common defects during industrial manufacturing. These defects are caused by the limitations or deficiencies of various factors such as raw materials, processing technologies, and operating environments. Such defects can significantly impact product quality, particularly in high-end manufacturing. Consequently, a hot topic of current research is to find efficient and effective methods to detect and classify metal surface defects promptly. Traditional metal surface defect detection usually relies on manual inspection, which is labor-intensive and time-consuming. In addition, manual inspection inevitably depends on subjective factors that could contribute to missed detection and false detection, thereby limiting the stability and accuracy of the detection process. With the rise of defect detection systems based on machine vision, the inspection process has now become partially automated. Defect detection based on machine vision falls into three main categories. 1) Statistical and spectral methods are used to characterize the texture of defects [1, 2]. 2) Color histogram, color moment, and color coherence vector are used to describe the color characteristics of defects [3, 4]. 3) Hough transform and fourier shape descriptors are used to describe the shape features [5, 6]. It should be noted that there are limitations in accuracy and efficiency. Specifically, the process involves the manual setting of colors, textures, and shape features [7], which fails to fulfill the generalization and intelligence requirements of metal surface defect detection. In addition, existing techniques might not perform well due to the issue of imbalanced and insufficient datasets. Wang et al. [8] proposed two methods for data augmentation, i.e. a contrastive adversarial network for minor-class data augmentation and an adversarial self-attention network for subdomain-alignment data augmentation. The former proposes a new distance metric to excavate features associated with operating conditions and generate data with improved compactness as well as enhanced discrimination. The latter [9] features a novel temporal association learning (TAL) mechanism, which transfers temporal information from the discriminator to the generator via a customized knowledge-sharing structure, thereby improving the reliability of synthetic long-range associations.
In recent years, the rapid iterations of deep learning techniques have provided vigorous impetus for the development of defect detection [10-13]. Compared to previous methods, applying object detection algorithms in deep learning to defect detection can achieve more accurate and efficient defect classification and location identification performances [14]. Current research mainly includes one-stage algorithms (e.g., YOLO [15], RetinaNet [16], and SSD [17]) which are known for their detection efficiency, and two-stage algorithms (e.g., Faster-RCNN [18]) which are known for their detection accuracy. Note that in one-stage networks, region proposals are not required to be generated before detection. In fact, the defect detection problem is transformed into a regression problem which is later solved based on the features extracted by the backbone network. As a result, one-stage networks are more advantageous in terms of speed, but may not be as accurate as two-stage networks.
Specifically, based on a defect dataset of the printed circuit board (PCB), Ding et al. [11] achieved mean average precision (mAP) of 98.90 by using K-means clustering to design appropriate anchor box sizes and incorporating FPNs into a faster R-CNN model, although these complex components would lead to inefficient detection. As the single shot multibox detector (SSD) model detects poorly for images with complex or small targets, Liu et al. [13] improved the SSD algorithm to achieve mAP of 94.3 on the support component dataset of a high-speed railway catenary by adopting MobileNet as the backbone network. Wang et al. [19] improved the detection accuracy on an aluminum profile defect dataset by introducing the multi-scale convolution and ECA attention mechanism [20] in the YOLOv5 network. As Figure 1 indicates, defect detection on metal surfaces encounters three primary challenges. 1) Large differences in defects. Due to the production process and the surrounding environment, many types of metal surface defects have variable shapes and sizes, which necessitates a defect detection model with high multi-scale detection capability. 2) Indistinct defect features. Metal surface defects are difficult distinguish from the background due to factors like lighting and background colors. Meanwhile, there is little difference among different types of defects. 3) Balance between the detection accuracy and efficiency. One-stage detection algorithms trade off accuracy for higher efficiency, while two-stage detection algorithms increase the screening of candidate boxes to improve detection accuracy. Balancing detection accuracy and efficiency is crucial in the design of defect detection models. In conclusion, defect detection based on object detection has considerable room for improvement.
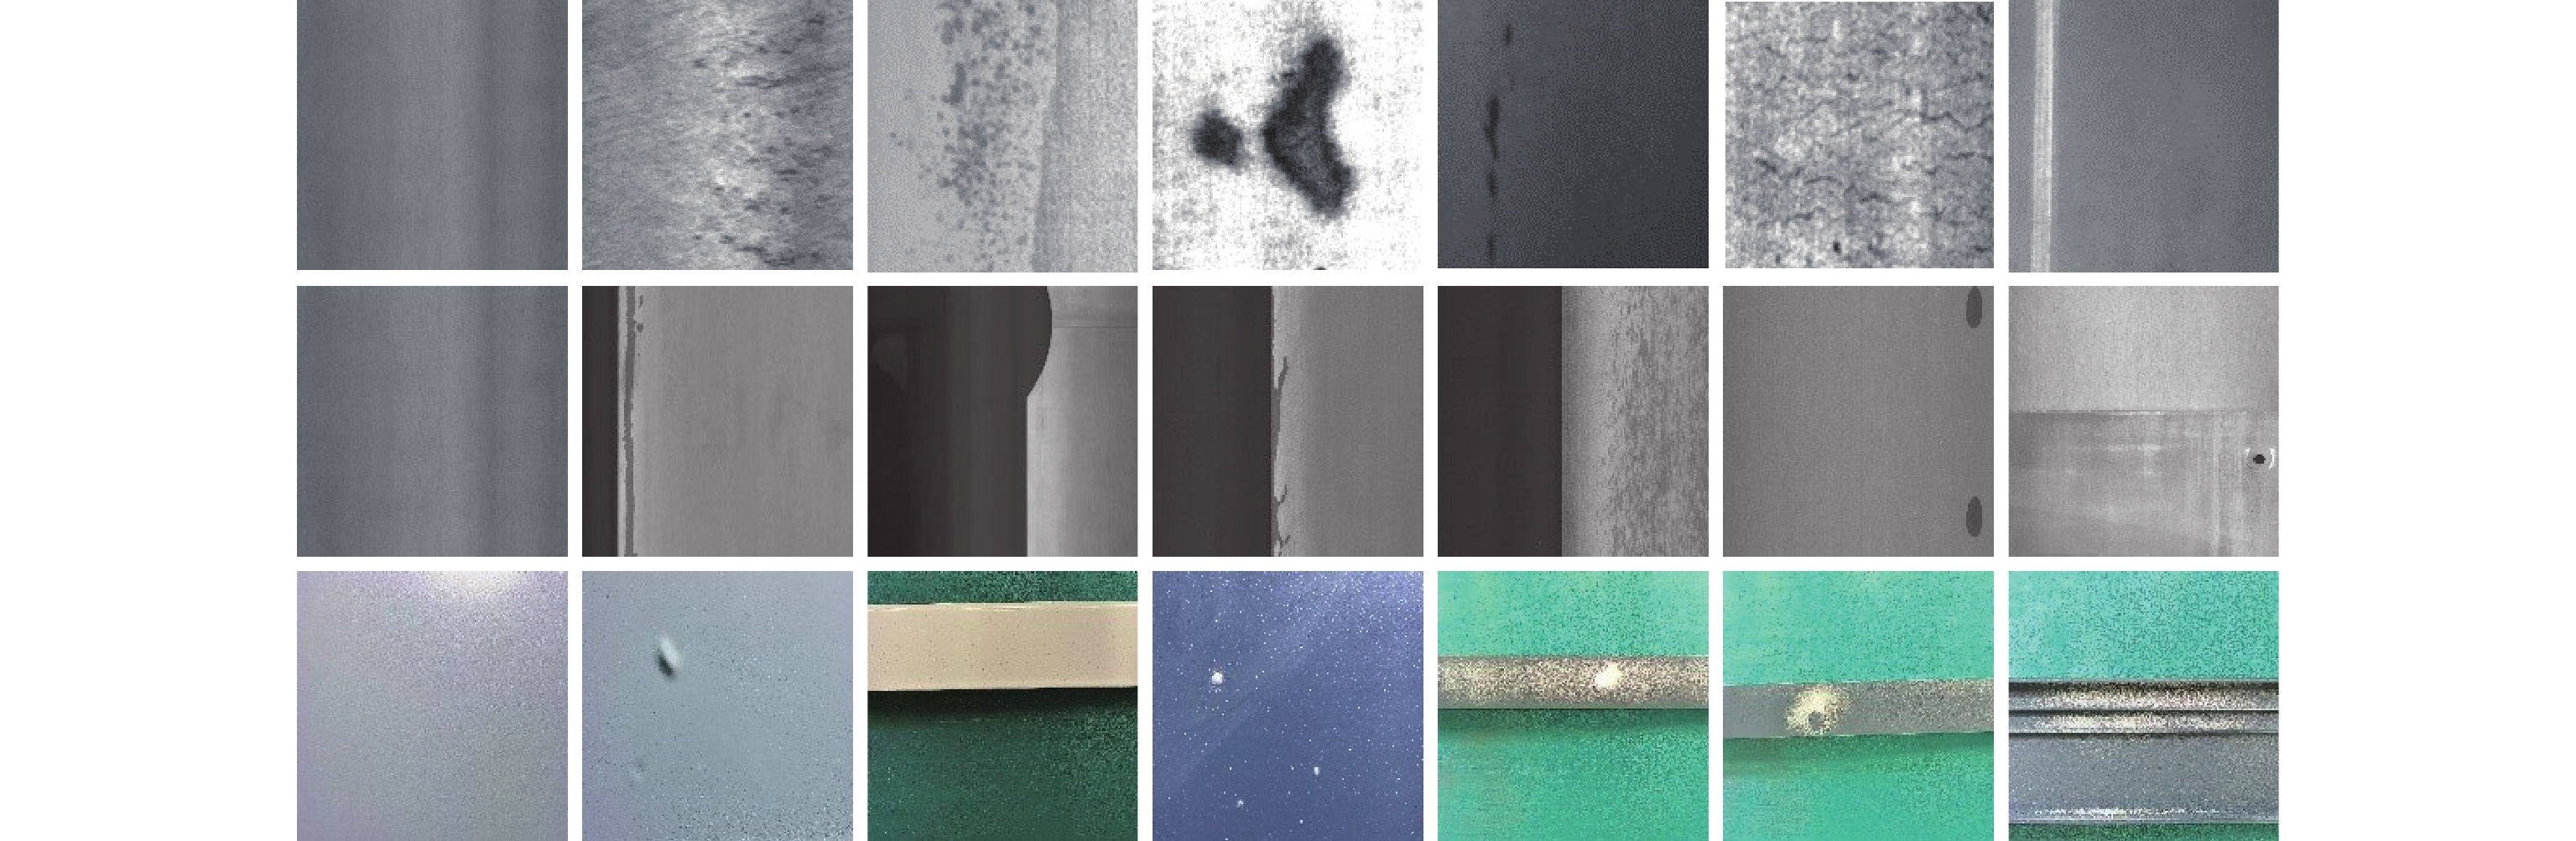
Figure 1. Illustrations of three types of normal samples and several common types of defect samples, where the first column represents normal samples, and the remaining columns represent several common types of defects. For example, the first row from left to right are rolled-in scale, pitted surface, patches, inclusion, crazing and scratches.
In this paper, considering the above problems, we propose an efficient and accurate one-stage defect detection model called Metal-YOLOX. Firstly, this paper summarizes and analyzes the typical defects on metal surfaces. Then, we explore the potential relationship between the convolution and the defect feature extraction. Based on the information above, we design the composite convolution module to extract semantic defect feature information effectively. Secondly, this paper investigates a multiscale feature fusion method to replace the original feature fusion module of the YOLOX model. This method fuses the semantic information from the feature extraction module to achieve feature compression and refinement across multiple scales. Finally, we propose a lightweight model design. This design reduces the number of parameters in the convolutional layers and model structures to prevent the efficiency decrease of model detection caused by improving the model detection accuracy. The contributions of this paper are summarised as follows.
1) The composite convolution module (i.e. TGSR) is a composite convolution that combines texture, dilated, and deformable convolutions to detect linear, large-area, and irregular defects on metal surfaces. TGSR achieves directed separation of defect features from the feature map.
2) The feature cross-fusion module (i.e. HCNet) enhances the efficiency of detecting multi-scale defects by reducing redundant information and enhancing computation parallelism.
3) To improve Metal-YOLOX’s defect localization performance, this paper uses global lightweight and loss function optimization. These operations decrease the number of parameters.
4) The experimental results show that Metal-YOLOX exhibits accuracy and efficiency improvement as compared to advanced methods on the NEU-DET [21], GC-10 [22], and Aluminum [23] datasets.
2. The Metal Surface Defect Detection Scheme
2.1. Scheme Overview
Metal-YOLOX is proposed to detect metal surface defects accurately while maintaining detection efficiency. The overall architecture of the Metal-YOLOX model is shown in Figure 2, which partially adopts the design structure of YOLOX. There are two main reasons for utilizing YOLOX as the fundamental structure. On one hand, YOLOX adopts an anchor-free design pattern to dramatically reduce the number of hyperparameters and guarantee the generalization of the model without relying on prior knowledge. On the other hand, YOLOX improves the shared detection head structure to a decoupled head structure. This improvement is inspired by research on the relationship between classification and localization tasks [24, 25]. Based on these advantages, Metal-YOLOX retains the structure of the backbone network and the decoupled head in YOLOX, while improving the feature extraction and fusion performances.

Figure 2. Metal-YOLOX model architecture.
As shown in Figure 2, Metal-YOLOX uses TGSR and HCNet to replace the original feature pyramid network PANet [26]. Firstly, TGSR is located in the middle of the backbone network and the feature fusion network to filter out the defect features in the multi-scale feature maps passed from the backbone network. Secondly, HCNet enhances the independence of the top-down and bottom-up fusion of feature information after receiving rich feature outputs from TGSR. HCNet avoids repeated addition of feature information during fusion, and ensures diversity in the fusion results. Thirdly, Metal-YOLOX optimizes the loss function on localization in the decoupled head, considers the position and shapes of the prediction box, and uses CIoU and  to optimize the regression loss. Based on the designs above, this paper further proposes a lightweight Metal-YOLOX-s.
2.2. Composite Convolution Module
CSPDarknet [27] has excellent feature extraction capability and can extract rich features of different sizes from input data. CSPDarknet is the backbone network for Metal-YOLOX and is commonly used in YOLO-based defect detection models. The YOLO series first select three adequate feature layers from the backbone network and pass them to the subsequent feature pyramid network to construct the main structure of feature extraction. However, not all feature maps (output by these effective feature layers) contain adequate information to facilitate the classification and localization of defects. Therefore, in order to enhance the extraction of metal surface defect features, this paper proposes the TGSR module to achieve the filtering of irrelevant feature information and the extraction of effective feature information by compounding multiple convolutional operations with different functions. As illustrated in Figure 3, TGSR can be divided into four parts, i.e. texture perception, global perception, shape perception, and residual connection. Next, we will detail the design principles of these four parts.
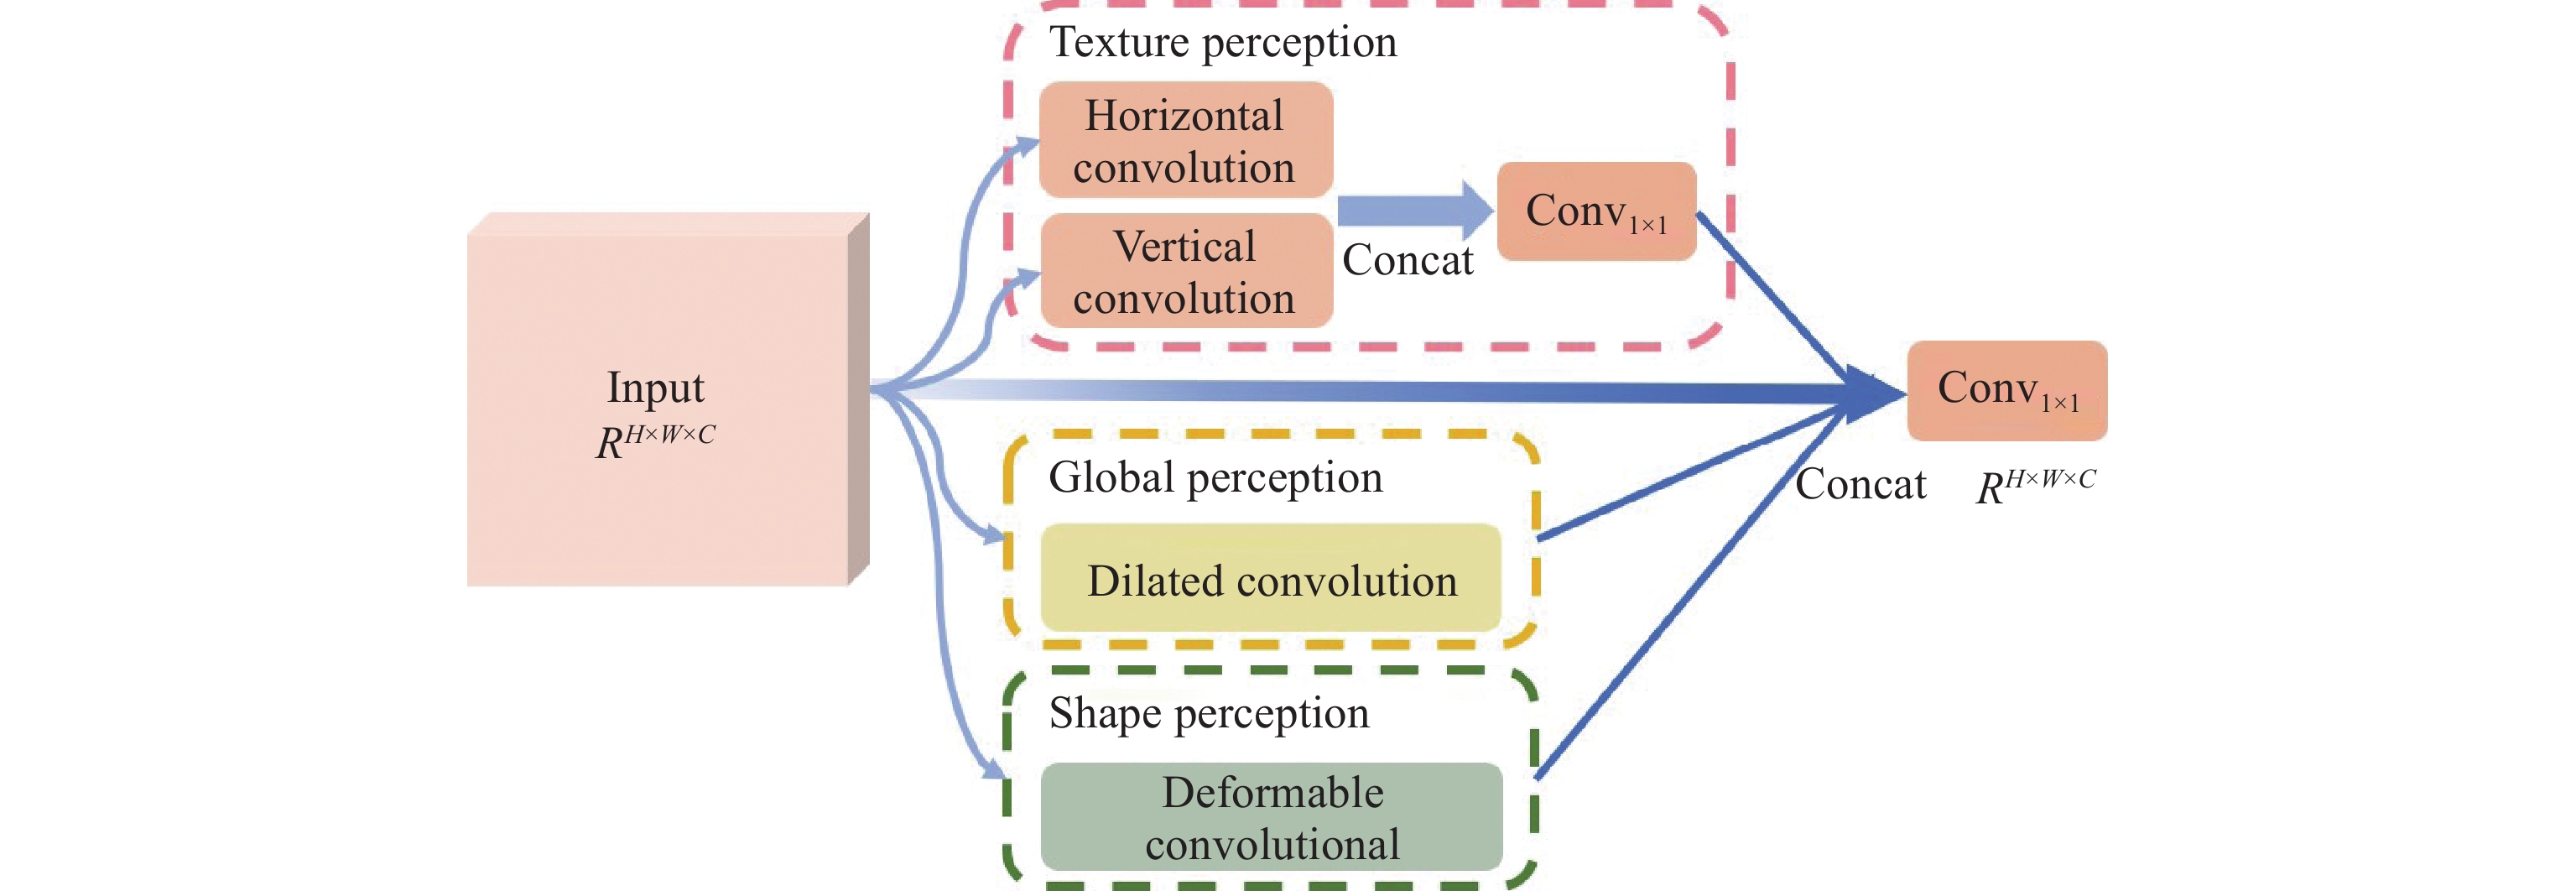
Figure 3. Structural diagram of the TGSR.
Texture perception: Linear defects, represented by folds, rolled pits, and scratches, are typically observed on metal surfaces. In order to extract texture feature information from these kinds of defects, we are going to employ horizontal and vertical convolutions. The horizontal convolution  and the vertical convolution
  use convolutional kernels of size
  and
and  , respectively. Compared to regular convolutions that use square kernels (e.g.,
  convolution), horizontal and vertical convolutions extract orientation features of linear defects, providing more accurate classification. In the meantime, a smaller convolutional kernel ensures the ability to extract small features such as dirty spots. After the horizontal and vertical convolutions, the texture perception module concatenates the feature maps of the output and feeds them to 1 × 1 convolution
  to reduce the number of channels. The calculation process is shown in Equation (1).

where  is the feature map given by the effective feature layer in the backbone network;
  ,
,  and
and  correspond to the height, width, and number of channels of the feature map, respectively; and
  is the feature map of texture perception, which is later concatenated with the output of the remaining three parts.
Global perception: Defects like cracks and pits are widely distributed on metal surfaces. Increasing the receptive field of convolutional operations can effectively enhance the extraction of features of large defects. Enlarging the size of the convolutional kernel is one way to increase the receptive field, but results in a significant increase in the number of parameters, which is positively correlated with the size of the convolutional kernel. Therefore, the dilated convolution (DC) [28] is used in the global perception part to obtain higher semantic-level features by increasing the perception field. Dilated convolution, inspired by interval sampling, does not change the size of the convolutional kernel, and is calculated based on the given interval and pixel on the feature map. Furthermore, the dilated convolution controls the size of the receptive field  through the expansion rate
  which is calculated by Equation (2).

where  and
and  represent the width and height of the convolutional kernel. The regular convolution can be viewed as a particular case of the dilated convolution with
  . Although the dilated convolution may result in some loss of local information, this can be effectively mitigated by the consistency of images and the supplementation of other semantic information in TGSR. Therefore, the dilated convolution can contribute to the improvement of the detection performance.
Shape perception: The shapes of defects do not always exhibit certain regularity. Defects on metal surfaces have a sizeable inter-class variation, meaning defects within the same category can show remarkably different shapes. To alleviate the problem of poor convolutional performances in detecting complex-shaped defects, TGSR introduces the deformable convolutional networks (DCNs) [29]. DCNs utilize differentiable offsets to fit the receptive field to the actual shape of the defect. The calculation of a regular convolution can be defined by Equation (3), where  is the input feature map, and
  is the output feature map. Using the expression of the centroid
  and the offset
  ,
,  can be represented as any pixel under the coverage area of the convolutional kernel. Note that in the feature map
  , the points operated by the convolutional kernel are restricted to the area covered by the kernel. Therefore, the deformable convolution adds an offset
  to each pixel as shown in Equation (4). After the above operations, the position information of the defect features is more accurately included in the feature map, thus promoting the improvement of localization accuracy,


Residual connection: To avoid the adverse effects of gradient disappearance, we connect the feature maps of the backbone network’s effective feature layer directly to the TGSR’s final output based on the design idea of residual edges. At the same time, this residual connection can also supplement the feature semantic information, ensuring the lower limit of feature extraction.
The output feature maps are concatenated together based on the four parts above. Then, the number of channels is reduced using  convolution. At this point, the TGSR module obtains enhanced feature maps consistent with the original feature map in both size and channel number.
2.3. Feature Cross-Fusion Module
YOLOX uses PANet [26] as the feature fusion module which needs to include more redundant information. As shown in Figure 4, PANet fuses the high-level feature map  with the middle-level
  and low-level layer
  from top to bottom. After downsampling, the result is fused with the middle-level layer
  and the high-level layer
  to obtain the feature fusion result
  . This process involves repeated fusion and induces the accumulation of redundant feature information in the fusion results, which can lead to weakened feature diversity in the fusion process. Inspired by BiFPN [30], HCNet uses skip connections to establish connections between the original multiscale features and output nodes. HCNet facilitates complete feature transmission as well as the fusion of high-level feature semantic information output by the TGSR module.

Figure 4. Schematic of PANet (a) [26], BiFPN (b) [30] and HCNet (c) and structure of HCNet (d).
The structure of HCNet is shown in Figure 4(d). After receiving three sets of feature maps of different sizes  from the TGSR module,
  is concatenated with
  to obtain
  .
.  is then fused with
  after repeating the above operation to obtain
  (see Equation (5)). At this point, HCNet completes the top-down fusion process. In the bottom-up fusion process,
  is downsampled, and
  is obtained by Equation (6) after
  is concatenated and convolved with
  .
.  is obtained after fusion of
  ,
,  and
and  , see Equation (7). In the above equations,
  ,
,  , and
, and  represent the concatenation, sampling, and downsampling operations, respectively.
  represents the regular
  convolution which can be replaced by the depth separable convolution in the subsequent lightweight design. The structure of HCNet only has a shortcut between
  and
and  , and the rest of the feature maps can be computed in parallel after the computation of
  . The calculation process is shown as follows:


2.4. Global Lightweight and Loss Function Optimization
Global lightweight: Within the structure of the Metal-YOLOX model, the lightweight design has been incorporated into the TGSR and HCNet modules. For example, the TGSR module uses tricks such as residual connections and decreased channel numbers, while HCNet employs fewer convolutional operations than PANet. Nevertheless, such a design is only effective locally and cannot achieve significant lightweight for the entire Metal-YOLOX model. Therefore, this paper proposes the Metal-YOLOX-s model, which uses the depthwise separable convolution (DSC) [31] to replace the original convolutions, thus reducing the number of model parameters. Metal-YOLOX-s improves defect detection efficiency by replacing regular convolutions with DSC in the backbone network, HCNet, and the decoupled head. Although DSC may lead to a decrease in accuracy, experiments verify that the detection performance is comparable to YOLOX with fewer parameters via reducing the number of channels and combining TGSR and HCNet modules.
Loss function optimization: The intersection-over-union (  ) loss calculation method used in YOLOX (Equation (8)) has two main issues: 1) it cannot reflect the overlapping degree between non-intersecting boxes; and 2) it cannot accurately measure the overlapping degree. The second issue may manifest in metal surface defect detection, where the model can generate differently-shaped prediction boxes for the same defect. Although prediction boxes overlap differently with the ground truth boxes,
  values are the same to prevent the model from generating more accurate prediction boxes. In particular, the shapes of prediction boxes significantly impact the regression performance for defects such as scratches and rolled pits that occupy a small area in the ground truth boxes.

Metal-YOLOX uses a loss calculation method with joint optimization of  and
and  .
.

where  is the deviation between prediction boxes
  and ground truth boxes
  ,
,  is the diagonal distance of the minimum closure region of
  and
and  , and
, and  considers the difference in the aspect ratio of
  and
and  .
.
Next,  introduces the coefficient
  to the regression loss, and the regression accuracy is adjusted by finding a suitable
  . When applied to
  , the regression loss is modified as Equation (10).

where each term of  is augmented by an exponent
  based on
  , and
, and  is given in the subsequent experiments.
3. Experiment
This section describes the datasets, performance evaluation, and implementation details of the relevant experiments.
3.1. Experimental Settings
3.1.1. Dataset
In our experiments, we use the NEU-DET [21], GC-10 [22], and Aluminum [23] datasets, as shown in Table 1. To meet the requirements of the model (for input image size) and satisfy the limit of GPU memory, the resolutions of the aforementioned datasets are adjusted to 224 × 224, 640 × 640, and 640 × 640, respectively. The datasets are divided into training, validation, and test sets according to a ratio of 8∶1∶1.
Table 1 Metal surface defects datasets.
| Dataset | Class | Number of samples | Resolution |
| NEU-DET | Crazing, rolled-in scale, inclusion, pitted surface, patches, scratches | 1800 | 200 × 200 |
| GC-10 | Punching hole, welding line, crescent gap, crease, oil spot, silk spot, inclusion, rolled pit, water spot, waist folding | 2280 | 2048 × 1000 |
| Aluminum | Non-conductive, scratch, orange peel, through-hole, splashing, paint bubbles, pitting, mottling, dirty spots | 3005 | 2560 × 1920 |
3.1.2. Performance Evaluation
The mAP is used to evaluate the Metal-YOLOX’s detection accuracy in the experiments. We use the number of parameters, floating point operations (FLOPs), and frames per second (FPS) as evaluation metrics to evaluate the detection efficiency. Parameters measure the spatial complexity of the model, while FLOPs reflect the computational complexity which indicates the model's time complexity. Few parameters and FLOPs are desirable for the same detection accuracy. FPS corresponds to the number of images inferred per second. The higher the number, the faster the inference speed.
3.1.3. Implementation Details
We set the batch sizes for NEU-DET, GC-10, and Aluminum datasets to 64, 16, and 16, respectively. The training epochs for Metal-YOLOX, Metal-YOLOX-s, and compared models are 150, and the SGD optimizer is used. In addition, the initial learning rate is 0.01, the minimum learning rate is 1e-4, and the momentum and weight decay factors are 0.937 and 5e-4, respectively.
3.2. Experimental Results and Analysis
3.2.1. Metal Surface Defect Detection
To verify the effectiveness of Metal-YOLOX and Metal-YOLOX-s, experiments are conducted to compare them with seven mainstream defect detection models on the NEU-DET, GC-10, and Aluminum datasets. The compared models include one-stage detection models represented by the SSD and YOLO series, and two-stage detection models represented by Faster R-CNN. No additional data augmentation methods are used in any of the models. As shown in Table 2, the results show the mAP achieved by all models.
Table 2 Detection results on the three datasets.
| Method | NEU-DET | GC-10 | Aluminum |
| SSD [17] | 71.96 | 60.83 | 72.56 |
| Faster R-CNN [18] | 76.21 | 65.21 | 75.86 |
| YOLOv3 [32] | 69.40 | 60.40 | 69.79 |
| YOLOv4 [27] | 63.27 | 54.28 | 65.84 |
| YOLOv5 [33] | 74.42 | 63.35 | 74.19 |
| YOLOX [34] | 75.18 | 63.89 | 73.06 |
| YOLOv7 [35] | 75.99 | 61.34 | 67.53 |
| Metal-YOLOX | 79.83 | 69.14 | 81.22 |
| Metal-YOLOX-s | 77.98 | 67.53 | 80.57 |
Table 2 displays that the Metal-YOLOX outperforms all the rest models with the highest mAP on all three datasets, followed by the lightweight Metal-YOLOX-s. This is because Metal-YOLOX-s uses the depthwise separable convolution to trade off between the detection speed and accuracy. Despite a slight decrease in accuracy, Metal-YOLOX-s outperforms the other seven models. Compared to the original YOLOX, for the three datasets, Metal-YOLOX achieves mAP improvements of 4.65, 5.25, and 8.16, while Metal-YOLOX-s achieves mAP improvements of 2.8, 3.64, and 7.51. YOLOv4 performs the worst, and one of the main reasons for such a bad result is that default-sized anchor boxes are used during training. Similar to YOLOv4, YOLOv7 does not achieve the expected results on the GC-10 and Aluminum datasets.
3.2.2. Metal Surface Defect Detection Efficiency
This experiment evaluates the detection efficiency of defect detection models by analyzing the evaluation metrics of GFLOPs, FPS and the number of parameters. All models are trained with default settings. YOLOv5, YOLOX, and YOLOv7 use the L-model. In terms of parameters, Metal-YOLOX includes a few parameters by reducing the number of channels in the model design. Metal-YOLOX-s further reduces parameters by using the depthwise separable convolution throughout the model. FLOPs represent the computational complexity of models, whilst Metal-YOLOX and Metal-YOLOX-s achieve the second-best and the best results, respectively. FPS tested on GPUs is provided in the fourth row of Table 3, and SSD achieves the speed of 54.92 FPS because VGG with a simple structure is used as the backbone network. Metal-YOLOX and Metal-YOLOX-s achieve a similar FPS to that of the YOLO series on GPUs. In addition, considering that many detection devices in industrial settings do not have GPUs, FPS tested on CPUs is provided in the fifth row of Table 3. Compared to parallel computing of GPUs, CPUs use serial computing, which leads to differences in FPS results. Metal-YOLOX-s achieves the fastest FPS on devices that only have one CPU. In conclusion, Metal-YOLOX and Metal-YOLOX-s achieve excellent results in the efficiency of metal surface defect detection, which verifies the effectiveness of the lightweight model design.
Table 3 Comparison of metal surface defect detection efficiency.
| Metrics | YOLOv3 | SSD | YOLOv4 | YOLOv5 | YOLOX | YOLOv7 | Metal-YOLOX | Metal-YOLOX-s |
| Parameters | 61.57M | 24.82M | 63.99M | 46.19M | 75.81M | 37.24M | 49.95M | 33.59M |
| FLOPs | 77.62G | 138.84G | 70.80G | 54.05G | 77.68G | 52.47G | 48.39G | 22.66G |
| FPS | 38.21 | 54.92 | 21.44 | 33.41 | 29.70 | 34.63 | 32.85 | 35.62 |
| FPS-C | 5.29 | 3.78 | 4.06 | 11.78 | 8.99 | 6.45 | 7.38 | 12.26 |
3.2.3. Ablation Studies
This experiment uses YOLOX as the baseline on the NEU-DET dataset and verifies the effects of TGSR, HCNet, and loss function optimization. As presented in Table 4, detection accuracy achieves mAP of 78.05 after using TGSR, which demonstrates the significant effect of feature extraction by TGSR. HCNet aims to achieve a feature fusion scheme to reduce the transmission of redundant feature information. Therefore, using HCNet alone has a limited effect on improving detection accuracy. Compared with the baseline, the loss function (jointly optimized by  and
and  ) has an mAP increase of 1.16. Finally, the complete Metal-YOLOX is compared with the baseline. The combination of HCNet and TGSR modules yields better results than others, and with the gain from the improved loss function, Metal-YOLOX achieves mAP of 79.83 which is 4.65 higher than the baseline.
Table 4 Results of Metal-YOLOX ablation studies based on mAP on NEU-DET dataset.
| Baseline | TGSR | HCNet |  |
mAP |
 |
75.18 | |||
 |
78.05 | |||
 |
75.62 | |||
 |
76.34 | |||
 |
 |
 |
79.83 |
3.2.4. Visualization Experiments
Visualization is an effective way to demonstrate the effectiveness of Metal-YOLOX. For the NEU-DET, GC-10, and Aluminum datasets, we use the Metal-YOLOX model to plot the heatmaps and prediction boxes. The heatmap Gradcam [36] uses the spatial representation information of categories to obtain the importance of regions in an image for defect detection, which shows the critical features for defect detection from the perspective of detection models.
Figure 5(a) shows the heatmaps and prediction boxes of the NEU-DET, where each column corresponds to each category of NEU-DET. The experimental results show that the highlighted areas in the heatmaps are mainly concentrated in the center of the defects, namely the central area of the ground truth box. Figure 5(b) describes the heatmaps and prediction boxes of GC-10. GC-10 has significant differences in defects for different classes, such as small point-like defects and defects that occupy the entire image. Metal-YOLOX can accurately detect the locations of different defects in the heatmaps, especially defects of small objects. For the detection of multi-object defect samples, Metal-YOLOX is also able to correctly identify the categories. Figure 5(c) illustrates the heatmaps and prediction boxes of Aluminum. Unlike the above two datasets, Aluminum contains interference from backgrounds, illuminations, colors and shapes of the samples. As shown in Figure 5(c), the area of some samples in the image is smaller than the background, which makes it difficult for human eyes to distinguish the location of defects. Metal-YOLOX can provide accurate prediction boxes. The defect samples contain aluminum materials of different colors and shapes. In particular, the original rolled lines in the aluminum are very similar to scratches. Metal-YOLOX distinguishes normal and defective areas effectively, reflecting its excellent robustness. In Appendix, we conduct additional experiments to demonstrate the superiority of Metal-YOLOX. The experiments include comparative experiments on loss function optimization and mAP line charts (Appendix A).

Figure 5. Visualization of defect detection on three datasets (a-c).
4. Conclusions
This paper has proposed a scheme for detecting defects on metal surfaces with limited computational resources. Compared with one-stage algorithms that pursue detection efficiency, our scheme has speed and accuracy advantages. TGSR in Metal-YOLOX effectively extracts semantic information of defect features by comprehensively utilizing texture, dilated, and deformable convolutions. HCNet reduces redundant information in the model and improves multi-scale defect detection efficiency via skip connections. Metal-YOLOX has been tested on the NEU-DET, GC-10, and Aluminum datasets. The experiments have verified that Metal-YOLOX achieves good results in the comparative experiments. In the future, we will attempt to combine semi-supervised learning with defect detection to alleviate effects from the imbalance of classes and the lack of annotated defect samples, thereby further enhancing the performance of metal surface defect detection.
Author Contributions: Xiaoli Yue: proposed the idea, designed the experiments and wrote the paper draft. Jiandong Chen: conducted the collection and analysis of experiment results and participated in writing the paper. Guoqiang Zhong: instructed the design of the scheme and revised the paper. All authors have read and agreed to the published version of the manuscript.
Funding: This work was partially supported by the National Key Research and Development Program of China under Grant No. 2018AAA0100400, HY Project under Grant No. LZY2022033004, the Natural Science Foundation of Shandong Province under Grants No. ZR2020MF131 and No. ZR2021ZD19, Project of the Marine Science and Technology cooperative Innovation Center under Grant No. 22-05-CXZX-04-03-17, the Science and Technology Program of Qingdao under Grant No. 21-1-4-ny-19-nsh, and Project of Associative Training of Ocean University of China under Grant No. 202265007. We also want to thank “Qingdao AI Computing Center” and “Eco-Innovation Center” for providing inclusive computing power and technical support of MindSpore during the completion of this paper.
Data Availability Statement: The NEU-DET-Dataset can be downloaded from: (https://universe.roboflow.com/park-sung-ho/neu-det-object-detection), the GC-10-Dataset can be downloaded from: (https://github.com/lvxiaoming2019/GC10-DET-Metallic-Surface-Defect-Datasets) and the Aluminum-Dataset can be downloaded from: (https://tianchi.aliyun.com/dataset/140666).
Conflicts of Interest: The authors declare no conflict of interest.
Appendix A
A.1. Loss Function Optimization Effect
On the NEU-DET dataset, we compare mAP of  ,
,  ,
,  ,
,  , and
, and  before and after
  IoU based on the YOLOX model, and the results are shown in Table A1. The lower right corner of each mAP value indicates the difference between the current loss function and the original IoU loss function, and the bold values indicate the best experimental results. The coefficient
  is set to 3. From Table A1, it can be observed that the loss function (jointly optimized by
  and
and  ) obtains the best experimental results, indicating that the proposed method of loss function optimization is applicable to metal surface defect detection.
Table A1 Experimental results of CIoU versus other loss on the NEU-DET dataset (%).
| Settings |  |
 |
 |
 |
 |
Before  |
75.18 |  |
 |
 |
 |
After  |
 |
 |
 |
 |
 |
A.2. mAP on NEU-DET, GC-10, and Aluminum Datasets
Figure A1 shows the trend of mAP with epochs for each model on the three datasets. In Figure A1(a–c), Metal-YOLOX and Metal-YOLOX-s are close to convergence after 60, 65 and 60 epochs, respectively. Compared to other models, the convergence speeds of Metal-YOLOX and Metal-YOLOX-s are faster. The lines are relatively smooth, which reflects that Metal-YOLOX and Metal-YOLOX-s are more stable during training.
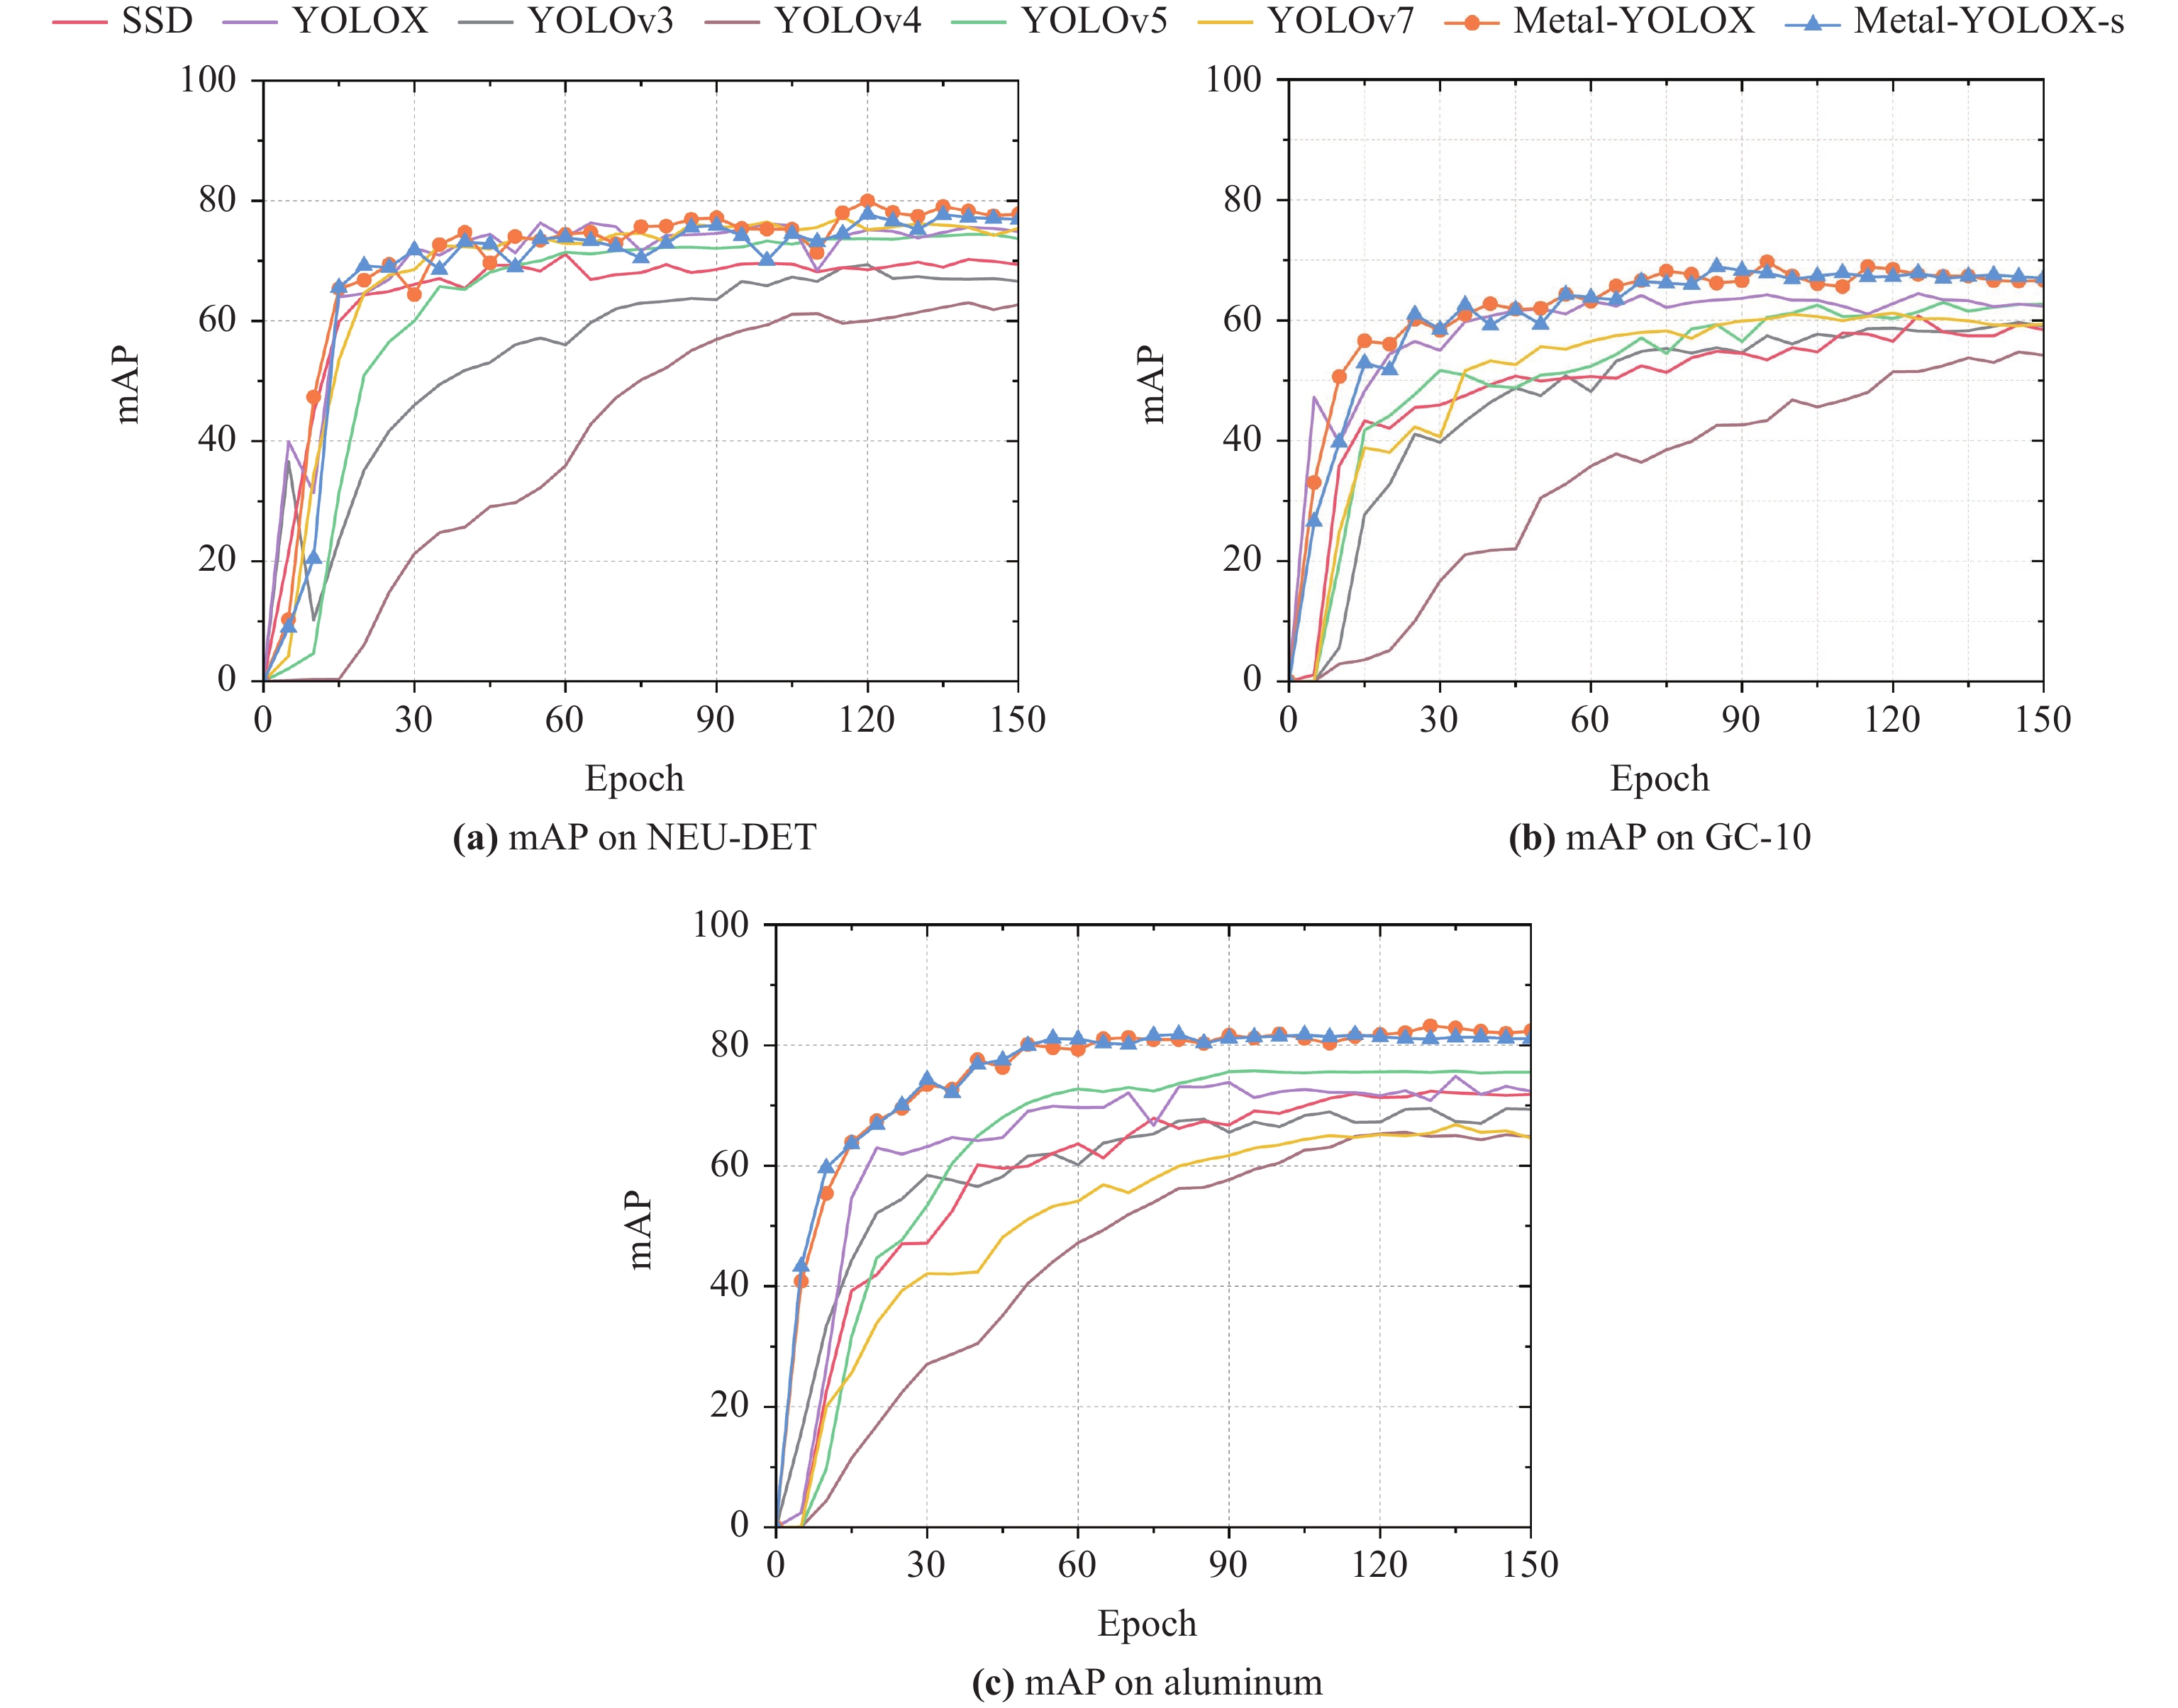
Figure A1. Metal surface defect detection mAP comparison.
References
- Nussbaumer, H.J. Fast Fourier Transform and Convolution Algorithms, 2nd ed.; Springer: Berlin, Heidelberg, 1982. doi: 10.1007/978-3-642-81897-4
- Honarkhah, M.; Caers, J. Stochastic simulation of patterns using distance-based pattern modeling. Math. Geosci., 2010, 42:487−517. doi: 10.1007/s11004-010-9276-7
- Prasitmeeboon, P.; Yau, H. Defect detection of particleboards by visual analysis and machine learning. In Proceedings of the 5th International Conference on Engineering, Applied Sciences and Technology (ICEAST), Luang Prabang, Laos, 2–5 July 2019; IEEE: New York, 2019; pp. 1–4. doi: 10.1109/ICEAST.2019.8802526
- Li, J.H.; Quan, X.X.; Wang, Y.L. Research on defect detection algorithm of ceramic tile surface with multi-feature fusion. Comput. Eng. Appl., 2020, 56: 191−198. doi: 10.3778/j.issn.1002-8331.1907-0130
- Persoon, E.; Fu, K.S. Shape discrimination using Fourier descriptors. IEEE Trans. Pattern Anal. Mach. Intell. 1986, PAMI-8, 388–397. doi: 10.1109/TPAMI.1986.4767799
- Nieniewski, M. Morphological detection and extraction of rail surface defects. IEEE Trans. Instrum. Meas., 2020, 69: 6870−6879. doi: 10.1109/TIM.2020.2975454
- Chen, Y.J.; Ding, Y.Y.; Zhao, F.; et al. Surface defect detection methods for industrial products: A review. Appl. Sci., 2021, 11: 7657. doi: 10.3390/app11167657
- Wang, C.; Wang, Z.D.; Ma, L.F.; et al. Subdomain-alignment data augmentation for pipeline fault diagnosis: An adversarial self-attention network. IEEE Trans. Ind. Inform. 2023, in press. doi: 10.1109/TII.2023.3275701
- Wang, C.; Wang, Z.D.; Ma, L.F.; et al. A novel contrastive adversarial network for minor-class data augmentation: Applications to pipeline fault diagnosis. Knowl.-Based Syst., 2023, 271: 110516. doi: 10.1016/j.knosys.2023.110516
- Ni, H.X.; Wang, M.Z.; Zhao, L.Y. An improved faster R-CNN for defect recognition of key components of transmission line. Math. Biosci. Eng., 2021, 18: 4679−4695. doi: 10.3934/mbe.2021237
- Ding, R.W.; Dai, L.H.; Li, G.P.; et al. TDD-net: a tiny defect detection network for printed circuit boards. CAAI Trans. Intell. Tech-nol., 2019, 4: 110−116. doi: 10.1049/trit.2019.0019
- Tang, J.H.; Mao, Y.C.; Wang, J.; et al. Multi-task enhanced dam crack image detection based on faster R-CNN. In Proceedings of the 4th International Conference on Image, Vision and Computing (ICIVC), Xiamen, China, 5–7 July 2019; IEEE: New York, 2019; pp. 336–340. doi: 10.1109/ICIVC47709.2019.8981093
- Liu, Z.G.; Liu, K.; Zhong, J.P.; et al. A high-precision positioning approach for catenary support components with multiscale difference. IEEE Trans. Instrum. Meas., 2020, 69: 700−711. doi: 10.1109/TIM.2019.2905905
- Alzubaidi, L.; Zhang, J.L.; Humaidi, A.J.; et al. Review of deep learning: Concepts, CNN architectures, challenges, applications, future directions. J. Big Data, 2021, 8: 53. doi: 10.1186/s40537-021-00444-8
- Redmon, J.; Divvala, S.; Girshick, R.; et al. You only look once: Unified, real-time object detection. In Proceedings of 2016 IEEE Conference on Computer Vision and Pattern Recognition (CVPR), Las Vegas, NV, USA, 27–30 June 2016; IEEE: New York, 2016; pp. 779–788. doi: 10.1109/CVPR.2016.91
- Lin, T.Y.; Goyal, P.; Girshick, R.; et al. Focal loss for dense object detection. In Proceedings of 2017 IEEE International Conference on Computer Vision (ICCV), Venice, Italy, 22–29 October 2017; IEEE: New York, 2017; pp. 2999–3007. doi: 10.1109/ICCV.2017.324
- Liu, W.; Anguelov, D.; Erhan, D.; et al. SSD: Single shot MultiBox detector. In Proceedings of the 14th European Conference on Computer Vision, Amsterdam, The Netherlands, 11–14 October 2016; Springer: Berlin/Heidelberg, Germany, 2016; pp. 21–37. doi: 10.1007/978-3-319-46448-0_2
- Ren, S.Q; He, K.M; Girshick, R.; et al. Faster R-CNN: Towards real-time object detection with region proposal networks. IEEE Trans. Pattern Anal. Mach. Intell., 2017, 39: 1137−1149. doi: 10.1109/TPAMI.2016.2577031
- Wang, T.; Su, J.H.; Xu, C.; et al. An intelligent method for detecting surface defects in aluminium profiles based on the improved YOLOv5 algorithm. Electronics, 2022, 11: 2304. doi: 10.3390/electronics11152304
- Wang, Q.L.; Wu, B.G.; Zhu, P.F.; et al. ECA-net: Efficient channel attention for deep convolutional neural networks. In Proceedings of 2020 IEEE/CVF Conference on Computer Vision and Pattern Recognition (CVPR), Seattle, WA, USA, 13–19 June 2020; IEEE: New York, 2020; pp. 11531–11539. doi: 10.1109/CVPR42600.2020.01155
- Song, K.C.; Yan, Y.H. A noise robust method based on completed local binary patterns for hot-rolled steel strip surface defects. Appl. Surf. Sci., 2013, 285: 858−864. doi: 10.1016/j.apsusc.2013.09.002
- Lv, X.M.; Duan, F.J.; Jiang, J.J.; et al. Deep metallic surface defect detection: The new benchmark and detection network. Sensors, 2020, 20: 1562. doi: 10.3390/s20061562
- Dataset for Identifying Surface Defects in Aluminium Profiles. Available online: https://tianchi.aliyun.com/dataset/140666 (accessed on 17 September 2018). (In Chinese).
- Song, G.L.; Liu, Y.; Wang, X.G. Revisiting the sibling head in object detector. In Proceedings of 2020 IEEE/CVF Conference on Computer Vision and Pattern Recognition (CVPR), Seattle, WA, USA, 13–19 June 2020; IEEE: New York, 2020; pp. 11560–11569. doi: 10.1109/CVPR42600.2020.01158
- Wu, Y.; Chen, Y.P.; Yuan, L.; et al. Rethinking classification and localization for object detection. In Proceedings of 2020 IEEE/CVF Conference on Computer Vision and Pattern Recognition (CVPR), Seattle, WA, USA, 13–19 June 2020; IEEE: New York, 2020; pp. 10183–10192. doi: 10.1109/CVPR42600.2020.01020
- Liu, S.; Qi, L.; Qin, H.F.; et al. Path aggregation network for instance segmentation. In Proceedings of 2018 IEEE/CVF Conference on Computer Vision and Pattern Recognition, Salt Lake City, UT, USA, 18–23 June 2018; IEEE: New York, 2018; pp. 8759–8768. doi: 10.1109/CVPR.2018.00913
- Bochkovskiy, A.; Wang, C.Y.; Liao, H.Y.M. YOLOv4: Optimal speed and accuracy of object detection. arXiv preprint arXiv:2004.10934, 2020.
- Yu, F.; Koltun, V.; Funkhouser, T. Dilated residual networks. In Proceedings of 2017 IEEE Conference on Computer Vision and Pattern Recognition (CVPR), Honolulu, HI, USA, 21–26 July 2017; IEEE: New York, 2017; pp. 636–644. doi: 10.1109/CVPR.2017.75
- Dai, J.F.; Qi, H.Z.; Xiong, Y.W.; et al. Deformable convolutional networks. In Proceedings of 2017 IEEE International Conference on Computer Vision (ICCV), Venice, Italy, 22–29 October 2017; IEEE: New York, 2017; pp. 764–773. doi: 10.1109/ICCV.2017.89
- Tan, M.X.; Pang, R.M.; Le, Q.V. EfficientDet: Scalable and efficient object detection. In Proceedings of 2020 IEEE/CVF Conference on Computer Vision and Pattern Recognition (CVPR), Seattle, WA, USA, 13–19 June 2020; IEEE: New York, 2020; pp.10778–10787. doi: 10.1109/CVPR42600.2020.01079
- Sifre, L.; Mallat, S. Rigid-motion scattering for texture classification. arXiv preprint arXiv: 1403.1687, 2014.
- Redmon, J.; Farhadi, A. YOLOv3: An incremental improvement. In Proceedings of the IEEE Conference on Computer Vision and Pattern Recognition, 2018.
- Jocher, G.; Stoken, A.; Borovec, J.; et al. Ultralytics/yolov5: v3.0 (Version v3.0). Zenodo, 2020.
- Ge, Z.; Liu, S.T.; Wang, F.; et al. YOLOX: Exceeding YOLO series in 2021. arXiv preprint arXiv: 2107.08430, 2021.
- Wang, C.Y.; Bochkovskiy, A.; Liao, H.Y.M. YOLOv7: Trainable bag-of-freebies sets new state-of-the-art for real-time object detectors. In Proceedings of 2023 IEEE/CVF Conference on Computer Vision and Pattern Recognition (CVPR), Vancouver, Canada, 17–24 June 2023; IEEE: Vancouver, Canada, 2023; pp. 7464–7475. doi: 10.1109/CVPR52729.2023.00721
- Selvaraju, R.R.; Cogswell, M.; Das, A.; et al. Grad-CAM: Visual explanations from deep networks via gradient-based localization. Int. J Comput. Vis., 2020, 128: 336−359. doi: 10.1007/s11263-019-01228-7