

Downloads
Download


This work is licensed under a Creative Commons Attribution 4.0 International License.
Article
Modeling and Causality Analysis of Human Sensorimotor Control System Based on NVAR Method
Jiyu Tan 1,2, Yurong Li 1,2,*, Qiurong Xie 3, and Xiaoling Wang 3
1 College of Electrical Engineering and Automation, Fuzhou University, Fuzhou 350108, China
2 Fujian Key Lab of Medical Instrument and Pharmaceutical Technology, Fuzhou University, Fuzhou 350116, China
3 College of Rehabilitation Medicine, Fujian University of Traditional Chinese Medicine, Fuzhou 350122, China
* Correspondence: liyurong@fzu.edu.cn
Received: 2 September 2023
Accepted: 19 October 2023
Published: 21 December 2023
Abstract: Neuromuscular disorders (such as stroke and spinal cord injuries) can lead to nerve damage that profoundly affects a patient's ability to control limb movements. Analyzing and modeling the human sensorimotor control system can establish a neurophysiological foundation for both fundamental research and clinical rehabilitation assessment. Electroencephalogram (EEG) signals provide insights into how the cerebral cortex regulates limb movements, while electromyogram (EMG) signals reveal how muscles respond to motor commands. Utilizing these signals, cortical-muscular models can be developed to facilitate the quantification and assessment of the human sensorimotor control system. This study proposes a method based on the nonlinear vector autoregression model and coiflets wavelet packet decomposition to perform multivariate time-frequency Granger causality analysis. The objective of this analysis is to compute the cortical-muscular causality matrix during elbow extension in stroke patients and construct a cortical-muscular causal network. The result reveals a frequency-dependent directed information flow pattern in the cortical-muscle causality matrix during elbow extension. Specifically, the GC values of EEG→EMG (down) and EMG→EEG (up) in the alpha and beta bands are significantly higher than those in the gamma band. The cortical-muscular causal network of stroke patients does not have small-world properties. The result indicates that the proposed method is able to characterize functional connections of brain myoelectric synchronization in different frequency bands within the time-frequency domain. It also uncovers the causal association that inherently exists in the human sensorimotor control system, providing a theoretical basis for further evaluation and quantification of the human sensorimotor control system.
Keywords:
nonlinear modeling cortical-muscular network electroencephalogram electromyogram signal1. Introduction
In recent years, there has been a noticeable increase in the incidence and prevalence of paralysis caused by neuromuscular diseases such as stroke and spinal cord injury [1]. Individuals with neuromuscular diseases experience varying degrees of nerve damage, leading to the inability to properly transmit motor nerve signals and resulting in sensory and motor dysfunctions in the limbs [2]. Upper limb movements, particularly the functionality of the elbow joint, play a crucial role in daily human activities and work. The elbow’s movement function serves as the foundation for performing a wide range of complex tasks. Nevertheless, nerve injuries usually lead to elbow joint motor dysfunctions, which restricts the upper limb motor function. [3]. Currently, a significant challenge in the field of movement function rehabilitation is the lack of clarity regarding the sensorimotor control mechanisms that govern limb movements.
During normal movements, the motor cortex in the cerebral region generates neural signals. Such signals are then relayed through the spinal cord's motor nerve pathway to reach the muscle motor nerve endings, thereby controlling muscle contraction and power generation. Simultaneously, proprioceptive signals arising from muscle contractions and extremity motions are processed and synthesized along neural pathways, eventually reaching the cortex. This integration enables the generation of decision-making instructions and ensures precise execution of the movement [4]. The Electroencephalogram (EEG) signal of the cerebral cortex represents the overall mapping of the electrical activities of neurons in the cerebral cortex, reflecting the control information of the cerebral cortex for limb movement. Surface electromyography (EMG) signals from the muscles engage in movements resulting from the overlapping action potentials of multiple muscle fibers that occur in both temporal and spatial dimensions. Therefore, corticomuscular interactions can be quantified by a corticomuscular model based on EEG and EMG signals.
Neural oscillation serves as a means of transmitting motor control information whose synchronized rhythmic activity influences movement units. This synchronized oscillatory behavior represents the connection between the cerebral cortex and muscles, commonly referred to as the corticomuscular coupling (CMC) connection [5]. The study of CMC is helpful in exploring the transmission mode of information in human sensorimotor control systems, for better understanding the essential mechanism of body movements [6].
Many researchers have investigated the correlation between EEG-EMG coherence and motor patterns [7, 8]. These studies have analyzed variations and synchronized rhythmic in scalp EEG and EMG signals during the performance of body movements. Zhang et al. have confirmed that in upper limb movements, the static grip strength output is primarily associated with corticomuscular coupling in the high-frequency band, with greater EEG-to-EMG coupling intensity compared to the reverse direction. Witte et al. have discovered an increase in the synchronous oscillation frequency during the generation of moderate and sustained hand force [9]. Other studies have suggested that CMC in the gamma band has a connection with the attention of subjects during performing tasks, and the enhancement of task attention can promote the activity of neurons in the gamma band [10].
Existing studies have the following problems. 1) Linear models are restricted to the handling of linear systems, whereas human sensorimotor control systems are nonlinear. Relying solely on a linear model (to describe a nonlinear system) may result in the fact that the model has poor predictive abilities and cannot accurately capture nonlinear dynamic characteristics. 2) Studies on the characteristics of cortical muscle synchronization during elbow movements mostly use the single-input-single-output model, while the human sensorimotor control system is a sophisticated network composed of the cortex and various muscle groups. All movements require the synergy of multiple cortical regions and multiple muscle groups.
To address the aforementioned issues, this study focuses on EEG-EMG signals and proposes a multivariate causality analysis method based on the nonlinear vector autoregressive (NVAR) model. Based on this multiple causality analysis method, the cortical-muscular causal network is established to study the information transmission of the human sensorimotor control system from the perspective of complex networks, which enables a more comprehensive depiction of the causal relationships intrinsic to the human sensorimotor control system and provides a better understanding mechanism of the cortical muscle coordination and control during movements.
2. Method
2.1. Data
Damage to nerve pathways often leads to common upper limb movement dysfunctions. In clinical rehabilitation assessment, the restoration of elbow joint movements is of significant importance. The cortical-muscle model is formulated by concurrently modeling EEG and EMG signals captured during elbow movements, and the causal relationship between the cortical-muscle is analyzed to provide a foundation for investigating the sensorimotor control mechanism of the elbow and clinical rehabilitation assessment indexes.
The data for this study is produced by selecting 30 stroke patients with upper limb movement disorders, and all patients have experienced strokes caused by cerebral infarction. The participants have been informed about the study, and signed the informed consent form. Meanwhile, the study received the approval from the Ethics Committee of the Rehabilitation Hospital Affiliated to Fujian University of Chinese Medicine under approval number 2021KY-005-02, in accordance with the principles outlined in the Declaration of Helsinki.
In this research, cortical responses during upper limb movements are recorded using a configuration based on the international electrode placement system (known as the 10–20 system). This setup employs a total of 64 EEG electrodes, and uses EMG acquisition equipment to simultaneously record signals at 1500 Hz. In this dataset, we focus on the action data related to forward movements of the elbow joint. When the experiment starts, the patient takes a 1 s break. After the rest period, a red circle appears on the screen to signal that the patient is about to begin the exercise. Then, the screen displays a forward motion picture, and the patient begins to reach from point A to point B for 3 s. After returning to point A, the screen is pure black, indicating that the patient should relax for 3 s. The task is repeated 10 times. Figure 1 provides a visual representation of the experimental process.
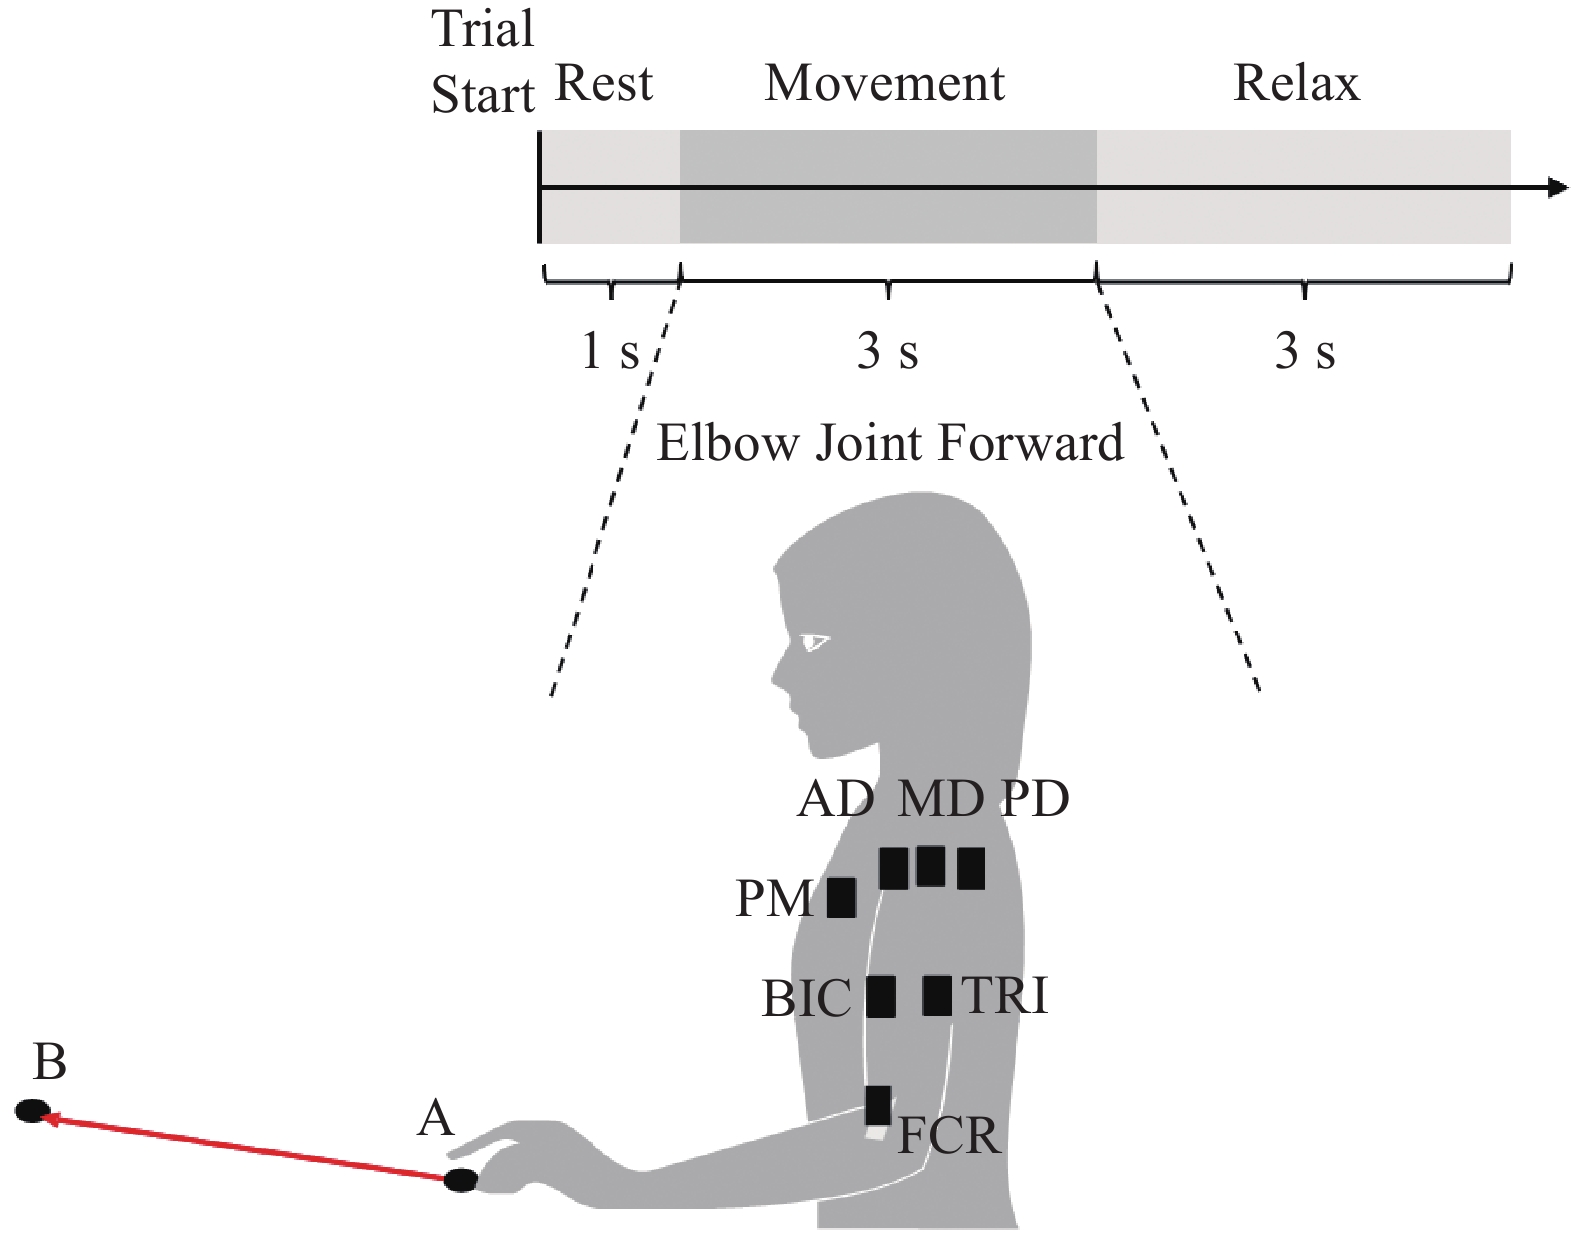
Figure 1. Experimental procedure diagram.
This paper mainly studies the causal relationship between multi-cortical EEG and multi-muscle activities based on the NVAR model. To achieve this, we select data related to elbow extension from 30 subjects, with 5 trials chosen for each dataset. The relevant event segment is selected from 0.5 s before to 3 s after the start of the action. In each data, we select 14 EEG signal channels and 7 EMG signal channels, among which the EEG channels include: AF3, AF4, F3, F4, FC3, FC4, C3, C4, CP3, CP4, P3, P4, PO3 and PO4, as shown in Figure 2 (a). The choice of these EEG channels enables a comprehensive evaluation of the motor cortex, while minimizing signal interference among EEG channels. EMG channels include: Pectoralis Major (PM), Anterior Deltoids (AD), Middle Deltoids (MD), Posterior Deltoids (PD), Biceps (BIC), Triceps (TRI), and Flexor carpi radialis (FCR), as shown in Figure 2 (b).
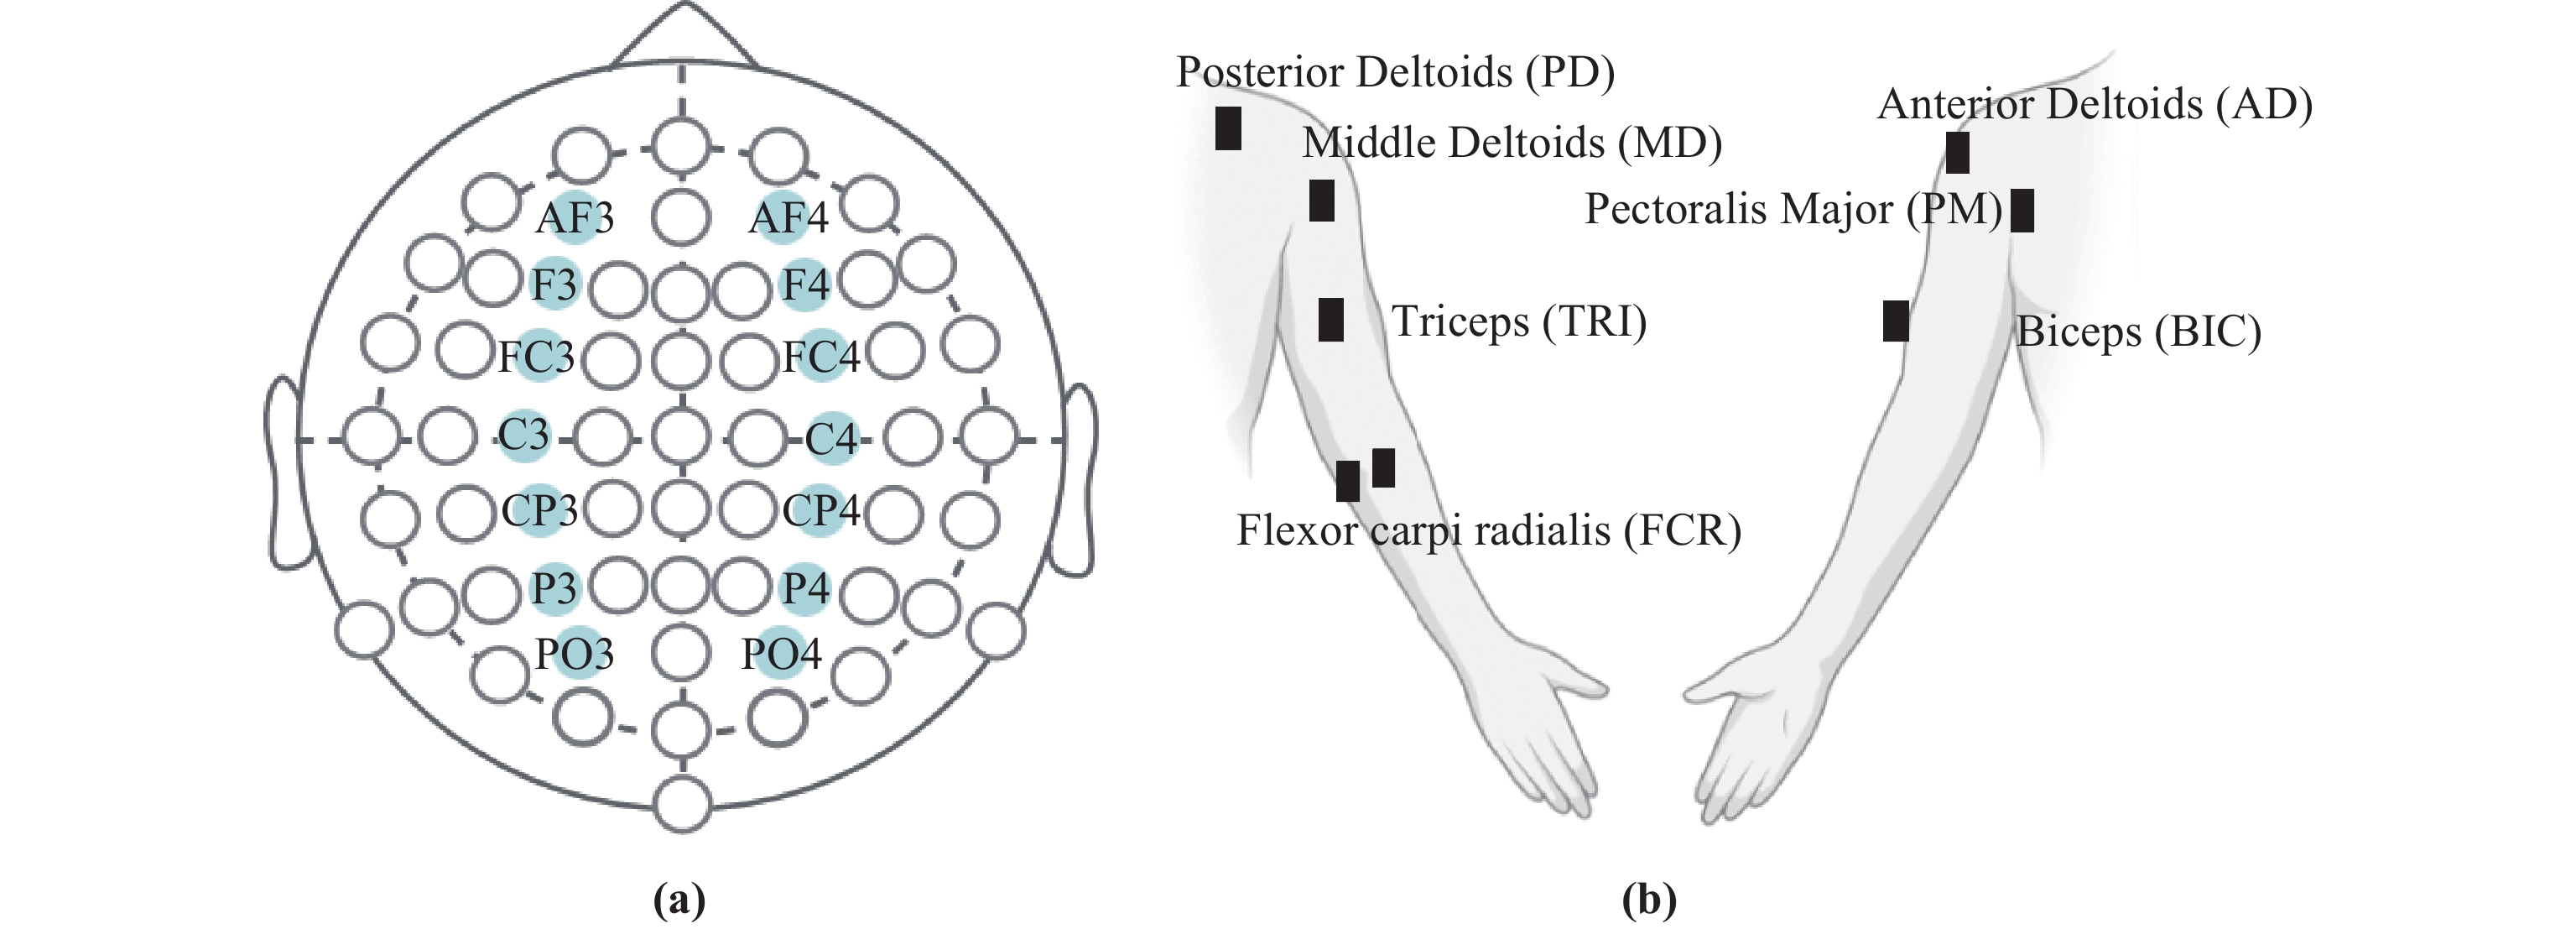
Figure 2. Channel selection: (a) EEG channel; (b) EMG channels.
2.2. Data Preprocessing
During human sensorimotor control, the brain simultaneously engages in neural activities necessary to maintain wakefulness. Consequently, the underlying EEG signal associated with this wakefulness maintenance becomes entangled with the EEG signal generated by sensorimotor control. Moreover, the body movement in human motion control can introduce noise interference into EEG signals, further reducing the signal-to-noise ratio of useful signals. The EMG signal is also susceptible to noises, including the power frequency interference and baseline drift. Therefore, it is essential to preprocess EEG-EMG signals and extract information related to sensory control within EEG-EMG before performing nonlinear modeling and causality analysis of the human sensorimotor control system. Consequently, we are able to separate this information from other background noises and the noise interference generated by motion. The EEG-EMG signal synchronous pretreatment process is shown in Figure 3.
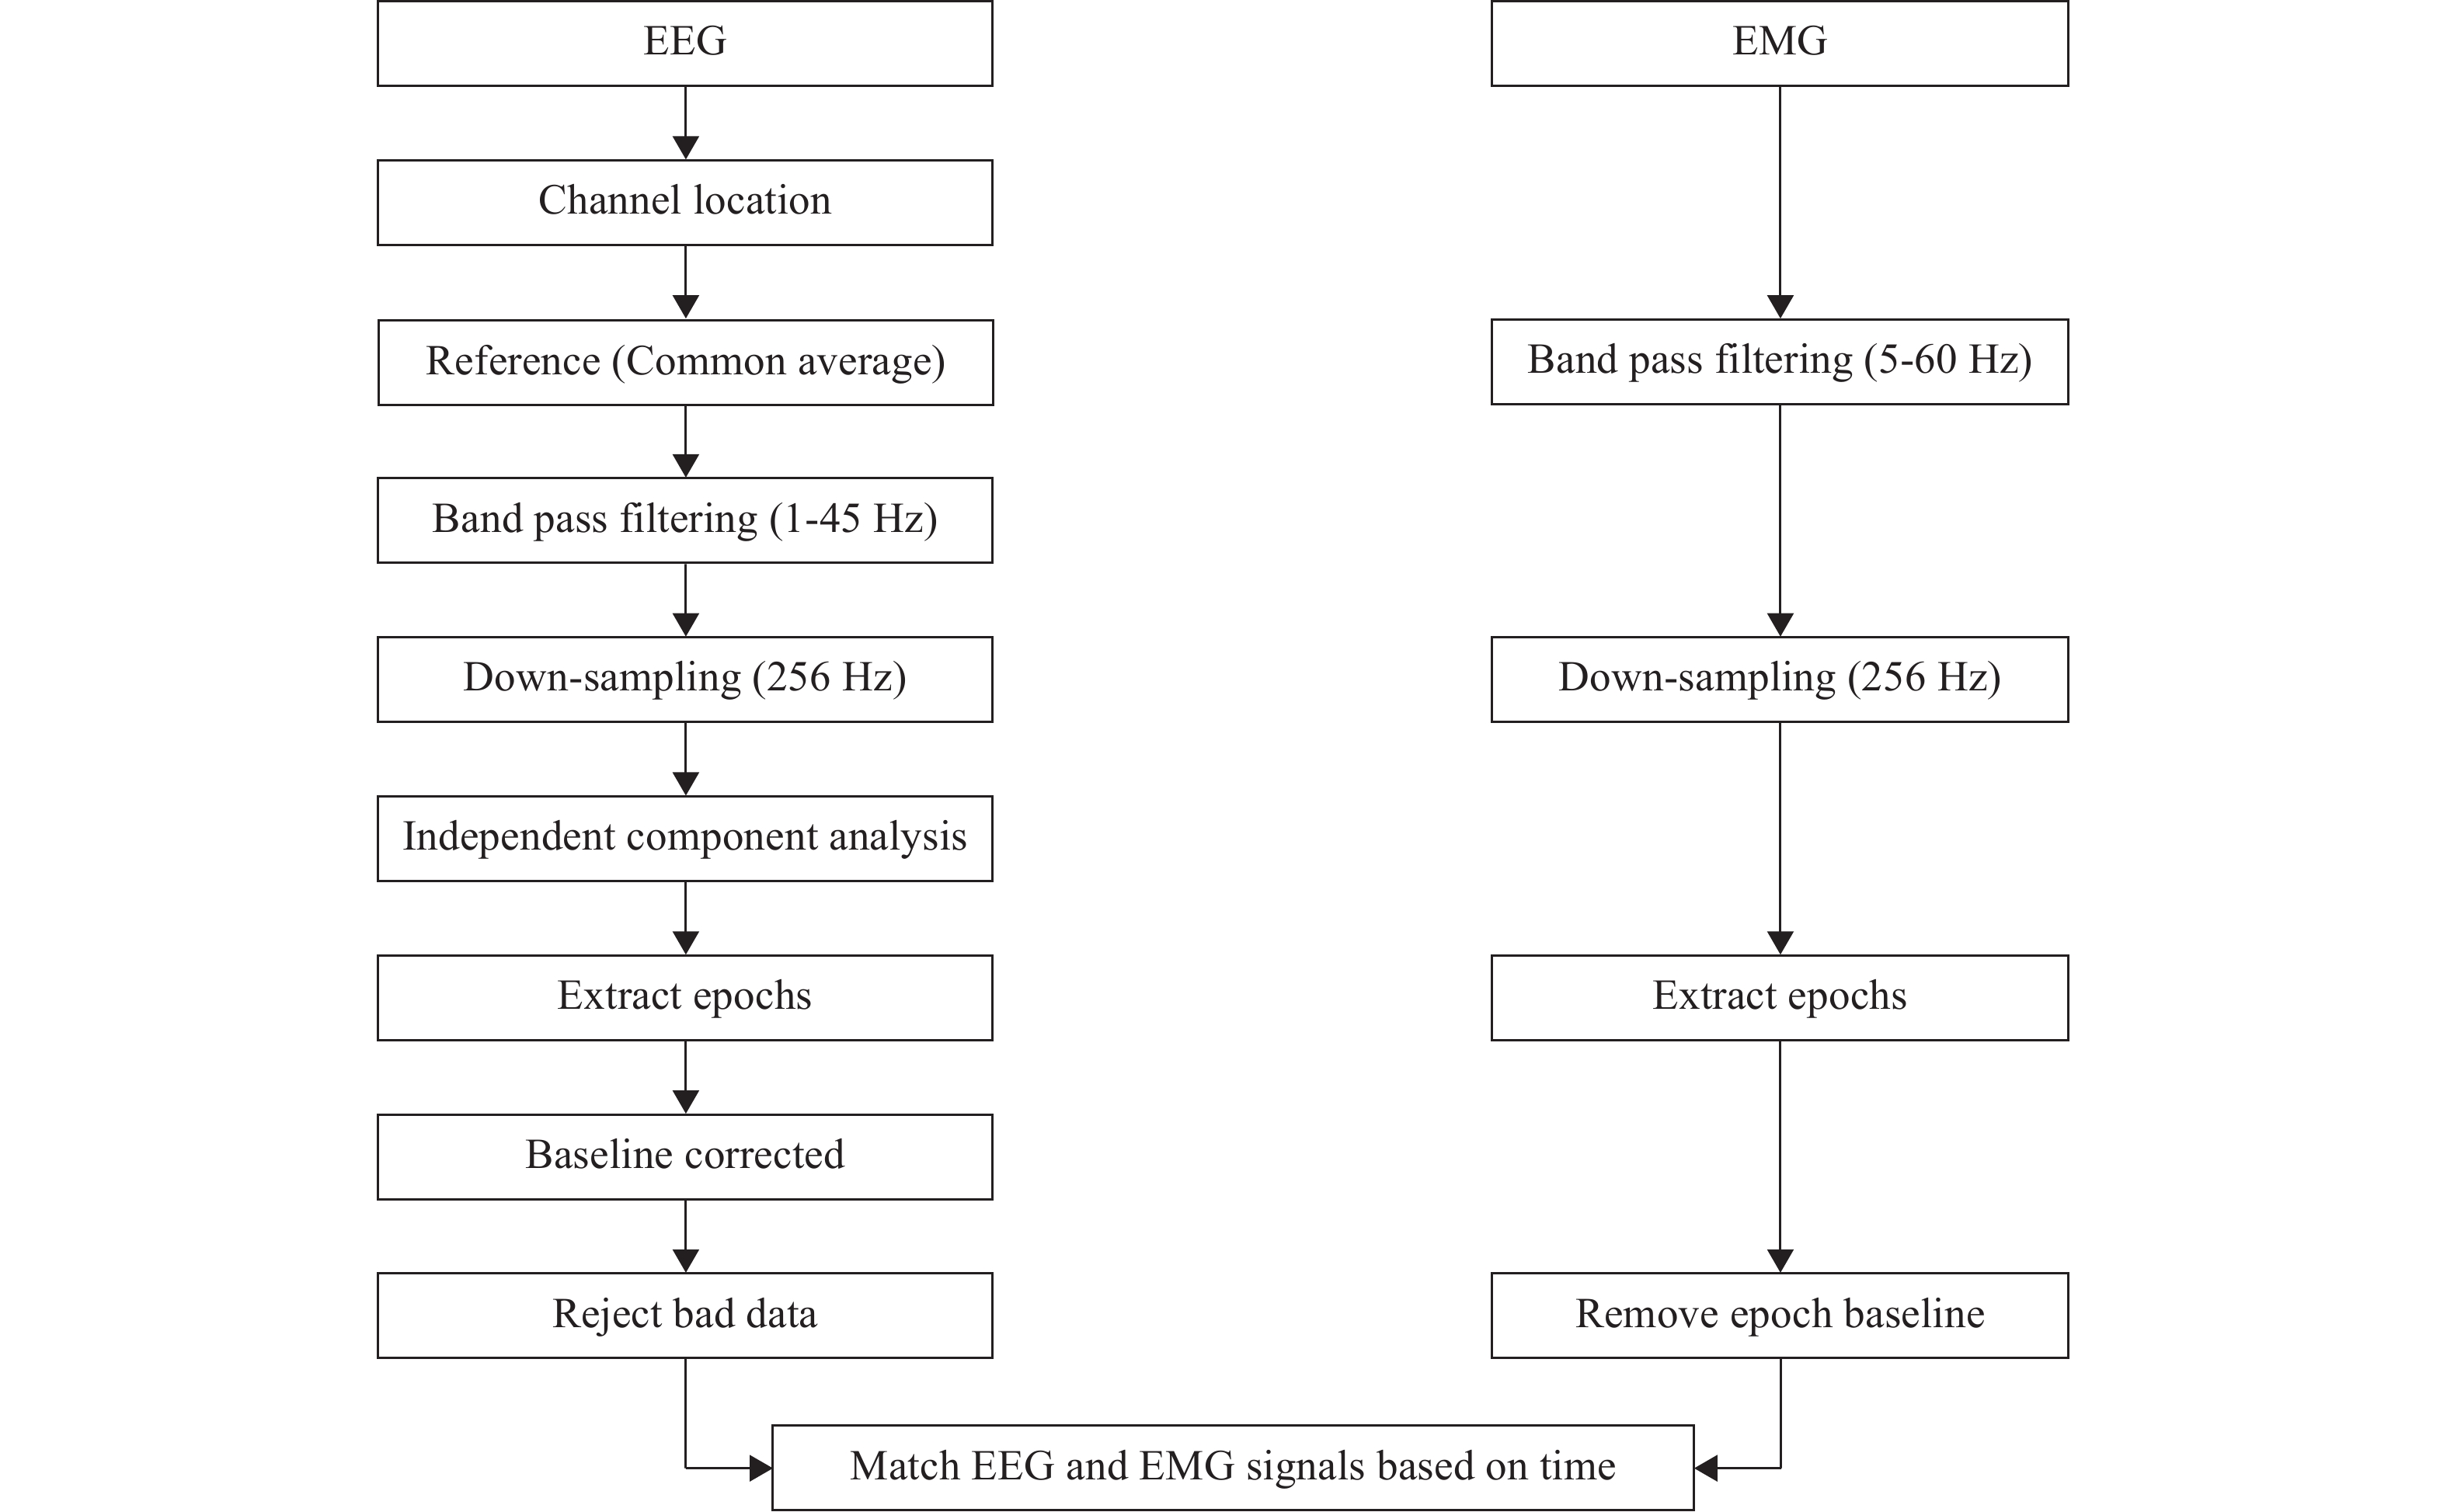
Figure 3. Electroencephalogram (EEG) and electromyograph (EMG) preprocessing process.
The EEG preprocessing process includes: the channel location; common average referenced; 1–45 Hz bandpass filtering (a fourth-order bandpass Butterworth filter); down sampling to 256 Hz; applying the independent component analysis (ICA) to separate and remove noise sources; extracting related event segments for segmentation; correcting baselines; and rejecting bad data.
The EMG preprocessing process includes: 5–60 Hz bandpass filtering (a fourth order bandpass Butterworth filter); down sampling to 256 Hz; extracting related event segments for segmentation; and correcting baselines.
2.3. Wavelet Packet Decomposition
The synchronization of oscillations between the cortical region and muscles signifies unique functional coupling connections with various time intervals across different frequency ranges. Therefore, rather than focus solely on the time domain or frequency alone, it is more practical to explore variations of EEG as well as EMG signals within the time-frequency realm. It is necessary to perform band decomposition of the EEG and EMG signals, and then analyze the changes in EEG and EMG signals over time within distinct frequency ranges. For the signals of EEG and EMG, wavelet transform is a useful feature extraction method that can offer information from both the time and frequency domains. Nevertheless, it's important to note that wavelet transform exclusively dissects the signal’s low-frequency portion and doesn't extend this decomposition into the high-frequency portion, known as the detailed part of the signal. Due to this limitation, the high-frequency range has diminished the frequency resolution and the low-frequency segment has reduced the time resolution. To address this issue, we employ wavelet packet decomposition as a solution to extract time-frequency features from EEG and EMG signals.
Wavelet packet decomposition is an expansion of the wavelet transform, which has proven to be highly efficient in decomposing the high-frequency component of a signal without further subdividing the signal. This method is adapted by selecting appropriate frequency bands based on the characteristics of the analyzed signal, thereby enhancing the overall time-frequency resolution [11]. In Figure 4, a binomial tree structure is derived from the wavelet packet decomposition. Each node is represented as (i, j), where the j-th node in the binomial tree represents layer i, and each layer has 2i nodes [12].
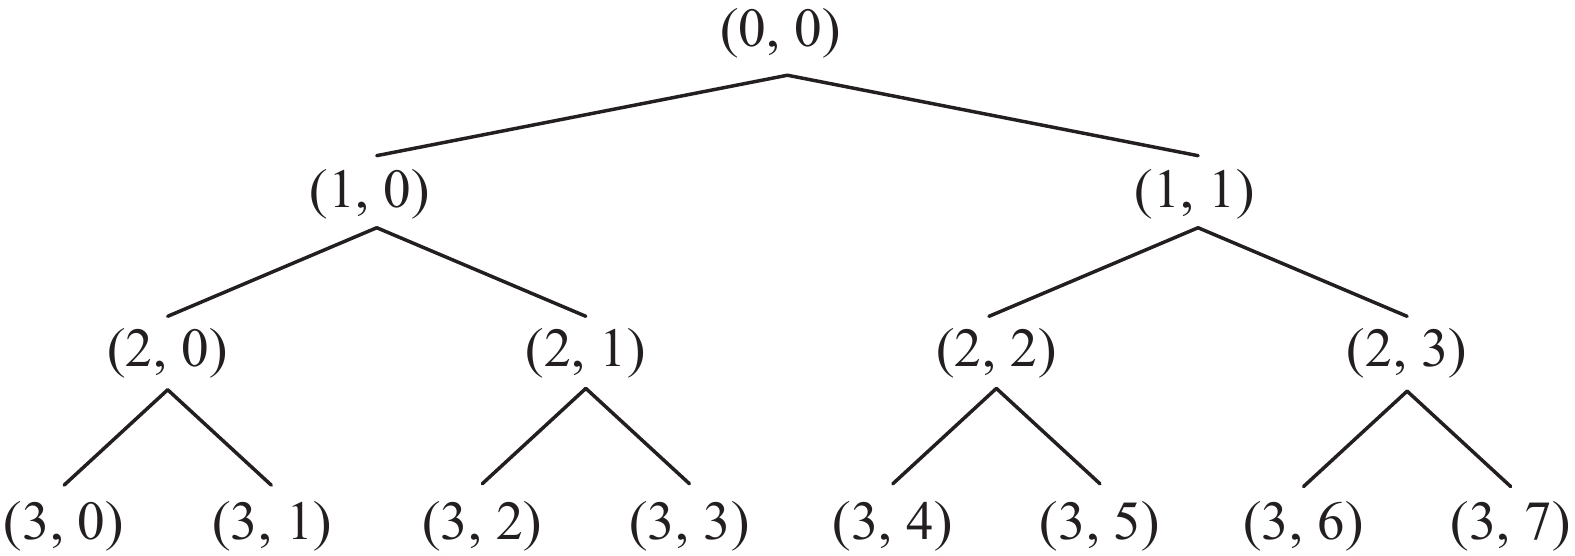
Figure 4. Decomposition of wavelet packets on three layers.
By employing N-layer wavelet packet decomposition, the original signal can be partitioned into 2N bands, with each band having a frequency resolution of fs/(2N+1) Hz. The frequency range for the n-th node in the N-th layer is  , and fs is the sampling frequency.
2.4. Granger Causality (GC)
The crux of the Granger causality (GC) definition lies in discerning the impact of the past occurrences of one signal on the predictive ability of another signal. Supports X and Y are two timing signals. To ascertain the Granger causality from X to Y, it is imperative to construct a pre-existing model that characterizes the output Y using past information Y−, which is denoted as:  . A model that describes output Y, past information
  , input X and past information X− is denoted as
 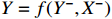 . We could estimate the parameters
  from the data sampled in the signals, and then generate the predictions of Y based on
  only or based on both
  and
and  . In both scenarios, the model prediction error variances, denoted as
  and
and  , serve as indicators of prediction accuracy. Then the Granger causality from X to Y can be defined as follows:

The same is true to the causality from Y to X . Obviously, this method is capable of calculating bi-directional causality and, if the model is chosen properly, can be applied not only to linearity but also nonlinearity.
2.5. NVAR
The human sensorimotor control system necessitates the harmonious coordination of multiple muscles, directed by several brain regions, to perform motor tasks successfully. Consequently, relying on single-input and single-output models for causality analysis falls short when trying to understand the intricate network of internal causality within this system [13]. To comprehensively dissect this complex internal causality, a multivariate model-based causality analysis method becomes imperative. At present, the vector autoregressive (VAR) is the most commonly used multivariate time series modeling method, which can describe the interdependence between multiple variables. In the VAR model, the value of each variable depends on the values of all variables at previous time points [14]:

where  is the p-dimensional variable at time t,
  is the coefficient matrix to be estimated, K is the lag order,
  is the p-dimensional noise vector, and T is the number of samples. Compared with univariate autoregression, VAR model can capture rich dynamics in multiple time series, but the following problems exist in the application of nonlinear systems.
1) Assuming a linear relationship. The VAR model assumes a linear relationship between time series variables. However, in a nonlinear system, the relationship between variables may be nonlinear, which can lead to the failure of the VAR model in capturing the true dynamics of the nonlinear system [15].
2) Model complexity. When the degree of system nonlinearity is high, the complexity of the VAR model may become quite substantial. This requires more regression terms and parameters to describe the system's dynamics [16], resulting in model overfitting and increased computational complexity [17].
Considering the challenges existing in the application of the VAR model in nonlinear systems, we extend the VAR model to the nonlinear case, which is defined as the nonlinear vector autoregressive (NVAR) model [18, 19], as shown in formula (3). Different from the linear VAR model, the NVAR model assumes a nonlinear relationships between variables and can capture complex dynamic relationships between system variables more accurately.

where  is the nonlinear coefficient matrix to be estimated, and
  is the p-dimensional input variable. The flowchart of NVAR model implementation is shown in Figure 5, which uses the K multilayer perception (MLP) method to train the nonlinear coefficient matrix
  , and the structure of each MLP is designed with p input units and p2 output units [20]. Then, the output units with dimension p2 are changed into a p×p dimensional matrix.
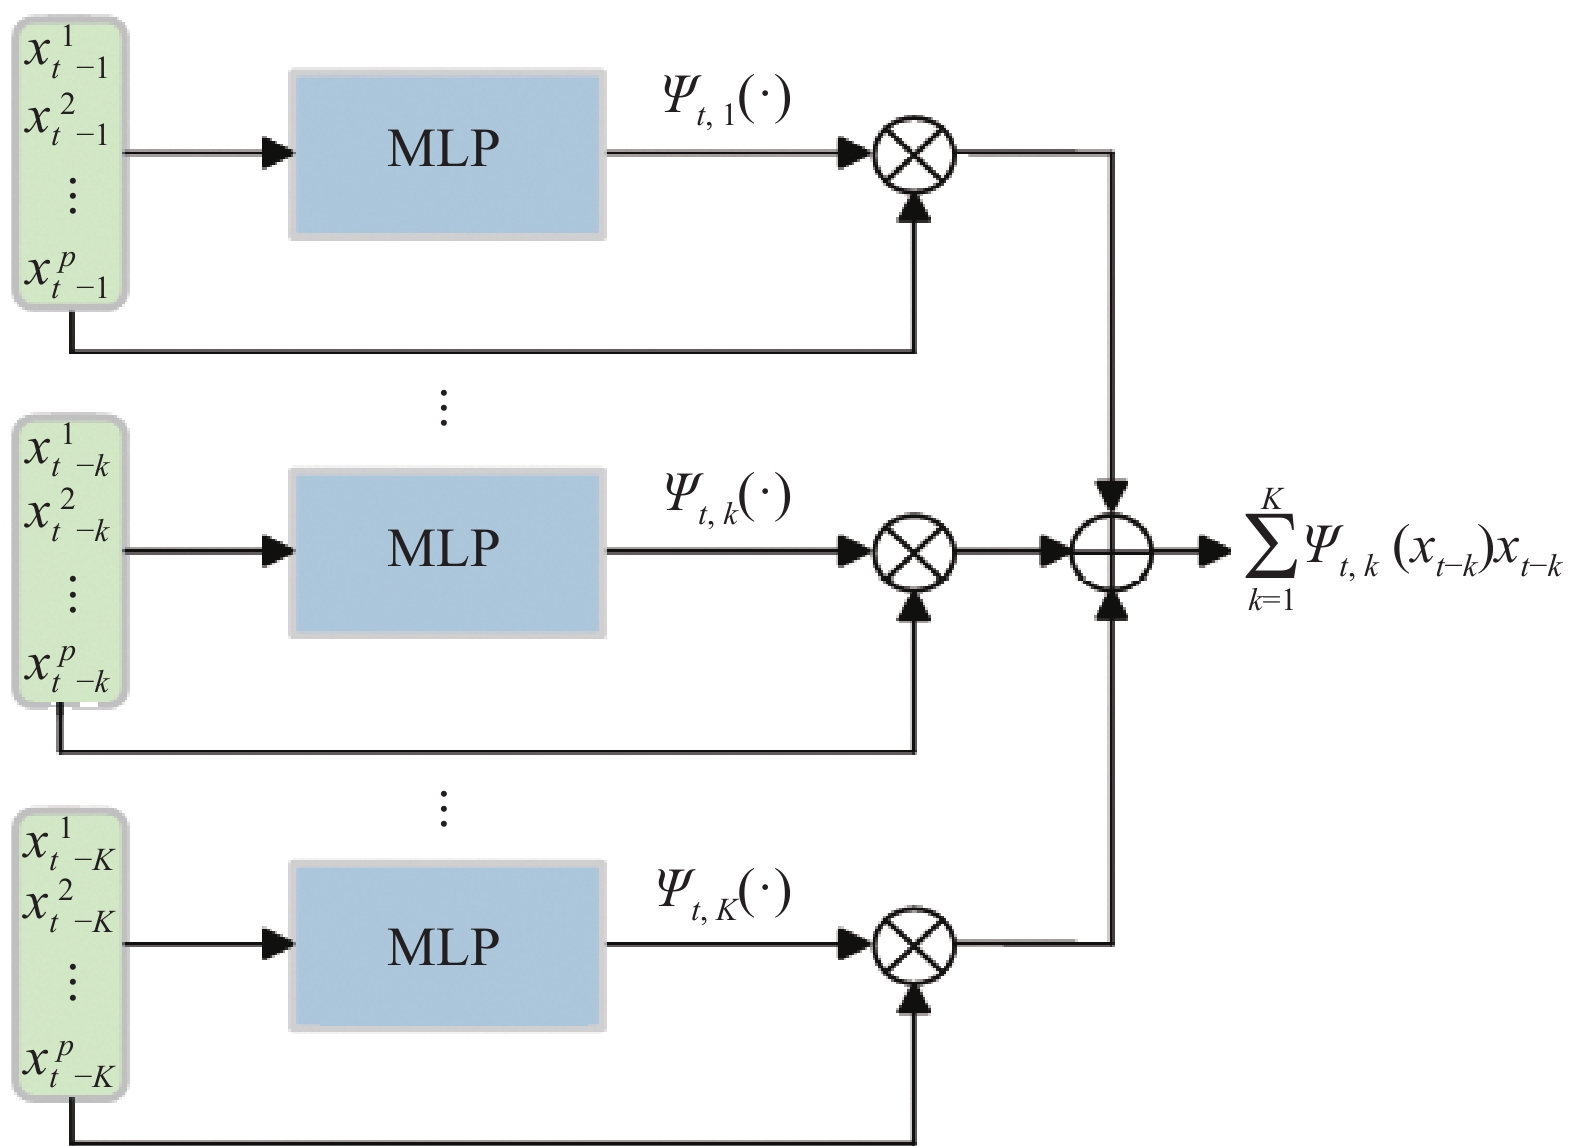
Figure 5. Block diagram of nonlinear vector autoregressive (NVAR) model implementation.
Typically, neural networks with three to five layers can achieve satisfactory performance. Having an excessive number of layers may lead to issues such as vanishing or exploding gradients. The number of neurons in the hidden layers should be generally between the number of the input layers and the number of the output layers [21]. In this study, the hidden layers utilize the rectified linear unit (ReLU) function as their activation function, while the output layer employs a linear activation function.
We employ batch gradient descent to minimize the penalized loss function during the training of the NVAR model. This approach helps mitigate spurious inferences in multivariate time series data. The loss function (4) is composed of components that encompass mean squared error loss, sparse penalty, and smoothness penalty, which could control the accuracy, sparsity, and nonlinearity of the NVAR model [20].


where  represents the single-step prediction for the time point at t by the NVAR model;
  represents a concise notation for concatenating generalized coefficient matrices
  ; and λ and γ are regularization parameters. The method of grid search will traverse all possible values of λ and γ to find the best combination.
The sparsity-inducing term  constitutes a suitable constraint on the magnitude of the extended coefficient matrices, where the elastic-net-style penalty term is employed.

where  is a penalty parameter and is set as
  [22]. By setting this sparsity-inducing term, the data dimension of the EEG-EMG signal and the complexity of NVAR model are reduced [23].
The smoothing penalty term, represented as  , is an appropriate penalty term for the mean norm that evaluates the difference between coefficient matrices at two consecutive time steps. Finally, the coefficient matrix
  is used to quantify the strength of granger causality between variables:

Here,  evaluates the extent of the granger causal influence exerted by variable xi on variable xj using coefficient matrices.
2.6. Complex Network Index
A complex network consists of numerous nodes and connections, exhibiting diverse and intricate structures and behaviors. In this study, we apply the following complex network indicators for analysis.
1) Degree
A node's degree is defined by the number of edges that surround it, and reflects the significance and connectivity of the node within the network.
2) Cluster Coefficient
The clustering coefficient is employed to describe the connectivity pattern around a node, and denotes the ratio of edges existing among the nodes that neighbor a specific node. A higher clustering coefficient signifies that the neighboring nodes of a node are more tightly interconnected, implying a greater degree of clustering within the network. The clustering coefficient Ci of node i can be expressed as

where  represents the number of nodes directly connected to node i,and
  indicates the current count of existing connecting edges. The overall clustering coefficient C for a complex network with N nodes can be defined as follows:

3) Global Efficiency
Global efficiency is a measure used to assess the efficiency of information transmission in complex networks. The network global efficiency  is characterized as

where dij represents the minimum distance between nodes i and j.
4) Small-World Coefficient
The small-world coefficient is a metric utilized to characterize the level of clustering within a network. It is calculated by comparing the clustering of an actual network to that of a randomly generated network of the equivalent size. The small-world is defined as

where Creal represents the clustering coefficient, Lreal is the average path length of the actual network, Crandom represents the clustering coefficient, and Lrandom is the average path length of a randomly generated network of the equivalent size. When the small-world coefficient  , the network is more clustered than an equivalent-sized random network, demonstrating small-world properties.
3. Result
3.1. Time-Frequency Feature Extraction
Following the approach outlined in Subsection 2.3, we employ the decomposition of wavelet packets on 7 layers and a fourth-order Coiflet wavelet as the wavelet basis function to break down the signals [24]. This allows us to obtain the amplitude feature w(f, t) of EMG as well as EEG at frequency f , time t and resolution 1 Hz. This ensures that the details of frequency changes between signals will not be lost, and frequency aliasing is avoided. Hence, we have set the frequency resolution to 1 Hz. Afterward, EEG and EMG signals centered at f = 5, 6, ···, 60 Hz are extracted for modeling and causality analysis. Figure 6 displays the extraction results of the frequency (2 s before the motion execution period). The mean square error between the reconstructed signal and the original signal is less than 1 × 10⁻²⁰ after wavelet packet decomposition, which indicates that the original signal's information can be preserved by wavelet packet decomposition to a large extent. Figure 7 shows the frequency spectrum diagram corresponding to Figure 6. It is seen that Coiflets wavelet packet decomposition effectively enables the extraction of signal features within each frequency band, laying the foundation for the subsequent analysis of the causal relationship in each frequency band of the signal.
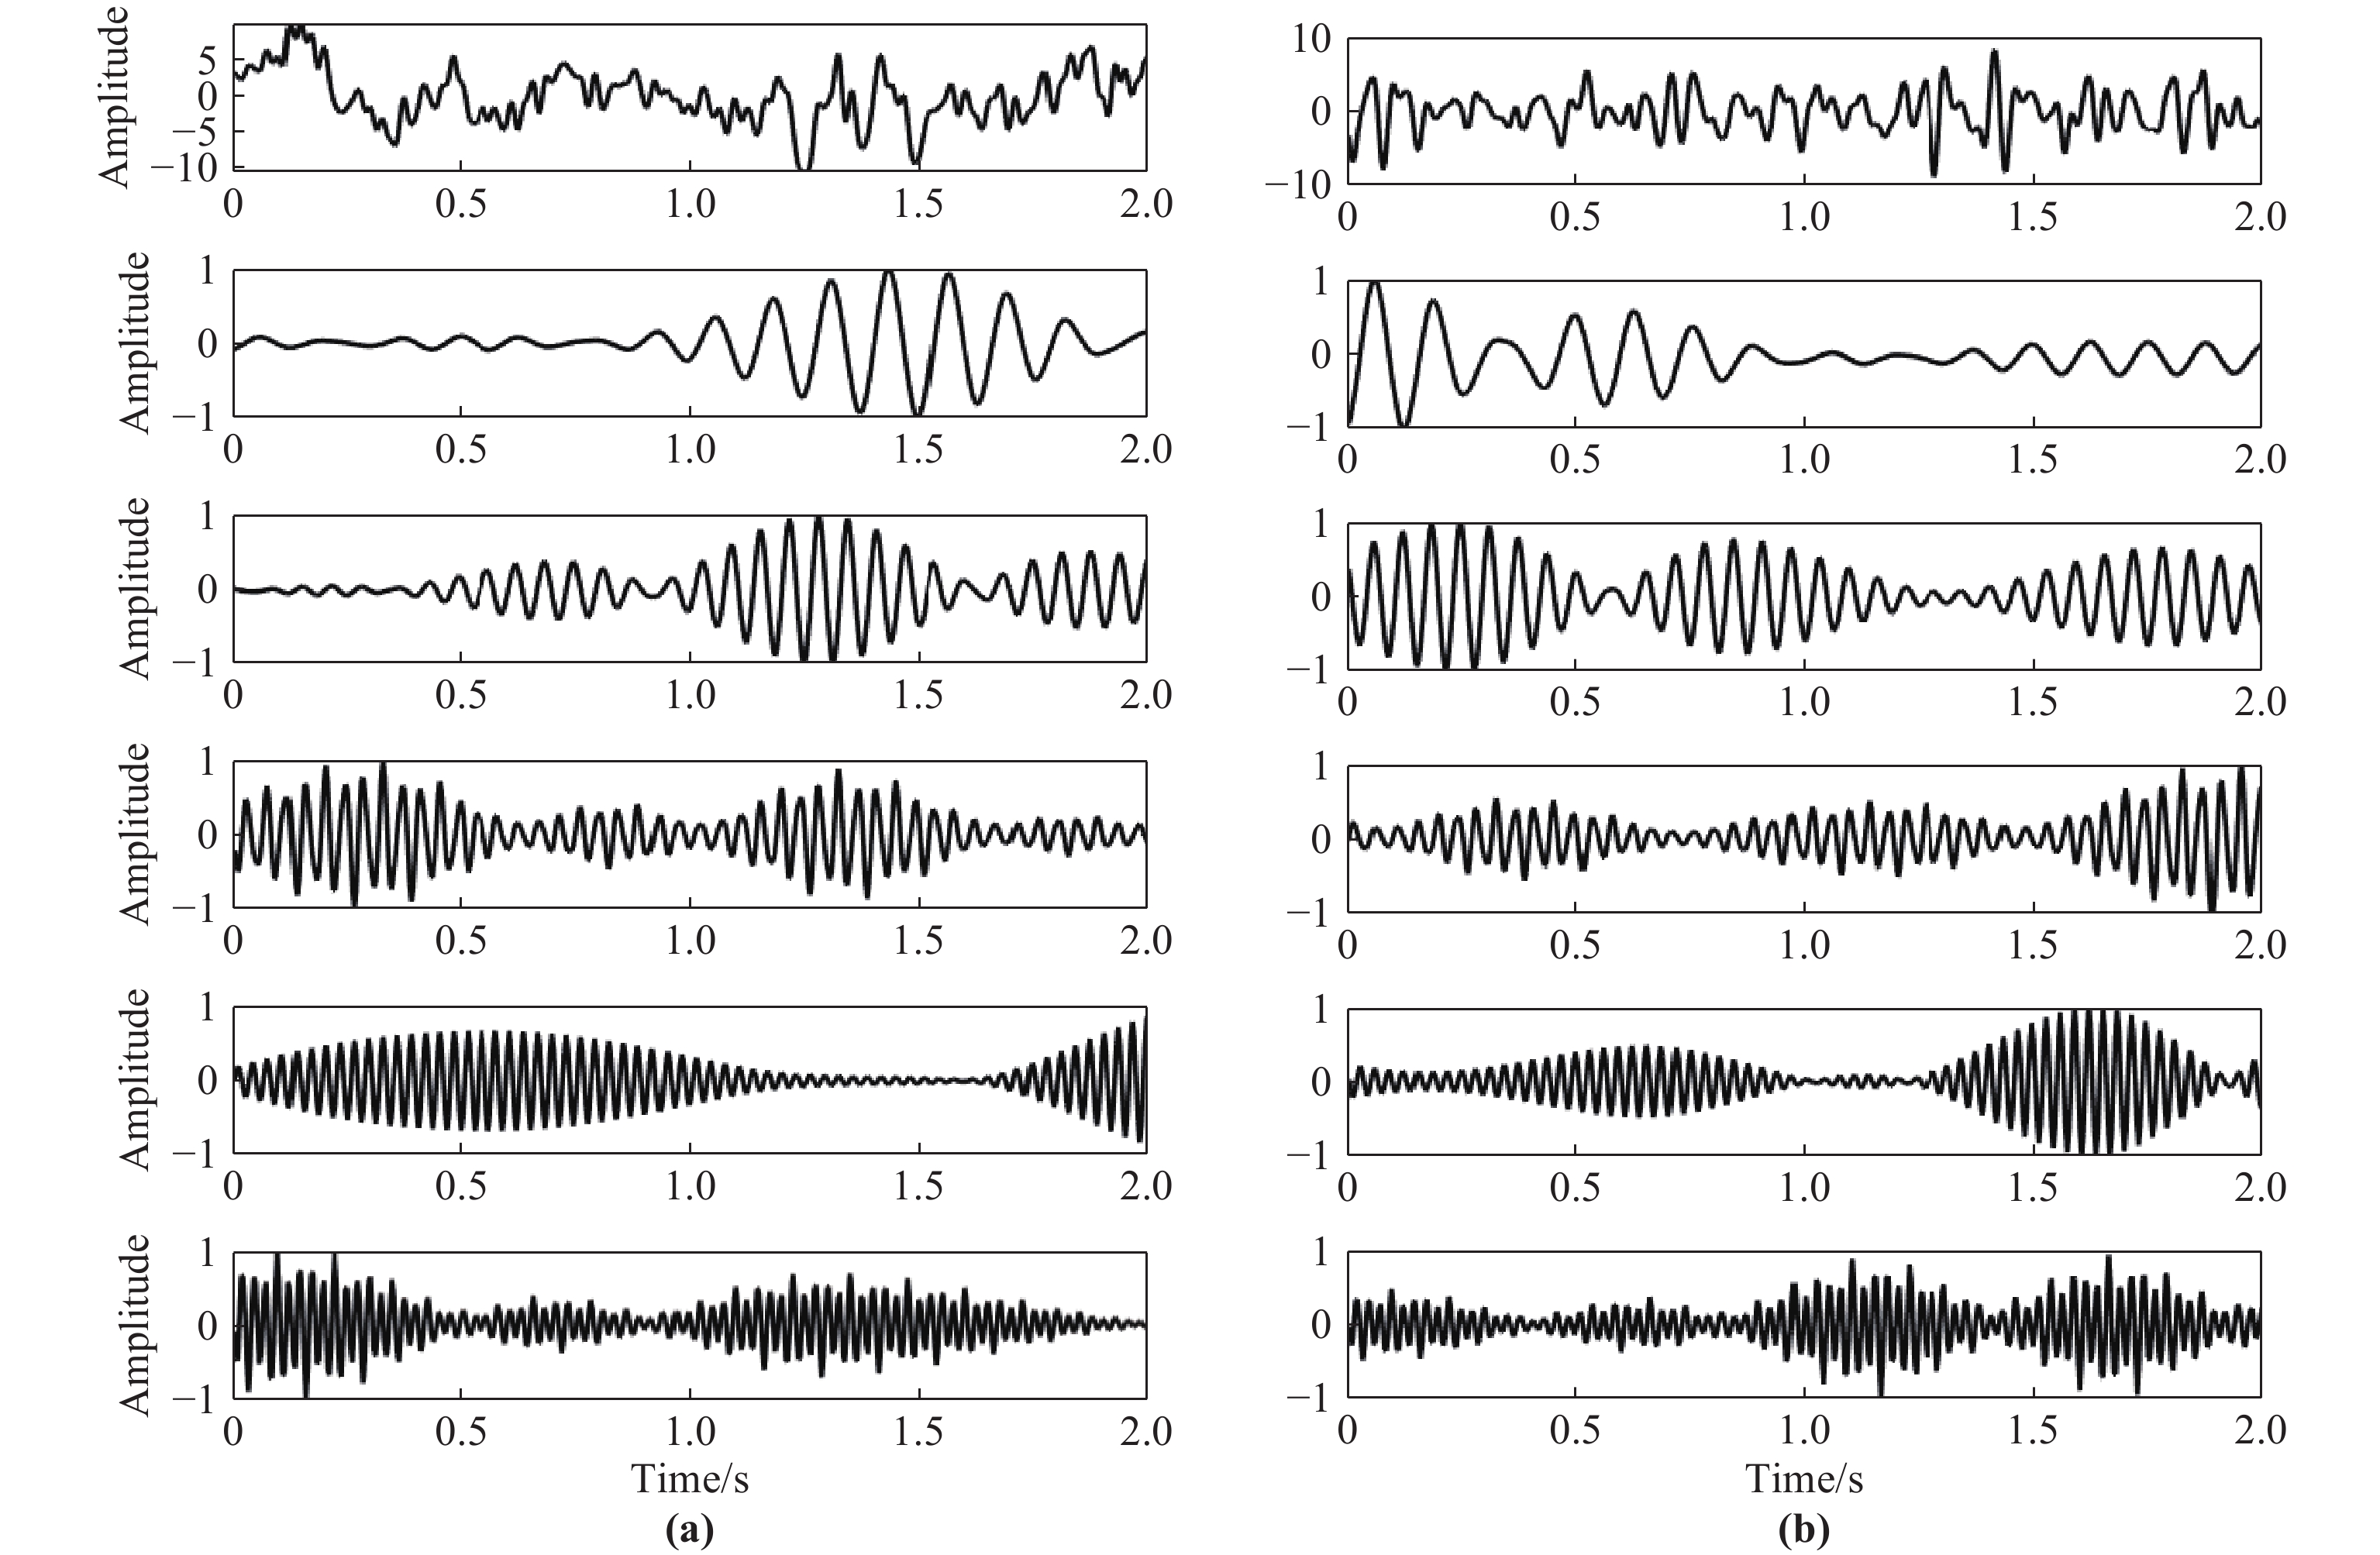
Figure 6. Decomposition of wavelet packets (from highest to lowest, results in following extracted bands after preprocessing: original signal, 8, 16, 24, 32, and 40 Hz): (a) EEG; (b) EMG.
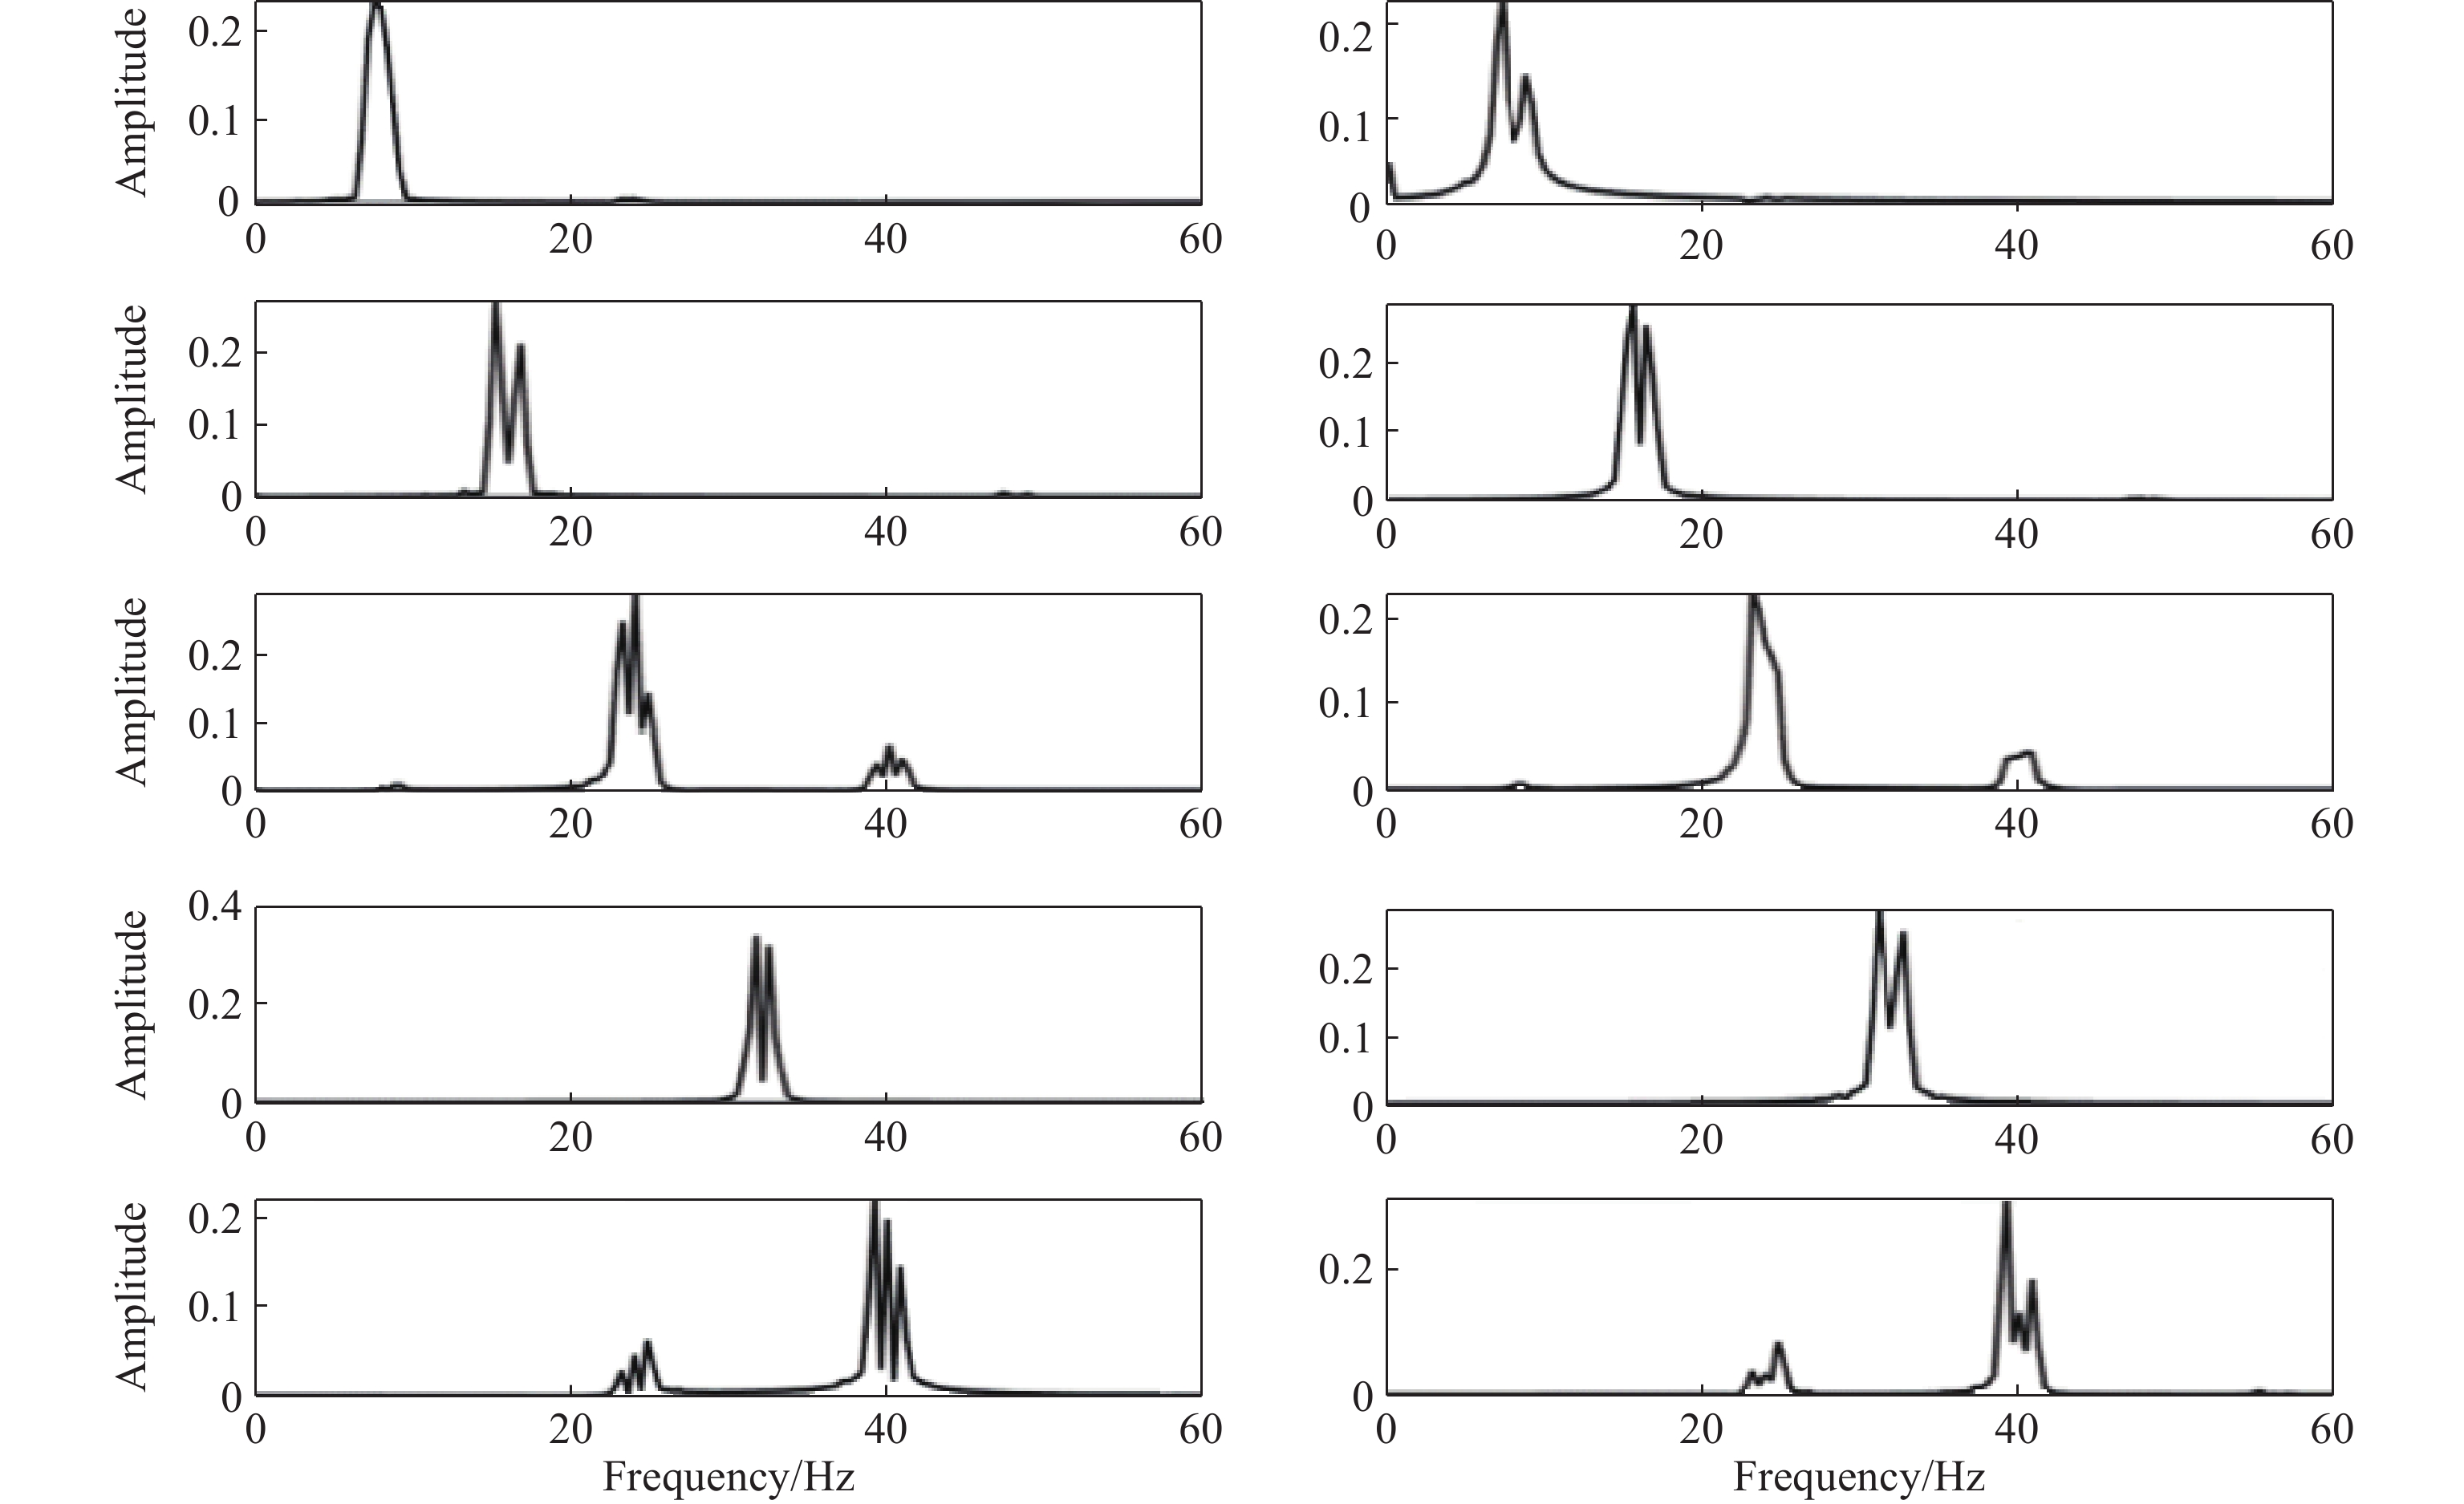
Figure 7. Spectrum diagram (from highest to lowest, results in following extracted bands after preprocessing: 8, 16, 24, 32, and 40 Hz): (a) EEG; (b) EMG.
3.2. NVAR-TF-GC
The previous research has empirically confirmed that, when applied to nonlinear systems, the causality detection method based on the NVAR model exhibits superior predictive accuracy over the linear Gaussian dynamic Bayesian networks (DBN) [20]. Now, we apply the NVAR method to the prediction of causality in multi-channel EEG-EMG data, and the GC adjacency matrix is computed between cortical and muscular elements within each frequency band of 14 channels of EEG signals and 7 channels of EMG signals. The model comprises 21 input nodes, 3 hidden layers with 40 nodes in each hidden layer, and 441 output nodes. The training process runs for 500 iterations at a learning rate of 0.0001 and a batch size of 256.
The GC of the subjects is averaged and summarized, as shown in Figure 8. After training, the one-way analysis of variance (ANOVA) (conducted on GC values from 30 participants) reveals significant differences among various frequency bands for reaching movements (p<0.05). Compared to the gamma band, GC between EEG-EMG signals in the alpha and beta bands is enhanced, suggesting that the alpha and beta bands serve as the primary carriers of information for elbow movements in stroke patients.

Figure 8. Box diagram of GC of elbow forward movement (*: p<0.05).
At the same time, we compare the GC values of the elbow extension in different frequency bands and muscle-to-cortex through drawing, as depicted in Figure 9. In the gamma band, the flow of information from the brain to the muscle tissue is more pronounced, and the flow of information from the muscle to the brain tissue is more significant in the alpha, beta1, and beta2 bands.

Figure 9. GC in up and down of elbow extension (*: p<0.05).
Next, the EEG→EMG (down) and EMG→EEG (up) segments of the GC adjacency matrix are subjected to individual univariate variance testing within the in-group, as presented in Table 1. The outcomes of the within-group ANOVA indicate significant differences in the upward direction within the gamma frequency band, though the source of this significance cannot be conclusively attributed to within-group individual variation. In the downward direction, no significant differences are observed. However, within the alpha and beta frequency bands, significant differences are noted in both upward and downward directions, which indicates that a regular pattern cannot be deduced from the one-way ANOVA of the GC derived through the gamma band.
Table 1. p of one-way ANOVA in the elbow extension group
| alpha | beta1 | beta2 | gamma | ||
| *: indicates significance, 95% confidence interval | |||||
| Down | Within-group | 0.0303* | 0.0099* | 1.3729×10⁻⁴* | 0.1690 |
| Up | Within-group | 0.0041* | 0.0107* | 2.1606×10⁻⁵* | 0.0142* |
The GC heatmap of one subject’s elbow extension in frequency bands is depicted in Figure 10. By comparing the heatmap of GC for the same subject, it can be found that there are some differences in GC between different frequency bands.
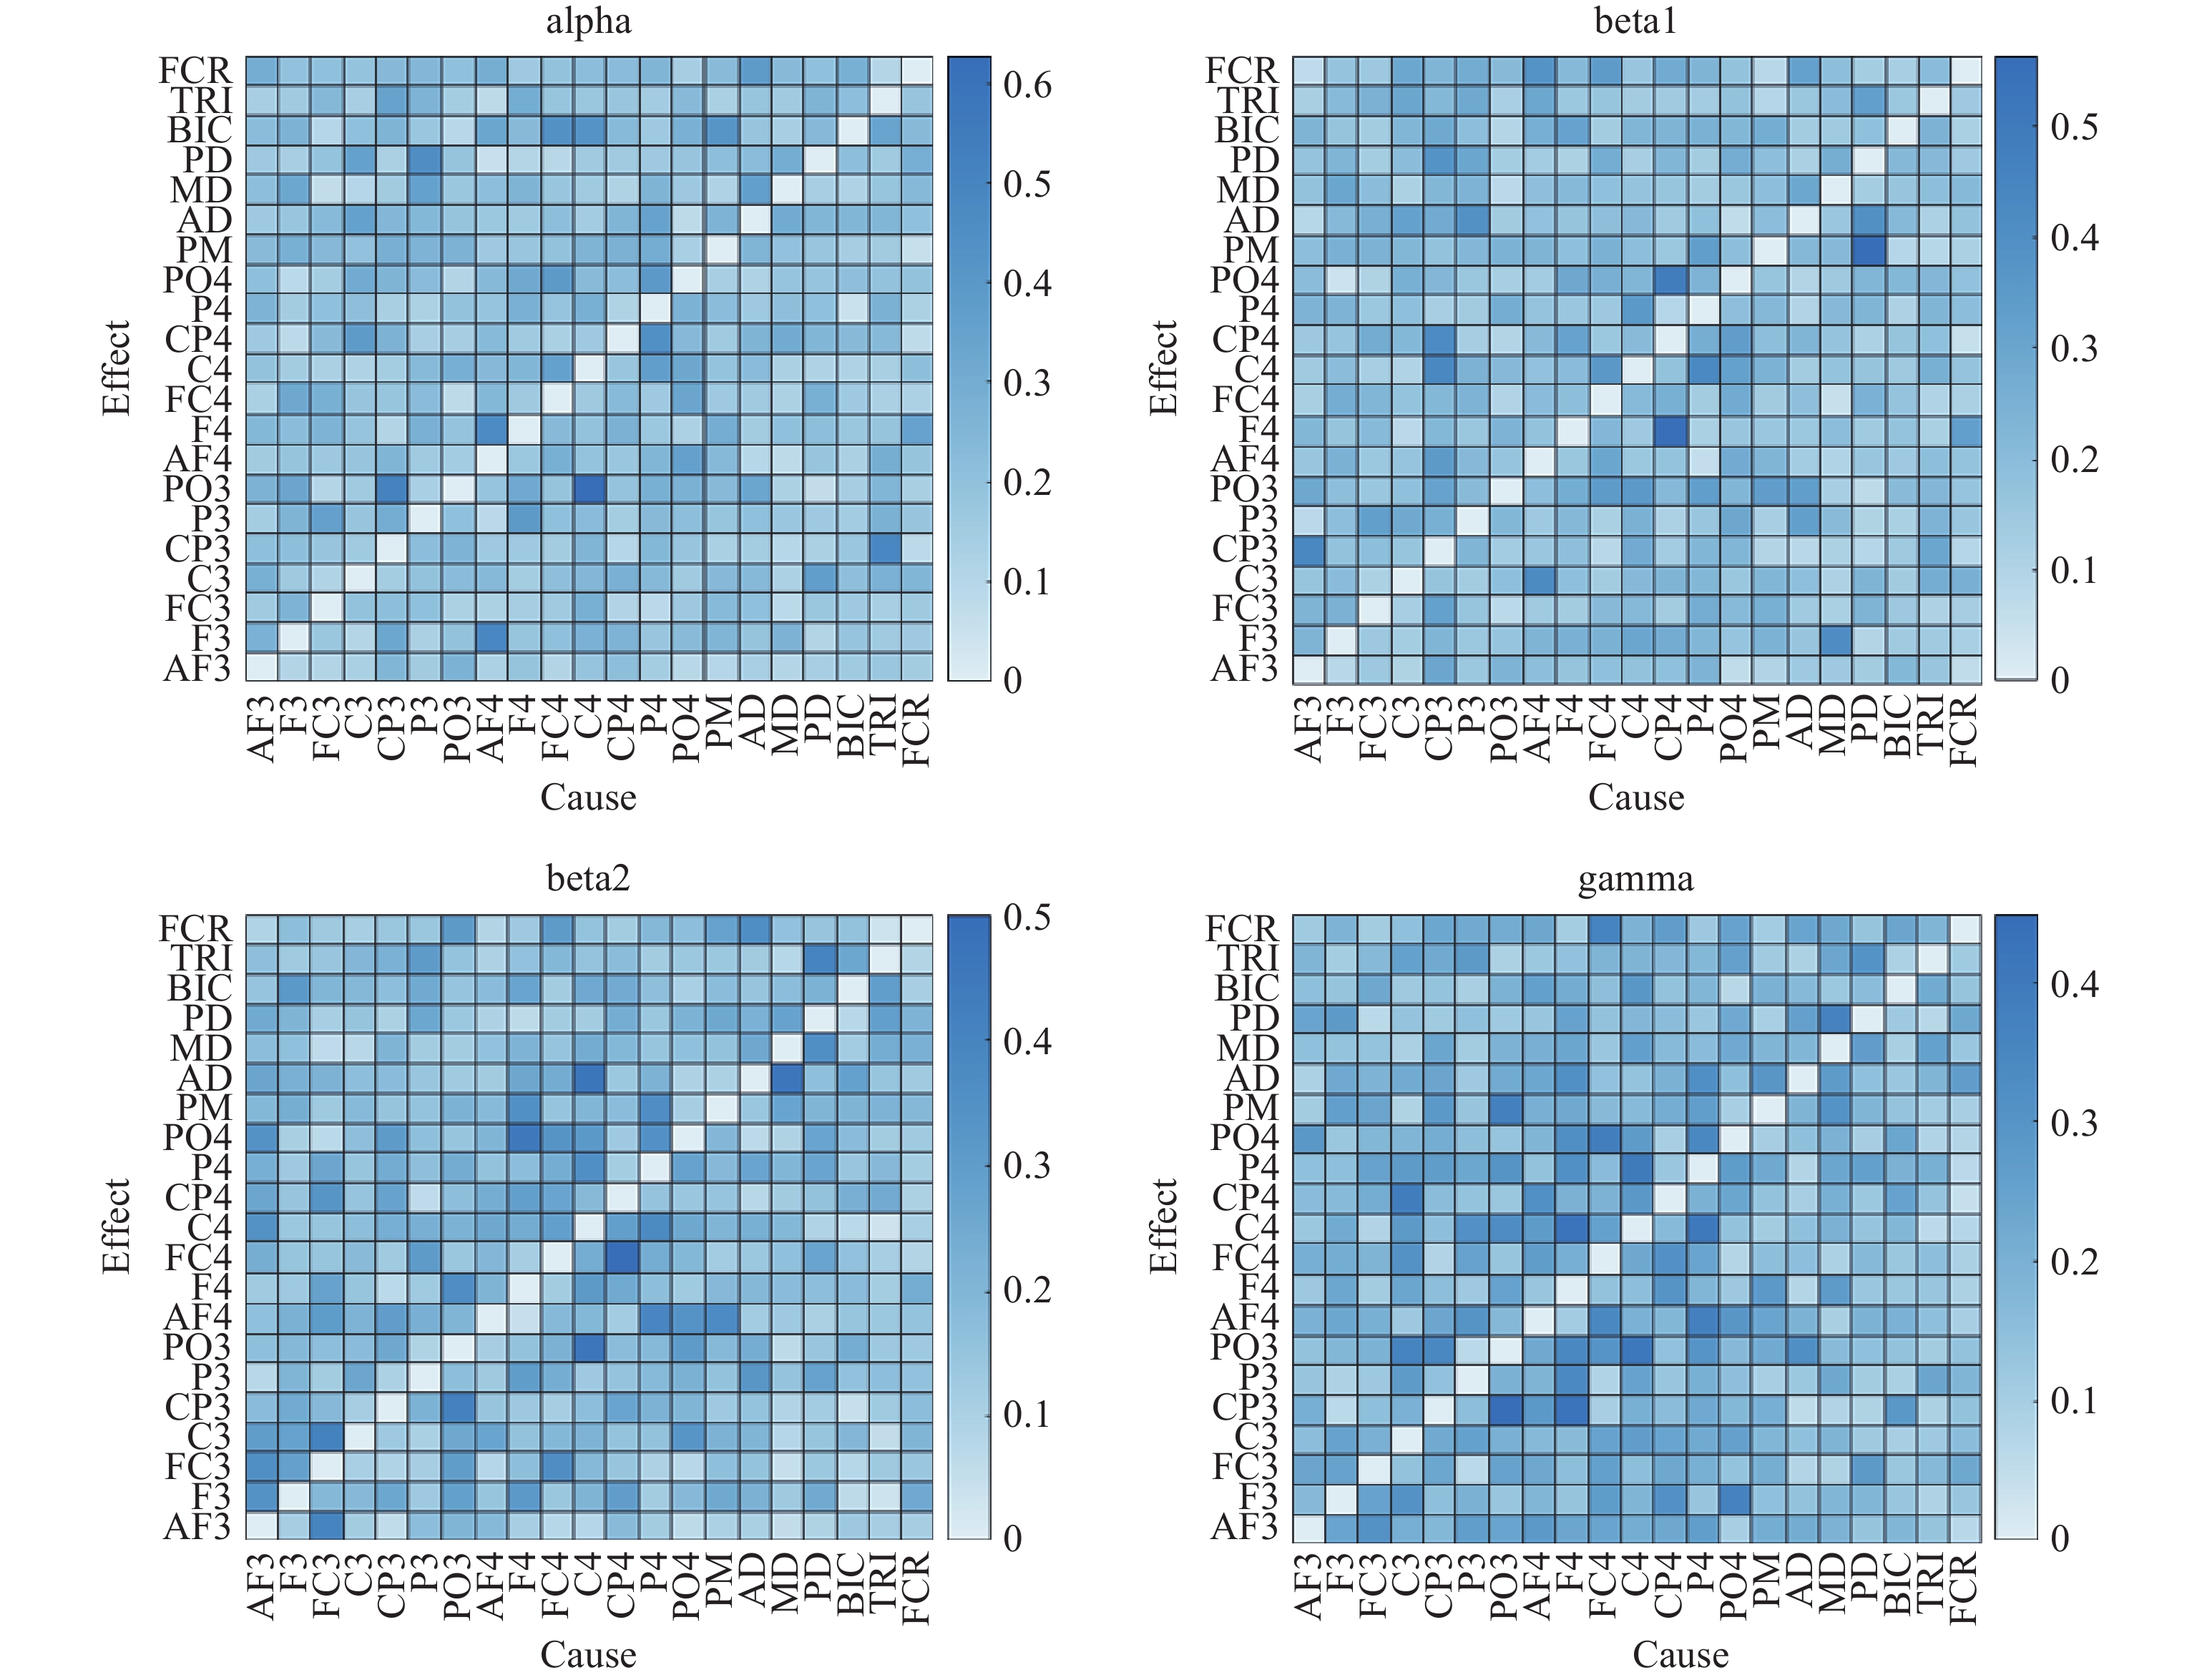
Figure 10. GC heat map of elbow extension movement.
3.3. Network Structural Characteristics
After the GC adjacency matrix is determined by the NVAR-TF-GC analysis method, the top 15% of GC intensity in the adjacency matrix is taken as the threshold value to establish the cortico-muscular effective network (CMEN). This threshold segmentation method has been studied in the past study [25, 26], where the segmentation method is used to ensure that CMEN is neither a very sparse network nor a very dense network.
Firstly, the clustering coefficient C and the average of the global efficiency  of the GC adjacency matrix (for elbow extension at 15% network density) are calculated. As shown in Figure 11, the average of the clustering coefficient C is higher in the alpha and beta frequency bands than in the gamma frequency band, which indicates that the cortical-muscular networks in the brain exhibit different clustering patterns at different frequency bands during elbow movements. Specifically, the cortical-muscular networks cluster more closely in the alpha and beta frequency bands than in the gamma frequency band during elbow movements.
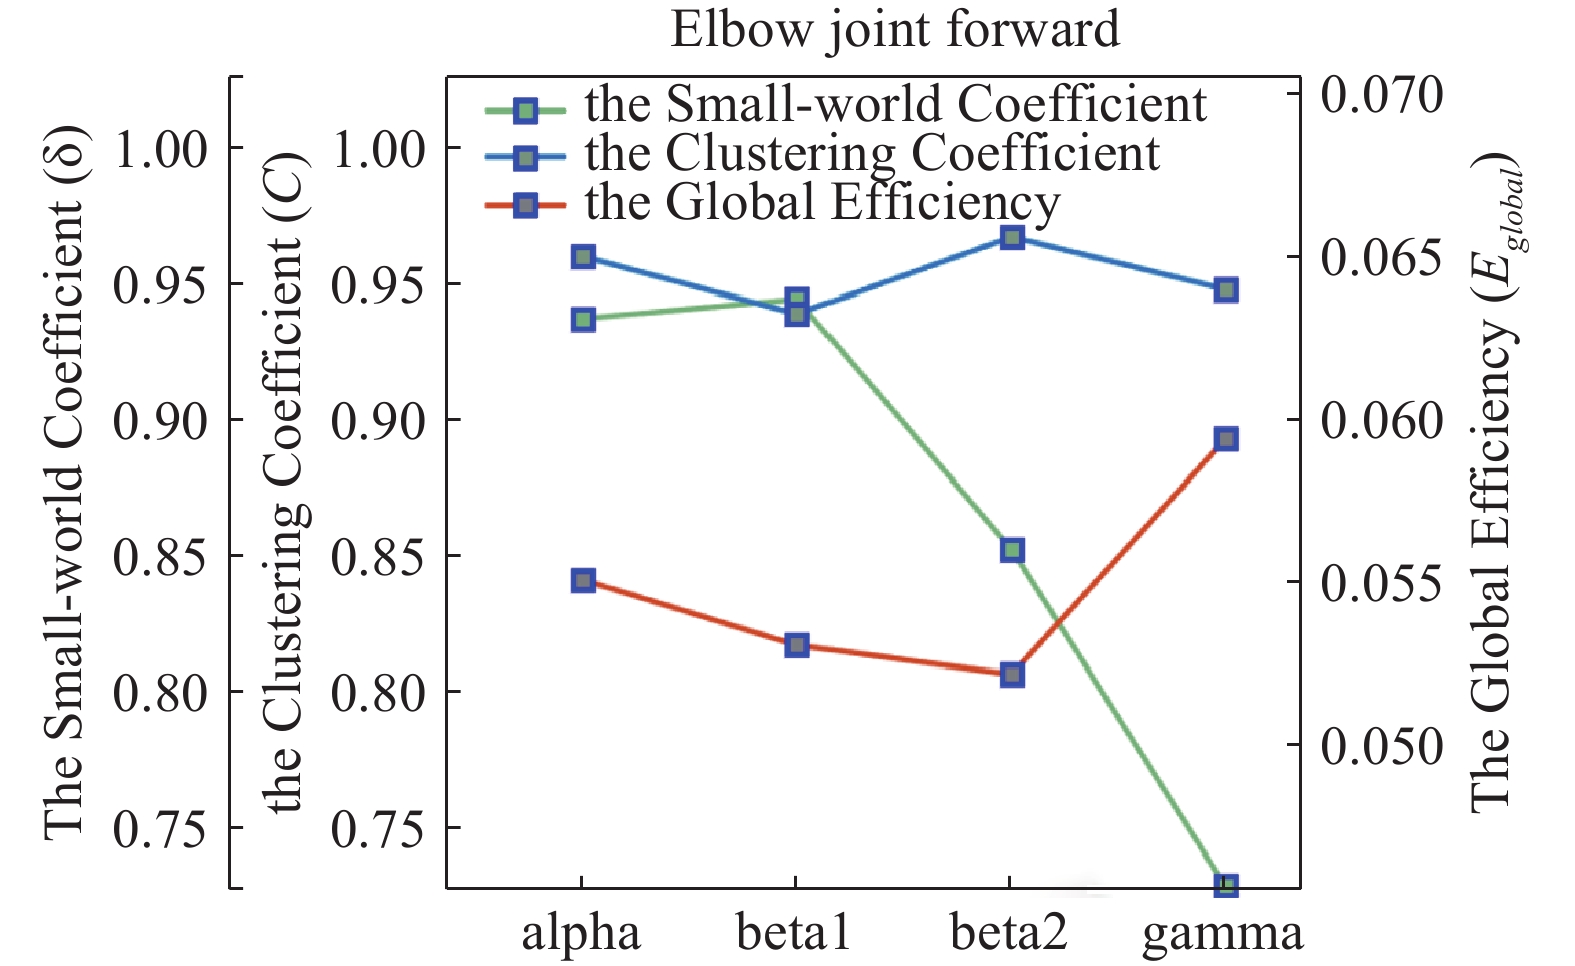
Figure 11. Mean clustering coefficients of cortical-muscular causal networks, mean global efficiency of cortical-muscular causative network and small-world coefficients of cortical-muscular causal networks.
Furthermore, the average of  is greater in the alpha and gamma bands than in the beta bands, indicating that cortical muscles transmit information differently in different bands when the subject performs elbow extension. This suggests that the cortex and muscles transmit information more efficiently in the alpha and gamma bands.
Many scholars have presented evidence that the brain’s functional network exhibits small-world properties [27, 28]. In this study, we construct a randomized network of the same scale to ascertain whether CMEN in stroke patients exhibits similar small-world properties, and the results are shown in the green line chart marked in green in Figure 11. Clearly, the corticomuscular causal network of elbow extension in stroke patients has no small-world properties in any of the four frequency bands (when the small-world coefficient  ). It is speculated that the structural changes between the cortex and muscle neurons (caused by the onset of stroke) will not only affect the damaged site, but also affect the functional connections between the damaged and other normal regions. This disruption could potentially be the primary cause of the reduced small-world properties within the brain's functional network following a stroke [29].
For better understanding CMEN, a weighted network connection diagram of the GC adjacency matrix in the beta1-band is generated, as shown in Figure 12, where the color bar represents the degrees of CMEN. Clearly, there is a strong connection between the left motor area and the muscle, which may indirectly indicate that the limb movement of the body is mainly controlled by the contralateral motor area in the directed connection diagram of the elbow extension. By means of straightforward visual inspection, it becomes evident that the directed connection graph related to elbow extension displays characteristics resembling that of a regular network. However, it does not exhibit the typical traits associated with a small-world network, which is consistent with the computational findings presented in Figure 11.
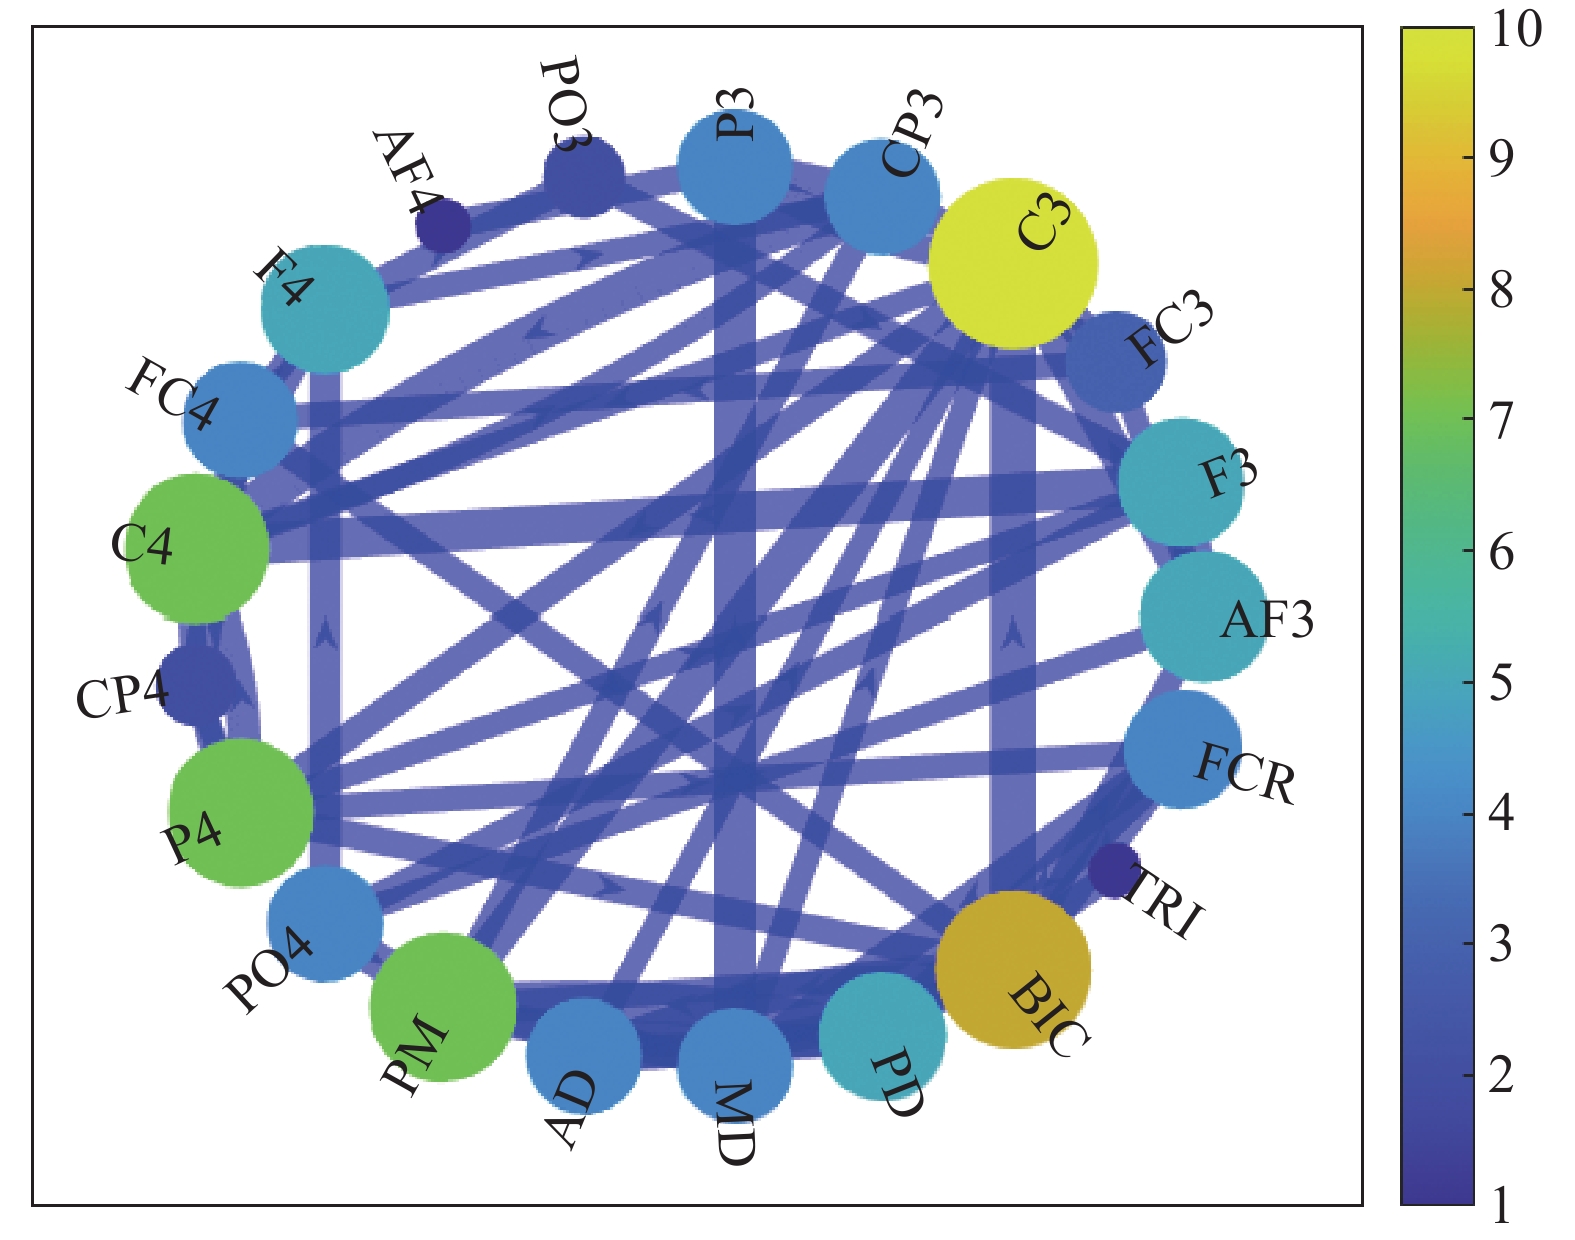
Figure 12. Weighted connection graph.
4. Discussion
In this study, we present an approach for analyzing multivariate time-frequency Granger causality (NVAR-TF-GC) which relies on the NVAR model and wavelet packet decomposition. The proposed method is employed to calculate the GC adjacency matrix with EEG and EMG signals simultaneously collected during elbow extension, and construct the corticomuscular causality network (CMEN). This explores the cortical-muscular causality of elbow joint movement control from the perspective of complex networks. The study has shown that causal relationships between the cortex and muscles during elbow movement control are bidirectional, and the causal relationships have variations in causal relationships among different EEG channels.
There is a directed information flow pattern in the causal relationship between cortical muscles during elbow extension, and this pattern depends on frequency bands. In alpha, beta1, beta2 and gamma bands, the flow of information from the muscle to the brain is obvious. Previous studies have found that the strength of neuromuscular coupling in the down direction of beta2-band is greater than that in the up direction [30, 31]. On the contrary, the conclusion in this study is different from previous studies. This difference is primarily due to the fact that previous studies only examine the corticomuscular coupling between a single brain region and the muscle, neglecting the involvement of other brain regions and muscles in elbow movements. In this research, a new method is employed to integrate multi-channel EEG and several important EMG signals by the NVAR model. Consequently, it is concluded that the directed information flow pattern of the cortical-muscle causal relationship changes across different frequency bands [32].
The GC adjacency matrix in the down direction and the up direction shows a stronger causal relationship in the alpha and beta frequency bands than in the gamma frequency band. These results indicate that the alpha and beta bands can serve as information carriers within the elbow joint's motor cortex.
Exploring the small-world properties of the cortical-muscular network can enhance our understanding of the brain information processing mechanisms and functions. This property is crucial for the human sensorimotor control system as it facilitates information transfer and integration while maintaining network efficiency and stability. Suarez et al.’s study on small-world networks demonstrated the strong association between the small-world topology and dynamic complexity [33]. Analyzing the network characteristics of CMEN reveals the absence of small-world properties in the alpha, beta, and gamma frequency bands. The small-world coefficient δ of elbow extension motion in beta1 and beta2 bands is the highest, while the global efficiency  is the smallest. A higher small-world coefficient indicates the presence of more random edges in the network. Consequently, the global network aggregation tends to decrease, reducing the distance between nodes, decreasing the global efficiency and improving the local efficiency.
Simultaneously, CMEN is associated with an individual's actual movements, enabling the analysis of the causal relationship between the cortex and the muscles during elbow extension. The study reveals that the network connections in elbow extension are predominantly concentrated in the contralateral movement region and associated muscles. These findings indicate that the causal association between the cortex and muscles can be effectively assessed by establishing CMEN within the context of complex networks.
5. Conclusion
In this research, we have introduced the NVAR-TF-GC approach, which relies on the NVAR model and wavelet packet decomposition. The proposed approach has been used to calculate the GC adjacency matrix with EEG and EMG signals (collected simultaneously during elbow extension), and construct the corticomuscular causality network (CMEN). The experimental results have demonstrated that the NVAR-TF-GC method can effectively perform causality analysis of multivariable systems and can be applied to the human sensorimotor control system. By treating multiple muscles of the cerebral cortex and upper limbs as an integrated entity, we employ the complex network theory to reveal the causal interactions between the cerebral cortex and upper limb muscles. Analyzing cortical-muscle synchronization features enhances our understanding of how the brain controls elbow movements, providing a foundation for researching elbow functions and assessing sports rehabilitation.
It should be noted that some limitations still exist in this paper. The study has employed a combination of wavelet packet decomposition and the NVAR model, where wavelet packet decomposition has been used to extract information from different frequency bands of the signals. The NVAR model has then been applied to the collected EEG-EMG data to analyze the relationship between the cerebral cortex and muscles during movements in different frequency bands. The primary focus has been placed on the application of the NVAR model to the actual collection of EEG-EMG data. In future research, it may be worthwhile to consider algorithmic optimization and various combinations.
Author Contributions: Jiyu Tan: investigation, data curation, writing-original draft and writing-review & editing; Yurong Li: supervision, writing-review & editing; Qiurong Xie: resources, supervision; Xiaoling Wang: resources, supervision. All authors have read and agreed to the published version of the manuscript.
Funding: This work was supported by National Natural Science Foundation of China (Grant Nos. 62373108 and 82305357).
Data Availability Statement: Not applicable.
Conflicts of Interest: The authors declare no conflict of interest.
References
- Shan, Y.Z.; Feng, H.Q.; Li, Z. Electrical stimulation for nervous system injury: Research progress and prospects. Acta Phys.-Chim. Sin., 2020, 36: 2005038. doi: https://doi.org/10.3866/PKU.WHXB202005038
- Filatova, O.G.; Yang, Y.; Dewald, J.P.A.; et al. Dynamic information flow based on EEG and diffusion MRI in stroke: A proof-of-principle study. Front. Neural Circuits 2018 , 12, 79. doi: https://doi.org/10.3389/fncir.2018.00079
- Lin, J.L.; Tian, J.; Jia, J. Study on the correlation between daily living activities and motor function of upper limbs and hands in elderly stroke patients. Geriatr. Health Care, 2020, 26: 362−366. doi: https://doi.org/10.3969/j.issn.1008-8296.2020.03.008
- Yokoyama, H.; Kaneko, N.; Ogawa, T.; et al. Cortical correlates of locomotor muscle synergy activation in humans: An electroencephalographic decoding study. iScience, 2019, 15: 623−639. doi: https://doi.org/10.1016/j.isci.2019.04.008
- Bourguignon, M.; Jousmäki, V.; Dalal, S.S.; et al. Coupling between human brain activity and body movements: Insights from non-invasive electromagnetic recordings. NeuroImage, 2019, 203: 116177. doi: https://doi.org/10.1016/j.neuroimage.2019.116177
- Nijhuis, P.; Keller, P.E.; Nozaradan, S.; et al. Dynamic modulation of cortico-muscular coupling during real and imagined sensorimotor synchronisation. NeuroImage, 2021, 238: 118209. doi: https://doi.org/10.1016/j.neuroimage.2021.118209
- Chen, X.L.; Xie, P.; Zhang, Y.Y.; et al. Abnormal functional corticomuscular coupling after stroke. NeuroImage: Clin., 2018, 19: 147−159. doi: https://doi.org/10.1016/j.nicl.2018.04.004
- Lapenta, O.M.; Keller, P.E.; Nozaradan, S.; et al. Lateralised dynamic modulations of corticomuscular coherence associated with bimanual learning of rhythmic patterns. Sci. Rep., 2022, 12: 6271. doi: https://doi.org/10.1038/S41598-022-10342-5
- Witte, M.; Patino, L.; Andrykiewicz, A.; et al. Modulation of human corticomuscular beta-range coherence with low-level static forces. Eur. J. Neuroscience, 2007, 26: 3564−3570. doi: https://doi.org/10.1111/j.1460-9568.2007.05942.x
- Li, S.J.; Fan, M.X.; Yu, H.L.; et al. Gamma frequency band shift of contralateral corticomuscular synchronous oscillations with force strength for hand movement tasks. NeuroReport, 2020, 31: 338−345. doi: https://doi.org/10.1097/WNR.0000000000001409
- Venkat, V.P.B.; Chinara, S. Automatic classification methods for detecting drowsiness using wavelet packet transform extracted time-domain features from single-channel EEG signal. J. Neurosci. Methods, 2021, 347: 108927. doi: https://doi.org/10.1016/j.jneumeth.2020.108927
- Zhu, F.F.; Li, Y.R.; Shi, Z.Y.; et al. TV-NARX and Coiflets WPT based time-frequency Granger causality with application to corticomuscular coupling in hand-grasping. Front. Neurosci., 2022, 16: 1014495. doi: https://doi.org/10.3389/fnins.2022.1014495
- Li, H.; Wang, Z.D.; Lan, C.B.; et al. A novel dynamic multiobjective optimization algorithm with non-inductive transfer learning based on multi-strategy adaptive selection. IEEE Trans. Neural Netw. Learn. Syst. 2023 , in press.doi: https://doi.org/10.1109/TNNLS.2023.3295461
- Toda, H.; Phillips, P.C.B. Vector Autoregression and Causality; Yale University: Connecticut, 1991.
- Li, H.; Wang, Z.D.; Lan, C.B.; et al. A novel dynamic multiobjective optimization algorithm with hierarchical response system. IEEE Trans. Comput. Soc. Syst. 2023 , in press. doi: https://doi.org/10.1109/TCSS.2023.3293331
- Li, H.; Wu, P.S.; Zeng, N.Y.; et al. A survey on parameter identification, state estimation and data analytics for lateral flow immunoassay: From systems science perspective. Int. J. Syst. Sci., 2022, 53: 3556−3576. doi: https://doi.org/10.1080/00207721.2022.2083262
- Fang, J.Z.; Wang, Z.D.; Liu, W.B.; et al. A new particle swarm optimization algorithm for outlier detection: Industrial data clustering in wire arc additive manufacturing. IEEE Trans. Autom. Sci. Eng. 2022 , in press. doi:10.1109/TASE.2022.3230080.
- Samadi, S.Y.; Hajebi, M.; Farnoosh, R. A semiparametric approach for modelling multivariate nonlinear time series. Can. J. Statistics, 2019, 47: 668−687. doi: https://doi.org/10.1002/cjs.11518
- Dong, A.X.; Starr, A.; Zhao, Y.F. Neural network-based parametric system identification: A review. Int. J. Syst. Sci., 2023, 54: 2676−2688. doi: https://doi.org/10.1080/00207721.2023.2241957
- Marcinkevics, R.; Vogt, J.E. Interpretable models for granger causality using self-explaining neural networks. In Proceedings of the 9th International Conference on Learning Representations, Virtual Event, Austria, 3–7 May 2021; OpenReview.net, 2021.
- Heaton, J. Introduction to Neural Networks with Java, 2nd ed.; Heaton Research, Inc: Missouri, 2008.
- Nicholson, W.B.; Matteson, D.S.; Bien, J. VARX-L: Structured regularization for large vector autoregressions with exogenous variables. Int. J. Forecast., 2017, 33: 627−651. doi: https://doi.org/10.1016/j.ijforecast.2017.01.003
- Bako, L. On sparsity-inducing methods in system identification and state estimation. Int. J. Robust Nonlinear Control, 2023, 33: 177−208. doi: https://doi.org/10.1002/rnc.5995
- Elmahdi, R.; Amed, N.Y.; Amin, M.B.M., et al. Comparative study between daubechies and coiflets wavelet decomposition mother families in feature extraction of BCI based on multiclass motor imagery discrimination. J. Clin. Eng., 2019, 44: 41−46. doi: https://doi.org/10.1097/JCE.0000000000000320
- Reineberg, A.E.; Banich, M.T. Functional connectivity at rest is sensitive to individual differences in executive function: A network analysis. Hum. Brain Mapp., 2016, 37: 2959−2975. doi: https://doi.org/10.1002/hbm.23219
- Redcay, E.; Moran, J.M.; Mavros, P.L.; et al. Intrinsic functional network organization in high-functioning adolescents with autism spectrum disorder. Front. Hum. Neurosci., 2013, 7: 573. doi: https://doi.org/10.3389/fnhum.2013.00573
- Li, G.; Luo, Y.D.; Zhang, Z.R.; et al. Effects of mental fatigue on small-world brain functional network organization. Neural Plast., 2019, 2019: 1716074. doi: https://doi.org/10.1155/2019/1716074
- Bin, S.; Sun, G.X.; Chen, C.C. Analysis of functional brain network based on electroencephalography and complex network. Microsyst. Technol., 2021, 27: 1525−1533. doi: https://doi.org/10.1007/s00542-019-04424-0
- Liu, M.M.; Xu, G.Z.; Yu, L.H.; et al. Effects of anodal transcranial direct current stimulation on brain functional network in stroke patients. Chin. J. Biomed. Eng. 2023 , 42, 119–123. (In Chinese).
- Liu, J.B.; Tan, G.S.; Sheng, Y.X.; et al. Multiscale transfer spectral entropy for quantifying corticomuscular interaction. IEEE J. Biomed. Health Inform., 2021, 25: 2281−2292. doi: https://doi.org/10.1109/JBHI.2020.3032979
- Liang, T.; Zhang, Q.Y.; Liu, X.G.; et al. Identifying bidirectional total and non-linear information flow in functional corticomuscular coupling during a dorsiflexion task: A pilot study. J. Neuroeng. Rehabil., 2021, 18: 74. doi: https://doi.org/10.1186/S12984-021-00872-W
- Xi, X.G.; Ding, J.S.; Wang, J.H.; et al. Analysis of functional corticomuscular coupling based on multiscale transfer spectral entropy. IEEE J. Biomed. Health Inform., 2022, 26: 5085−5096. doi: https://doi.org/10.1109/JBHI.2022.3193984
- Suárez, L.E.; Markello, R.D.; Betzel, R.F.; et al. Linking structure and function in macroscale brain networks. Trends Cognit. Sci., 2020, 24: 302−315. doi: https://doi.org/10.1016/j.tics.2020.01.008